1. 8:06 Straight Line Graphs Number Plane Investigation
Sally Kwon. 01 April 2010
1.
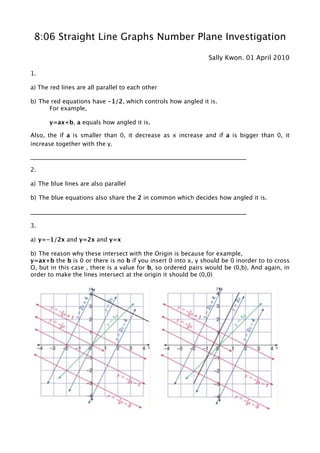
a) The red lines are all parallel to each other
b) The red equations have -1/2, which controls how angled it is.
For example,
y=ax+b, a equals how angled it is.
Also, the if a is smaller than 0, it decrease as x increase and if a is bigger than 0, it
increase together with the y.
_________________________________________________________________________
2.
a) The blue lines are also parallel
b) The blue equations also share the 2 in common which decides how angled it is.
_________________________________________________________________________
3.
a) y=-1/2x and y=2x and y=x
b) The reason why these intersect with the Origin is because for example,
y=ax+b the b is 0 or there is no b if you insert 0 into x, y should be 0 inorder to to cross
O, but in this case , there is a value for b, so ordered pairs would be (0,b). And again, in
order to make the lines intersect at the origin it should be (0,0)
2. _________________________________________________________________________
x -3 -2 -1 0 1 2 3 x -3 -2 -1 0 1 2 3
y -5 -3 -1 1 3 5 7 y 11 8 5 2 -1 -4 -7
4. a) it would be parallel to the red lines. b) it would be parallel to the blue lines.
5.
a)slope down for instance, y=2x+1, b) increase, when slope up, for example.
y=-3x+2
c) yes. the b represents that the line won’t intersect with O. It is similar to 3-b’s
explanation so I won’t repeat it. The constant represents where the line would meet the
y axis.
Criteria D
Explain alternative ways of graphing a line.
MY FIRST WAY IS THIS.
i) find to points (0,y) (x,0) and pick another point to make sure.
the reason why you should use this way is because it is where the line
meets x or y axis. Also, if the equation is y=ax+b,
(0,y) is (0,b) because_
y=ax+b, x=0 y=b so the coordinate is always the constant value.
3. (x,0) is (-b/a,0) because_
0=ax+b, -b=ax, so -b/a is the value for x when y is 0.
MY SECOND
WAY IS THIS.
ii)You could also draw a
graph with out constant
value, than move the lines.
to give an example, y=2x
+1, first draw y=2x, which is
the red line in this graph,
and if you move the red line
and make the line cross (0,1)
you will be able to get the
graph y=2x+1
As you can see, the the red
line is y=2x and black is
y=2x+1.