SlideShare a Scribd company logo
1 of 2
Investigation 8:06 | Straight line graphs<br />274320020320Please use the Assessment Grid on the<br />following page to help you understand<br />what is required for this Investigation.<br />On this number plane we have graphed two<br />‘families’ of lines; one set red, one set blue.<br />1 (a)  How are the red lines alike? <br />The red lines are parallel lines.<br />(b) How are the red equations alike?<br />All the red equations have -x in the equation.<br />2 (a ) How are the blue lines alike?<br />The blue lines are also parallel.<br />(b ) How are the blue equations alike?<br />They all have 2x in the equations.<br />3 (a ) Which lines intersect at the origin?<br />The green line: y=1x, the blue line: y=2x and the red line: y=-x intersect at the origin.<br />(b) How are the equations of these lines alike?<br />365760092710They all don’t have the constant number, like y=2x+3, 3 is the constant number.<br />4 (a ) Which lines would be parallel to y = − x + 4? (Graph this line.)<br />A:   y=− x + 4 is parallel to all the red lines: y=− x + 1,<br />y=− x , y=− x -1 and y=− x -3<br />(b)  Which lines would be parallel to y = 2x + 1? (Graph this line.)<br />A:   y = 2x + 1 is parallel to all the blue lines: y = 2x +4, y = 2x and y = 2x -4<br />205740085090<br />5 The equation of a line can be written in different ways. All of those graphed here are written in the form y = mx + b.<br />(a)Would all lines that have a negative<br />x term (eg y = − x + 4)<br />(slope down) or increase (slope up) as x increases in value?<br />A: Lines with a negative x term decrease when x increases the value, the line will slope down. Because in a number plane, the negative parts are at the bottom, so it will slope down. <br />(b) Would all lines that have a positive x term (eg y = 2x + 1) increase or decrease?<br />A:  Lines with a positive x term increase when x increases the value, the line will slope up. Because in a number plane the positive part is at the top, so of course it will slope up.<br />(c) By investigating these graphs, can you find some connection between the constant b in each equation (eg y = 2x + 4) and the graph of the line?<br />When b is bigger then 0 (positive), the dot should be at the top part of the number plane, when b is smaller then 0 (negative), the dot should be at the bottom part of the number plane. And when b equals zero, it go through from the middle of the number plane, which is from zero.<br />X-1-2-3y20-2<br />y = 2x + 4<br />x=-1, -2+4=y<br />x=-2, -4+4=y<br />x=-3, -6+4=y<br />
Investigation 8;06

More Related Content

What's hot

2.8 a absolute value functions
2.8 a absolute value functions2.8 a absolute value functions
2.8 a absolute value functionsfthrower
 
Graphing a line using Slope-Intercept form
Graphing a line using Slope-Intercept formGraphing a line using Slope-Intercept form
Graphing a line using Slope-Intercept formshepieces
 
Absolute value functions
Absolute value functionsAbsolute value functions
Absolute value functionsJessica Garcia
 
Graphs of linear equation
Graphs of linear equationGraphs of linear equation
Graphs of linear equationJunila Tejada
 
Graphing lines
Graphing linesGraphing lines
Graphing linesdazy1978
 
6.6 Graphing Inequalities In Two Variables
6.6 Graphing Inequalities In Two Variables6.6 Graphing Inequalities In Two Variables
6.6 Graphing Inequalities In Two Variablesguestd1dc2e
 
Linear equations part i
Linear equations part iLinear equations part i
Linear equations part icoburgmaths
 
Graph of linear equations
Graph of linear equationsGraph of linear equations
Graph of linear equationsanettebasco
 
Analytical geometry
Analytical geometryAnalytical geometry
Analytical geometrySiyavula
 
Absolute value functions
Absolute value functionsAbsolute value functions
Absolute value functionsAlexander Nwatu
 
2.8 Absolute Value Functions
2.8 Absolute Value Functions2.8 Absolute Value Functions
2.8 Absolute Value Functionshisema01
 
Graphing Absolute Value Functions
Graphing Absolute Value FunctionsGraphing Absolute Value Functions
Graphing Absolute Value Functionsms.stedman
 
Graphing Linear Functions
Graphing Linear FunctionsGraphing Linear Functions
Graphing Linear Functionshisema01
 
3 5 graphing linear inequalities in two variables
3 5 graphing linear inequalities in two variables3 5 graphing linear inequalities in two variables
3 5 graphing linear inequalities in two variableshisema01
 
GraphingLinearEquations
GraphingLinearEquationsGraphingLinearEquations
GraphingLinearEquationsTerry Gastauer
 

What's hot (18)

2.8 a absolute value functions
2.8 a absolute value functions2.8 a absolute value functions
2.8 a absolute value functions
 
Graphing a line using Slope-Intercept form
Graphing a line using Slope-Intercept formGraphing a line using Slope-Intercept form
Graphing a line using Slope-Intercept form
 
Absolute value functions
Absolute value functionsAbsolute value functions
Absolute value functions
 
Graphs of linear equation
Graphs of linear equationGraphs of linear equation
Graphs of linear equation
 
Graphing lines
Graphing linesGraphing lines
Graphing lines
 
6.6 Graphing Inequalities In Two Variables
6.6 Graphing Inequalities In Two Variables6.6 Graphing Inequalities In Two Variables
6.6 Graphing Inequalities In Two Variables
 
Linear equations part i
Linear equations part iLinear equations part i
Linear equations part i
 
Graph of linear equations
Graph of linear equationsGraph of linear equations
Graph of linear equations
 
Analytical geometry
Analytical geometryAnalytical geometry
Analytical geometry
 
Absolute value functions
Absolute value functionsAbsolute value functions
Absolute value functions
 
Graph theory
Graph theoryGraph theory
Graph theory
 
2.8 Absolute Value Functions
2.8 Absolute Value Functions2.8 Absolute Value Functions
2.8 Absolute Value Functions
 
Graphing Absolute Value Functions
Graphing Absolute Value FunctionsGraphing Absolute Value Functions
Graphing Absolute Value Functions
 
4.3
4.34.3
4.3
 
2.2 linear equations
2.2 linear equations2.2 linear equations
2.2 linear equations
 
Graphing Linear Functions
Graphing Linear FunctionsGraphing Linear Functions
Graphing Linear Functions
 
3 5 graphing linear inequalities in two variables
3 5 graphing linear inequalities in two variables3 5 graphing linear inequalities in two variables
3 5 graphing linear inequalities in two variables
 
GraphingLinearEquations
GraphingLinearEquationsGraphingLinearEquations
GraphingLinearEquations
 

Similar to Investigation 8;06

Lecture 07 graphing linear equations
Lecture 07 graphing linear equationsLecture 07 graphing linear equations
Lecture 07 graphing linear equationsHazel Joy Chong
 
Solving Quadratics
Solving QuadraticsSolving Quadratics
Solving Quadraticsallie125
 
linear equation in two variable.pptx
linear equation in two variable.pptxlinear equation in two variable.pptx
linear equation in two variable.pptxKirtiChauhan62
 
CLASS 9 LINEAR EQUATIONS IN TWO VARIABLES PPT
CLASS 9 LINEAR EQUATIONS IN TWO VARIABLES PPTCLASS 9 LINEAR EQUATIONS IN TWO VARIABLES PPT
CLASS 9 LINEAR EQUATIONS IN TWO VARIABLES PPT05092000
 
Math - analytic geometry
Math - analytic geometryMath - analytic geometry
Math - analytic geometryimmortalmikhel
 
Linear equation in one variable PPT.pdf
Linear equation in one variable PPT.pdfLinear equation in one variable PPT.pdf
Linear equation in one variable PPT.pdfmanojindustry
 
WRITING AND GRAPHING LINEAR EQUATIONS 1.pptx
WRITING AND GRAPHING LINEAR EQUATIONS 1.pptxWRITING AND GRAPHING LINEAR EQUATIONS 1.pptx
WRITING AND GRAPHING LINEAR EQUATIONS 1.pptxKristenHathcock
 
chapter1_part2.pdf
chapter1_part2.pdfchapter1_part2.pdf
chapter1_part2.pdfAliEb2
 
2.2 linear equations and 2.3 Slope
2.2 linear equations and 2.3 Slope2.2 linear equations and 2.3 Slope
2.2 linear equations and 2.3 SlopeJessica Garcia
 
Class 10 mathematics compendium
Class 10 mathematics compendiumClass 10 mathematics compendium
Class 10 mathematics compendiumAPEX INSTITUTE
 
Graphing, Slope, And Special Lines
Graphing, Slope, And Special LinesGraphing, Slope, And Special Lines
Graphing, Slope, And Special Lineskliegey524
 
Coordinate System.pptx
Coordinate System.pptxCoordinate System.pptx
Coordinate System.pptxKeizylleCajeme
 
Coordinate System.pptx
Coordinate System.pptxCoordinate System.pptx
Coordinate System.pptxKeizylleCajeme
 
Finding Slope 2009
Finding Slope 2009Finding Slope 2009
Finding Slope 2009patrickhello
 
College Algebra 2.1
College Algebra 2.1College Algebra 2.1
College Algebra 2.1Jeneva Clark
 

Similar to Investigation 8;06 (20)

Lecture 07 graphing linear equations
Lecture 07 graphing linear equationsLecture 07 graphing linear equations
Lecture 07 graphing linear equations
 
Solving Quadratics
Solving QuadraticsSolving Quadratics
Solving Quadratics
 
LINEAR FUNCTIONS
LINEAR FUNCTIONSLINEAR FUNCTIONS
LINEAR FUNCTIONS
 
linear equation in two variable.pptx
linear equation in two variable.pptxlinear equation in two variable.pptx
linear equation in two variable.pptx
 
Cal 3
Cal 3Cal 3
Cal 3
 
CLASS 9 LINEAR EQUATIONS IN TWO VARIABLES PPT
CLASS 9 LINEAR EQUATIONS IN TWO VARIABLES PPTCLASS 9 LINEAR EQUATIONS IN TWO VARIABLES PPT
CLASS 9 LINEAR EQUATIONS IN TWO VARIABLES PPT
 
Math project
Math projectMath project
Math project
 
Math - analytic geometry
Math - analytic geometryMath - analytic geometry
Math - analytic geometry
 
Linear equation in one variable PPT.pdf
Linear equation in one variable PPT.pdfLinear equation in one variable PPT.pdf
Linear equation in one variable PPT.pdf
 
WRITING AND GRAPHING LINEAR EQUATIONS 1.pptx
WRITING AND GRAPHING LINEAR EQUATIONS 1.pptxWRITING AND GRAPHING LINEAR EQUATIONS 1.pptx
WRITING AND GRAPHING LINEAR EQUATIONS 1.pptx
 
chapter1_part2.pdf
chapter1_part2.pdfchapter1_part2.pdf
chapter1_part2.pdf
 
2.2 linear equations and 2.3 Slope
2.2 linear equations and 2.3 Slope2.2 linear equations and 2.3 Slope
2.2 linear equations and 2.3 Slope
 
Class 10 mathematics compendium
Class 10 mathematics compendiumClass 10 mathematics compendium
Class 10 mathematics compendium
 
Graphing, Slope, And Special Lines
Graphing, Slope, And Special LinesGraphing, Slope, And Special Lines
Graphing, Slope, And Special Lines
 
Coordinate System.pptx
Coordinate System.pptxCoordinate System.pptx
Coordinate System.pptx
 
Coordinate System.pptx
Coordinate System.pptxCoordinate System.pptx
Coordinate System.pptx
 
Coordinate Plane 2.ppt
Coordinate Plane 2.pptCoordinate Plane 2.ppt
Coordinate Plane 2.ppt
 
Finding Slope 2009
Finding Slope 2009Finding Slope 2009
Finding Slope 2009
 
3D-PPt MODULE 1.pptx
3D-PPt MODULE 1.pptx3D-PPt MODULE 1.pptx
3D-PPt MODULE 1.pptx
 
College Algebra 2.1
College Algebra 2.1College Algebra 2.1
College Algebra 2.1
 

More from gdiane

Dianes+revised+report
Dianes+revised+reportDianes+revised+report
Dianes+revised+reportgdiane
 
Biomimicry process journal pdf
Biomimicry process journal  pdfBiomimicry process journal  pdf
Biomimicry process journal pdfgdiane
 
Evaluation pdf
Evaluation pdfEvaluation pdf
Evaluation pdfgdiane
 
Biomimicry process journal
Biomimicry process journal Biomimicry process journal
Biomimicry process journal gdiane
 
马卡龙
马卡龙马卡龙
马卡龙gdiane
 
草稿
草稿草稿
草稿gdiane
 
Poster 3
Poster 3Poster 3
Poster 3gdiane
 
Mission to mars
Mission to mars Mission to mars
Mission to mars gdiane
 
Diane guo
Diane guoDiane guo
Diane guogdiane
 
Chi di
Chi diChi di
Chi digdiane
 
Is christopher's father a good father
Is christopher's father a good fatherIs christopher's father a good father
Is christopher's father a good fathergdiane
 
Is christopher's father a good father
Is christopher's father a good fatherIs christopher's father a good father
Is christopher's father a good fathergdiane
 
2011 12-9
2011 12-92011 12-9
2011 12-9gdiane
 
2011 11-21
2011 11-212011 11-21
2011 11-21gdiane
 
Tomorrow when the war began
Tomorrow when the war beganTomorrow when the war began
Tomorrow when the war begangdiane
 
User trail of the moving toy
User trail of the moving toyUser trail of the moving toy
User trail of the moving toygdiane
 
User trail of the moving toy
User trail of the moving toyUser trail of the moving toy
User trail of the moving toygdiane
 
The move it project evaluation
The move it project evaluationThe move it project evaluation
The move it project evaluationgdiane
 
2011 5-16
2011 5-162011 5-16
2011 5-16gdiane
 

More from gdiane (20)

Dianes+revised+report
Dianes+revised+reportDianes+revised+report
Dianes+revised+report
 
Biomimicry process journal pdf
Biomimicry process journal  pdfBiomimicry process journal  pdf
Biomimicry process journal pdf
 
Evaluation pdf
Evaluation pdfEvaluation pdf
Evaluation pdf
 
Biomimicry process journal
Biomimicry process journal Biomimicry process journal
Biomimicry process journal
 
马卡龙
马卡龙马卡龙
马卡龙
 
草稿
草稿草稿
草稿
 
Poster 3
Poster 3Poster 3
Poster 3
 
Mission to mars
Mission to mars Mission to mars
Mission to mars
 
Diane guo
Diane guoDiane guo
Diane guo
 
Chi di
Chi diChi di
Chi di
 
Chi d
Chi dChi d
Chi d
 
Is christopher's father a good father
Is christopher's father a good fatherIs christopher's father a good father
Is christopher's father a good father
 
Is christopher's father a good father
Is christopher's father a good fatherIs christopher's father a good father
Is christopher's father a good father
 
2011 12-9
2011 12-92011 12-9
2011 12-9
 
2011 11-21
2011 11-212011 11-21
2011 11-21
 
Tomorrow when the war began
Tomorrow when the war beganTomorrow when the war began
Tomorrow when the war began
 
User trail of the moving toy
User trail of the moving toyUser trail of the moving toy
User trail of the moving toy
 
User trail of the moving toy
User trail of the moving toyUser trail of the moving toy
User trail of the moving toy
 
The move it project evaluation
The move it project evaluationThe move it project evaluation
The move it project evaluation
 
2011 5-16
2011 5-162011 5-16
2011 5-16
 

Investigation 8;06

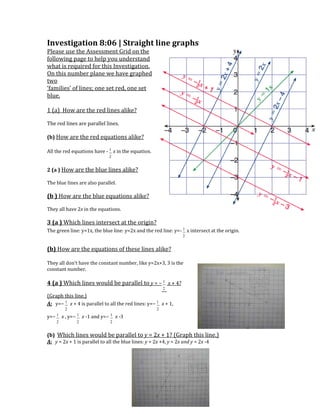
  • 1. Investigation 8:06 | Straight line graphs<br />274320020320Please use the Assessment Grid on the<br />following page to help you understand<br />what is required for this Investigation.<br />On this number plane we have graphed two<br />‘families’ of lines; one set red, one set blue.<br />1 (a) How are the red lines alike? <br />The red lines are parallel lines.<br />(b) How are the red equations alike?<br />All the red equations have -x in the equation.<br />2 (a ) How are the blue lines alike?<br />The blue lines are also parallel.<br />(b ) How are the blue equations alike?<br />They all have 2x in the equations.<br />3 (a ) Which lines intersect at the origin?<br />The green line: y=1x, the blue line: y=2x and the red line: y=-x intersect at the origin.<br />(b) How are the equations of these lines alike?<br />365760092710They all don’t have the constant number, like y=2x+3, 3 is the constant number.<br />4 (a ) Which lines would be parallel to y = − x + 4? (Graph this line.)<br />A: y=− x + 4 is parallel to all the red lines: y=− x + 1,<br />y=− x , y=− x -1 and y=− x -3<br />(b) Which lines would be parallel to y = 2x + 1? (Graph this line.)<br />A: y = 2x + 1 is parallel to all the blue lines: y = 2x +4, y = 2x and y = 2x -4<br />205740085090<br />5 The equation of a line can be written in different ways. All of those graphed here are written in the form y = mx + b.<br />(a)Would all lines that have a negative<br />x term (eg y = − x + 4)<br />(slope down) or increase (slope up) as x increases in value?<br />A: Lines with a negative x term decrease when x increases the value, the line will slope down. Because in a number plane, the negative parts are at the bottom, so it will slope down. <br />(b) Would all lines that have a positive x term (eg y = 2x + 1) increase or decrease?<br />A: Lines with a positive x term increase when x increases the value, the line will slope up. Because in a number plane the positive part is at the top, so of course it will slope up.<br />(c) By investigating these graphs, can you find some connection between the constant b in each equation (eg y = 2x + 4) and the graph of the line?<br />When b is bigger then 0 (positive), the dot should be at the top part of the number plane, when b is smaller then 0 (negative), the dot should be at the bottom part of the number plane. And when b equals zero, it go through from the middle of the number plane, which is from zero.<br />X-1-2-3y20-2<br />y = 2x + 4<br />x=-1, -2+4=y<br />x=-2, -4+4=y<br />x=-3, -6+4=y<br />