
Recommended
More Related Content
What's hot
What's hot (20)
Similar to Minear & Company case examples
Similar to Minear & Company case examples (20)
Recently uploaded
Recently uploaded (20)
Minear & Company case examples
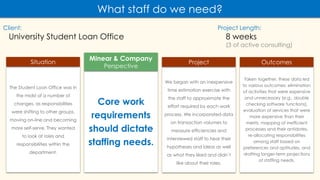
- 1. University Student Loan Office Client: What staff do we need? Project Length: 8 weeks (3 of active consulting) The Student Loan Office was in the midst of a number of changes, as responsibilities were shifting to other groups, moving on-line and becoming more self-serve. They wanted to look at roles and responsibilities within the department. Core work requirements should dictate staffing needs. We began with an inexpensive time estimation exercise with the staff to approximate the effort required by each work process. We incorporated data on transaction volumes to measure efficiencies and interviewed staff to hear their hypotheses and ideas as well as what they liked and didn’t like about their roles. Taken together, these data led to various outcomes: elimination of activities that were expensive and unnecessary (e.g., double checking software functions), evaluation of services that were more expensive than their merits, mapping of inefficient processes and their antidotes, re-allocating responsibilities among staff based on preferences and aptitudes, and drafting longer-term projections of staffing needs. Situation Project Outcomes Minear & Company Perspective
- 2. As part of the American Recovery and Reinvestment Act (ARRA), recipients of Federal research grants were required to provide quarterly financial and progress reports. These requirements were outside the department’s established reporting processes. Initial efforts to address them were requiring hundreds of effort-hours each quarter. Where processes involve clear rules, use technology to implement them. The project focused on 2 components: 1) an automated batch process to take financial data from university systems and automatically generate the reports; and 2) a simple web interface to easily collect progress updates from researchers all in one place. Once the rules for how reports should be populated were clear, the tool development went quickly. Time tracking indicated that the new process cut out more than 75% of the effort requirements of the one it replaced. Reports were completed and automatically submitted in a fraction of the time it had taken to complete the process manually. The process also completely eliminated calculation and translation errors from the financial portion of the reports. Situation Project Outcomes Minear & Company Perspective University Office of Sponsored Programs Client: How can we quickly and easily address new requirements? Project Length: 2 Reporting Quarters (3 weeks of active consulting)
- 3. A small group responsible for delivering certain financial services to internal university clients was struggling to deliver the service levels it felt were appropriate. The capacity of the group was stretched thin. They needed answers that were not simply “do more.” Efficiency improvement begins with understanding what matters. We interviewed the staff to understand their focus and had them estimate how they spent their time in order to understand how the department was investing its resources. To identify where improvements were most needed, we held one-on-one interviews with a handful of key clients. When compared, we saw a clear mismatch between client service expectations and how the group implicitly viewed its mission, as indicated by how it saw its responsibilities and how it collectively invested its time. We recommended exercises to clarify the group’s mission and services, followed by development of explicit service delivery processes and corresponding client communications. Situation Minear & Company Perspective Project Outcomes University Financial Service Team Client: How can we upgrade our service levels? Project Length: 7 weeks (1 of active consulting)
- 4. The group was having difficultly answering the question, “How are we doing?” They had vague attitudinal measures from an annual student survey, a count of help desk issues but no sense of how well they were resolved, scattered systems performance data, inconsistent project metrics, and no idea of service costs. The quality of performance measurements is far more important than which tools are used to gather them. The first step was to define a set of metrics based on “success” in fulfilling the group’s mission. Next we looked for ways to collect representative, comparable, and actionable data using existing technology wherever possible. We implemented annual customer surveys using a low-cost online tool, used the help desk ticketing application to collect transactional satisfaction data, used the existing project management tool for daily effort tracking, and created semi- automated dashboards in Excel. Because we had integrated our data collection with existing tools and processes, we had excellent response rates. We combined customer and employee data with operational data to create weekly dashboards that directly answered questions such as: How often do we deliver individual services? How well? How do customers rate them? What does each project and service cost? What’s changing? Where are we improving? Situation Project Outcomes Minear & Company Perspective University IT Client: How can we measure and understand our performance? Project Length: ~1 year
- 5. A research department was in a growth phase that was expected to accelerate. The finance team was struggling to keep up. They wanted to investigate what processes, skills, tools and staff positions would be needed to help them grow successfully. Improve productivity before increasing headcount. To really understand the work requirements, time was spent on-site closely observing processes and interacting with staff. A staff exercise provided estimates on process investments. Further interviews were conducted with clients, external stakeholders, and best practice departments. Benchmarking data provided additional context. The data displayed lower-than- average productivity measures while observation showed significant time lost in back-and- forth, both with clients and within the team. Brochures and job aids were created to simplify policies and outline consistent decision rules. Simple processes were automated. Broader automation opportunities were examined. Staffing model options and leadership requirements were provided for forward planning. Situation Project Outcomes Minear & Company Perspective Medical School Research Department Client: How should we prepare for growth? Project Length: 8 weeks (5 of active consulting)
- 6. The IT group had grown quickly since inception in response to rapidly increasing customer demands. At nearly 200 staff members, its practice of offering custom, reactive, on- demand services to all parties was becoming problematic. They recognized the need to define and articulate a set of core offerings. A clear mission is one that can anchor an effective service catalog, a strong brand, and a useful portfolio of strategic measures. We worked with senior executives to define 5 “Principles of Service” that differentiated the areas in which their aims were to be “innovative” and/or “best in class” from those where focus was on “reliable, effective, and efficient” service. We linked these principles to broader university mission statements and re-framed project and service descriptions around them. We incorporated the new positioning into 4 key deliverables: 1) a marketing booklet distributed to all clients to demonstrate how the group delivered on its principles, 2.) a charter aligning the overall mission, sub-unit mission statements, service offerings, service catalog, and org structure, 3.) an on-line service catalog framed in a “How do I” customer perspective, and 4.) a reframing of customer surveys around the principles. Situation Project Outcomes Minear & Company Perspective University IT Client: How do we define ourselves and our offerings? Project Length: 18 weeks (14 of active consulting)
- 7. The HR group wanted to take a look at some basic HR data that had been collected for the past several years to see what it had to say as well as how it might inform their thinking about a larger metrics strategy. HR strategies are most effective when informed by how an individual’s work impacts the overall mission. We analyzed the data to 1) compare to external benchmarks (e.g., tenure), 2.) view trends over time (esp., cost per function), and 3.) examine informative ratios such as direct and indirect investments (i.e., core service roles vs. management, IT, HR, etc.). We also grouped roles to look at the work requirements of various functions in terms of analytic vs. processing skills. We advocated a focus on the value of each role and each individual’s performance in their role. We outlined how to collect the required data and a set of useful metrics to guide high-impact HR strategies (e.g., merit pay for high performers in high value roles; re-training for high performers in low value roles; swift replacement for low performers in high value roles). Situation Project Outcomes Minear & Company Perspective HR for Financial Administration & Alumni Affairs Client: What can and should our HR data tell us? Project Length: 3 weeks (1 of active consulting)
- 8. Given a heterogeneous and demanding client base, the process of deciding which projects to fund each year was precarious and political. The lack of transparency invariably engendered resentments. While costs could be compared, there was no clear way to compare the relative advantages of different projects with widely different aims. All organizations need “benefit” criteria that can be transparently ranked, weighted, measured, and compared. The first step was to translate the mission components into measurable operational and attitudinal criteria. Next we specified discrete levels of scope and outcome. We then worked with a project team of senior managers to collectively assemble a set of weightings for those levels. Lastly, we built a tool to apply the methodology. The result was a “Benefit Calculator” that was able to assign a score to each potential project based on the project aims and anticipated outcomes. At the end of each project, these outcomes could be measured using a system of standardized surveys and collected measures. Situation Project Outcomes Minear & Company Perspective University IT Client: How can we prioritize projects more objectively? Project Length: 15 weeks (6 of active consulting)
- 9. The group’s management was feeling conflicting pressures about whether or not to add more staff: the existing staff were feeling stretched but the larger university was looking to shrink budgets. They needed on-going insight into where staff were necessary and how to make the case for them. Costs-of- services should be the foundational metrics for an administrative service bureau. To develop an understanding of what resources were needed and where, we set out to answer: “What does it take to deliver each service and what are the sources of variation in those requirements?” We outlined the activities that comprised the service delivery processes and had staff track their time on a weekly basis. We combined the activity tracking data with operational data and created a system of dashboards that could give information by employee, by individual customer, by customer’s department, by activity, by service, by grant, by sponsor, and by time period. This provided staffing requirement benchmarks as well as service cost data to compare to alternative delivery methods. Situation Project Outcomes Minear & Company Perspective University Office of Sponsored Programs Client: How can we consistently know how many resources we need? Project Length: ~ 1 year (10 weeks of active consulting)
- 10. Analysis of the group’s cost-of- service data showed a disproportionate amount of investment was consumed by highly standardized operations (e.g., report production and compliance monitoring). Metrics such as cost-per-report compared poorly to external benchmarks. Rapid prototyping is essential to fully capturing business requirements. We conducted several weeks of interviewing and job shadowing to outline business requirements. We then mocked up a prototype for review. We were able to build a fully functional portal within 3 months. As exceptional cases were identified, we rapidly updated the prototype to handle them. At the end of 3 months, the time it took to complete 200 standard invoices had gone from 250 hours each month to less than 1. After several additional rounds of iteration, the majority of reports and invoices could be completed and mailed to sponsors with just 2 button clicks. In addition, most research departments were taking advantage of the system’s automated compliance monitoring features. Situation Project Outcomes Minear & Company Perspective University Office of Sponsored Programs Client: How do we modernize our operations? Project Length: ~ 2 years Operational in 3 months