Visual Models of Circular Flow and PPO Frontiers
•Download as DOCX, PDF•
0 likes•209 views

1st & 2nd Model

Recommended
More Related Content
What's hot
What's hot (20)
Viewers also liked
Similar to Visual Models of Circular Flow and PPO Frontiers
Similar to Visual Models of Circular Flow and PPO Frontiers (20)
More from Ghulam Mehdi
More from Ghulam Mehdi (20)
Recently uploaded
Recently uploaded (20)
Visual Models of Circular Flow and PPO Frontiers
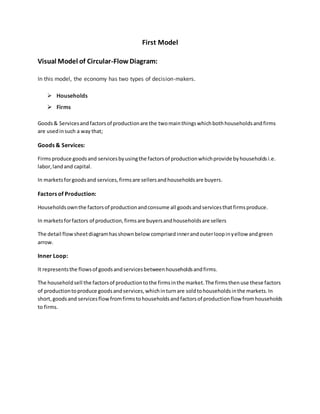
- 1. First Model Visual Model of Circular-FlowDiagram: In this model, the economy has two types of decision-makers. Households Firms Goods& Servicesandfactorsof productionare the twomainthingswhichbothhouseholdsandfirms are usedinsuch a way that; Goods & Services: Firmsproduce goodsand servicesbyusingthe factorsof productionwhichprovide byhouseholdsi.e. labor,landand capital. In marketsforgoodsand services,firmsare sellersandhouseholdsare buyers. Factors of Production: Householdsownthe factorsof productionandconsume all goodsandservicesthatfirmsproduce. In marketsforfactors of production,firmsare buyersandhouseholdsare sellers The detail flowsheetdiagramhasshownbelow comprisedinnerandouterloopinyellow andgreen arrow. Inner Loop: It representsthe flowsof goodsandservicesbetweenhouseholdsandfirms. The householdsell the factorsof productiontothe firmsinthe market.The firmsthenuse these factors of productiontoproduce goodsandservices,whichinturnare soldtohouseholdsinthe markets.In short,goodsand servicesflowfromfirmstohouseholdsandfactorsof productionflow fromhouseholds to firms.
- 2. Circular-Flow Chart Outer Loop: It representsthe flowof rupees.The householdsspendmoneytobuygoodsand servicesfromthe firms. The firmsuse some of the revenue fromthese salestopayfor the factors of production,suchas the salaryto the workers. In short , spending of goods and services flow from households to firms and income in the form of rupees flows from firms to households.
- 3. Second Model Visual Model for ProductionPossibility Frontier: Consider an economy that produces only two goods; Cars Computers. Both these are the economy’s factors of production. The production possibilities frontier is a graph that shows the various combinations of output. In this case, cars and computers, that the economy can possibly produce given the available factors of production and the available production technology that firm can use to turn these factors into output. Production Possibilities Frontier Diagram In this economy, if all resources were used in the car industry, the economy would produce 1,000 cars and no computers. If all resources were used in the computer industry, the economy would produce 3,000 computers and no cars. The two end points are the extreme possibilities. If the economy were to divide its resources between the two industries, it could produce 700 cars and 2,000 computers, shown in the figure by point A. By contrast, the outcome at point D is not possible because resources are scarce. The economy can produce at any point on or
- 4. inside the production possibilities frontier, but it cannot produce at points outside the frontier. An outcome is said to be efficient if the economy is getting all it can from the scarce resources it has available. Points on (rather than inside) the production possibilities frontier represent efficient levels of production. When the economy is producing at such a point, say point A, there is no way to produce more of one good without producing less of the other. Point B represents an inefficient outcome. For some reason, perhaps widespread unemployment, the economy is producing less than it could from the resources it has available. It is producing only 300 cars and 1,000 computers. If the source of the inefficiency were eliminated, the economy could move from point B to point A, increasing production of both cars (700) and computers (2,000). The production possibilities frontier shows one tradeoff that society faces. Once we have reached the efficient points on the frontier, the only way of getting more of one good is to get less of the other. When the economy moves from point A to point C, for instance, society produces more computers but at the expense of producing fewer cars. The production possibilities frontier shows the opportunity cost of one good as measured in terms of the other good. When society reallocates some of the factors of production from the car industry to the computer industry, moving the economy from point A to point C, it gives up 100 cars to get 200 additional computers. In other words, when the economy is at point A, the opportunity cost of 200 computers is 100 cars. The production possibilities frontier is bowed outward in below diagram. This means that the opportunity cost of cars in terms of computers depends on how much of each good the economy is producing. When the economy is using most of its resources to make cars, the
- 5. Production Possibilities Frontier Diagram production possibilities frontier is quite steep. Because even workers and machines best suited to making computers are being used to make cars, the economy gets a substantial increase in the number of computers for each car it gives up. By contrast, when the economy is using most of its resources to make computers, the production possibilities frontier is quite flat. In this case, the resources best suited to making computers are already in the computer industry, and each car the economy gives up yields only a small increase in the number of computers. The production possibilities frontier shows the tradeoff between the production of different goods at a given time, but the tradeoff can change over time. For example, if a technological advance in the computer industry raises the number of computers that a worker can produce per week, the economy can make more computers for any given number of cars. As a result, the production possibilities frontier shifts outward, as in diagram. Because of this economic growth, society might move production from point A to point E, enjoying more computers and more cars.