Transcript: New from BookNet Canada for 2024: BNC CataList - Tech Forum 2024
Ch2.8 Display Data
1. Ch2.8_DisplayData.notebook September 21, 2011
Chapter 2.8
Display Data
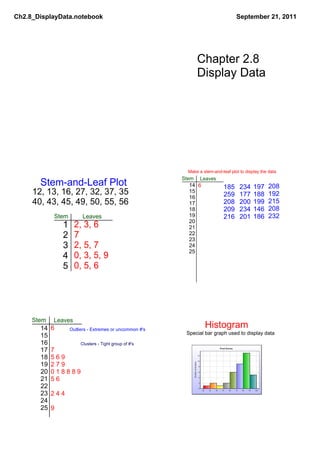
Make a stemandleaf plot to display the data
Stem Leaves
StemandLeaf Plot 14 6 185 234 197 208
12, 13, 16, 27, 32, 37, 35 15
259 177 188 192
16
40, 43, 45, 49, 50, 55, 56 17 208 200 199 215
18 209 234 146 208
Stem Leaves 19 216 201 186 232
20
1 2, 3, 6 21
2 7 22
23
3 2, 5, 7 24
25
4 0, 3, 5, 9
5 0, 5, 6
Stem Leaves
14 6 Outliers Extremes or uncommon #'s
Histogram
Special bar graph used to display data
15
16 Clusters Tight group of #'s
17 7
18 5 6 9
19 2 7 9
20 0 1 8 8 8 9
21 5 6
22
23 2 4 4
24
25 9
2. Ch2.8_DisplayData.notebook September 21, 2011
Example
13 #
12 10
11 9
10 8
Frequency
9 7
8 6
7 5
6 4
5 3
4 2
1
3
Orange Red Blue Green Turquoise
2
1
Jan | Feb | Mar | Apr | May | Jun | Jul | Aug | Sept | Oct | Nov | Dec.
Color
Birth Month
Project
Think of a survey question
that has numerical responses.
Examples:
How many cars does your family own?
How old are your parents or siblings?
What are your favorite numbers between 1 and 40?
How many concerts have you been to?
Survey everyone in the class and compile the data.
Calculate the mean, median, and mode of your data
Create a stemandleaf chart for the data and identify
outliers and clusters.
Create a histogram that represents the data.