SlideShare a Scribd company logo
1 of 55
Cognitive Processes in the Breakfast Task: Planning and
Monitoring
Nathan S. Rose
Rotman Research Institute at Baycrest, Toronto, Canada
Lin Luo and Ellen Bialystok
York University
Alexandra Hering, Karen Lau, and Fergus I. M. Craik
Rotman Research Institute at Baycrest, Toronto, Canada
The Breakfast Task (Craik & Bialystok, 2006) is a computerized
task that simulates the planning and
monitoring requirements involved in cooking breakfast, an
everyday activity important for functional
independence. In Experiment 1, 28 adults performed the
Breakfast Task, and outcome measures were
examined with principal component analysis to elucidate the
structure of cognitive processes underlying
performance. Analyses revealed a 2-component structure which
putatively captured global planning and
local monitoring abilities. In Experiment 2, the structure of
Breakfast Task performance was cross-
validated on a new sample of 59 healthy older adults who also
performed tests assessing working
memory, processing speed, inhibition, reasoning and
prospective memory. Factor analyses showed that
the global planning component from the Breakfast Task was
significantly correlated with individual
differences in executive functions but the local monitoring
component was independent of such func-
tions. The Breakfast Task provides a fast, enjoyable, and
lifelike assessment of complex everyday
planning and monitoring, and their underlying processes such as
working memory and executive
functions.
Keywords: planning, monitoring, working memory, prospective
memory, executive processes
The cognitive processes underlying many everyday activities,
such as running errands, shopping for groceries, or preparing a
meal, are surprisingly complex. To complete such activities it is
necessary to formulate a sequence of actions to achieve the
goals,
store and update the action plan in working memory, and con-
sciously monitor and coordinate the execution of subtasks.
These
aspects of cognitive processes are often grouped under the um-
brella term planning (Morris & Ward, 2005). Efficient planning
clearly depends on a multitude of cognitive processes, but the
relative contribution of specific processes is less clear, and their
apparent involvement may depend both on the particular task
and
on how planning is assessed.
Laboratory studies investigating planning behaviour typically
adopt one of two general approaches (Ward & Morris, 2005).
The
first approach is represented by tower tasks, such as Tower of
Hanoi and its variants (e.g., Owen, 2005), in which participants
are
required to solve an unfamiliar problem following a set of
restric-
tions. This approach has the advantage of experimental control,
but
is often criticised for its limited applicability to everyday situa-
tions. The second approach, in contrast, uses tasks in which the
goals and contexts are common in everyday life. Examples of
this
method include errand tasks and their variants (Burgess,
Simons,
Coates, & Channon, 2005), in which participants are given a
series
of tasks to perform in a set order, typically in real-life settings.
This approach has the advantage of better ecological validity,
but
the complexity of such tasks reduces the ability to specify the
cognitive components. The present study aims to give a fuller
description of the cognitive processes involved in planning by
using a simulated “real-life” task that has both ecological
validity
and experimental control.
The task in question is the Breakfast Task (Craik & Bialystok,
2006), which is a computerized task that simulates the planning
and task management requirements in a common everyday situa-
tion: cooking breakfast. The task is described in detail later, but
in
overview the participant’s task was to “cook” five breakfast
foods
in such a way that the five foods were not over- or undercooked,
and were “ready to serve” at the same time. The task was imple-
mented on a touch-screen computer, and participants started and
stopped cooking each food by pressing the START and STOP
buttons next to the icon indicating that food (see Figure 1).
Cooking progress of each food was indicated by a countdown
timer running in real time. Between starting and stopping
cooking,
the participant also carried out a table-setting task as a
background
This article was published Online First May 4, 2015.
Nathan S. Rose, Rotman Research Institute at Baycrest,
Toronto, Can-
ada; Lin Luo and Ellen Bialystok, Department of Psychology,
York Uni-
versity; Alexandra Hering, Karen Lau, and Fergus I. M. Craik,
Rotman
Research Institute at Baycrest.
None of the authors has any financial interest or will receive
any
financial benefit from the work reported in this article. This
work was
supported by Grant 8261-03 to Fergus I. M. Craik from the
Natural
Sciences and Engineering Research Council of Canada, Grant
MOP57482
to Ellen Bialystok and Fergus I. M. Craik from the Canadian
Institutes of
Health Research, and a Kickstart Grant from the Centre for
Brain Fitness
to Nathan S. Rose and Fergus I. M. Craik. We thank Sharyn
Kreuger, Jane
Logan, Ashley Morgan, Evelyn Zastepa, Karen Lau, Yunjo Lee,
Jenna
Ware, and Brittany Murphy for their help with data collection
and scoring.
Correspondence concerning this article should be addressed to
Fergus
I. M. Craik, Rotman Research Institute at Baycrest, 3560
Bathurst Street,
Toronto, Ontario M6A 2E1, Canada. E-mail: [email protected]
Canadian Journal of Experimental Psychology / Revue
canadienne de psychologie expérimentale © 2015 Canadian
Psychological Association
2015, Vol. 69, No. 3, 252–263 1196-1961/15/$12.00
http://dx.doi.org/10.1037/cep0000054
252
activity. The overall task was to coordinate and manage cooking
the foods, while setting as many places as possible.
The Breakfast Task clearly demands good multitasking abilities
to perform it efficiently, and previous studies have provided
mod-
els of planning in a multitasking context. As one example,
Burgess, Veitch, de Lacy Costello, and Shallice (2000) studied
the
performance of 60 brain-damaged patients and 60 controls on
the
Greenwich Test, which consists of three complex open-ended
tasks
to be performed in 10 min. Their data suggested a three-factor
model consisting of memory, planning, and intention, with plan-
ning and intention (including prospective memory) being depen-
dent on good learning and memory for the rules governing the
task.
A subsequent study by Logie, Trawley, and Law (2011)
followed
up the Burgess et al. (2000) findings but used healthy young
adults
as participants. They used a multiple-errands task performed in
a
virtual environment: a 3-D model of a four-story building.
Logie
and colleagues (2011) confirmed the three-factor structure of
memory, planning, and intention proposed by Burgess and col-
leagues, although memory was not as crucial as a precursor for
planning as in the earlier study. Additionally, Logie and
colleagues
found that a measure of spatial working memory was a strong
predictor of success in their task. Interestingly they used the
Breakfast Task as their measure of prospective memory but
found
that Breakfast Task performance did not predict success on their
multiple-errand task.
As a tentative summary statement, it may be suggested that the
factor structure of different multitasking situations will vary de-
pending on the precise needs of each particular task. Thus, for
example, the Greenwich Test used by Burgess et al. (2000) re-
quires substantial learning of complex rules, so planning and
intention depended on adequate learning and memory. The task
used by Logie et al. (2011) required retention of visuospatial
information so it makes sense that visual working memory was a
strong predictor of success in their experiment. In the case of
the
Breakfast Task we predicted that good performance would
depend
on the ability to formulate and execute a plan, and to maintain
the
overall goal in mind while monitoring and executing the
subgoals.
Craik and Bialystok (2006) proposed that the cognitive abilities
involved in achieving these goals include working memory, to
hold both the general plan and the progress of each food in
mind,
task switching to switch efficiently between cooking and table
setting, and prospective memory, to remember to start and stop
foods appropriately.
The Breakfast Task measures are sensitive to factors known to
affect executive functioning and prospective memory, such as
healthy aging (Craik & Bialystok, 2006; Kerr, 1991), bilingual-
ism (Craik & Bialystok, 2006), and neurological pathologies
(Bialystok, Craik, & Stefurak, 2008; West, McNerney, &
Krauss,
2007), providing some support for their validity. However, the
interpretation of the measures was substantially intuitive. No
direct
evidence is yet available to establish the relationship between
each
measure and its proposed underlying cognitive processes. The
primary purpose of the present study was thus to provide a more
principled description of the cognitive processes involved in the
Breakfast Task itself; a secondary purpose was the more general
Figure 1. A sample screen for the one-screen condition of the
Breakfast Task, showing foods in the process
of being cooked. Neither the toast nor the coffee has been
started, so their cooking indicators are not yet shown.
The eggs and pancakes have each been cooking for a few
seconds, and the sausages have been cooking for over
1½ min (Reproduced with permission from Craik & Bialystok,
2006). See the online article for the color version
of this figure.
253COGNITIVE PROCESSES IN THE BREAKFAST TASK
one of providing more information on the cognitive processes
that
contribute to efficient planning and task management behaviour.
In the first experiment we tested 28 adults aged 39–68 years on
the Breakfast Task. We performed principal component analysis
(PCA) on the set of breakfast measures to examine the structure
of
performance. In the second experiment we tested an
independent
sample of 59 healthy older adults on the task—to cross-validate
the
structure of Breakfast Task performance—and on a range of
tests
of cognitive functions. These tests focused on the measurement
of
executive functions (EF) and prospective memory (PM), the
main
candidate processes underlying complex planning activities.
Just
as planning is not a unitary construct, neither should executive
functions and prospective memory be regarded as unitary con-
structs. We therefore included multiple tests and measures to
reflect different aspects of these abilities. We performed explor-
atory factor analyses on the sets of EF and PM measures to
extract
processing components tapped by these measures, and then
exam-
ined the relations between these processing components and the
breakfast measures with correlational analyses. Again, the
primary
purpose of this paper was to provide a detailed account of the
processes measured by the Breakfast Task, rather than to test
any
particular model of planning and multitasking. Because of this,
and
the relatively small sample sizes, the analysis techniques used
were
exploratory ones (PCA, factor analysis and correlations) rather
than a confirmatory one such as structural equation modelling.
Experiment 1
Method
Participants. Twenty-eight adults aged 39–68 years, M �
50.3 years, 18 females and 10 males, participated in the study.
The
large spread of ages was deliberately chosen with the
expectation
that this would yield a range of performance levels, similar to
what
one might expect when testing clinical samples. Participants
were
volunteers from the community who received $12-per-hr
remuner-
ation for participation. The participants spoke English fluently
and
had received 16.7 years of education on average. All
participants
had normal or corrected-to-normal vision and hearing and stated
that they were in good health.
Tasks and measures: The Breakfast Task. The Breakfast
Task was implemented on a computer using a 34 cm by 27 cm
touch-screen monitor. Participants were required to prepare a
virtual breakfast consisting of five foods and set a table while
the
foods were cooking. As depicted in Figure 1, each food was
shown
on the screen along with its required cooking time, a START
and
a STOP button, and a thermometer-like timer indicating cooking
progress. Participants pressed the buttons to start or stop
cooking
the corresponding food. Each timer was initially set to the
required
cooking time for its corresponding food and started to move
down
in real time once cooking started. After the correct cooking
time,
the timer reached zero with no further indication of the amount
of
overcooking. The program recorded the time that the START
and
STOP buttons were pressed so that the duration of undercooking
or
overcooking could be calculated. At the same time, participants
set
a table by placing forks, knives, spoons and plates in the correct
arrangement in four place settings (see Figure 1). Participants
were
told that their primary goal was to cook the foods for the correct
duration (i.e., to avoid undercooking or overcooking the foods)
and
to have all the foods ready at the same time, and their secondary
goal was to set as many places as they could.
The task began with detailed instructions and a practice session
to ensure that participants understood the task. Participants then
completed the three conditions described in Craik and Bialystok
(2006) in a fixed order. In the one-screen condition (performed
first), all the foods and the table were on the same screen, as
shown
in Figure 1. In the two-screen condition (performed second), the
table appeared on one screen and the five foods and their time
bars
appeared on a different screen, requiring switching between the
two screens. In the six-screen condition (performed last), each
of the
five foods occupied a separate screen, in addition to the table
screen.
In the present study, the one-screen and two-screen conditions
were
regarded as practice trials for the six-screen condition, which
requires
the greatest amounts of planning, monitoring, and task-
switching.
Performance on this last condition is described in the Results
section.
The program recorded the timing of all the responses as the
participants completed the task. The timing information was
used
to calculate the following measures. The first variable,
discrepancy
cooking time was the absolute value of the difference in time
between the actual and required cooking times (i.e., amount of
undercooking or overcooking) averaged across the five foods,
and
may therefore reflect the effective management of switching be-
tween the primary and secondary tasks. Range of stop times was
the difference in seconds between stopping the first and the last
food. A value close to zero indicated the foods finished cooking
at
approximately the same time, thereby reflecting optimal perfor-
mance on the primary task goal. Deviation of start times was the
average deviation between the ideal and actual start times for
Foods 2 to 5. In order for the foods to be done cooking around
the
same time, the ideal time to start each food depended on when
previous foods were started. Therefore, “ideal start times” were
cal-
culated for each food, adjusted according to the previous start
times
(for a more detailed description of this calculation, see Craik &
Bialystok, 2006). Number of food checks was the number of
times the
participant switched to the food screen to check the cooking
progress
for the two- and six-screen conditions. Finally, number of table
settings, calculated as the number of settings completed,
captured
performance on the secondary task (setting the table).
Results
In this study all participants remembered to start and stop all
foods, but the task is demanding with the result that participants
often temporarily neglected one or more foods while
concentrating
on other foods or setting the table. This feature of the task
resulted
in many cases in which participants might have four
discrepancy
scores of a few seconds but one poorly monitored food with a
discrepancy of 60 s or more. To compensate for such anomalies
we
took medians as the scored measure for discrepancy cooking
times
and deviation of start times, and for the same reason took the
median of all 10 between-food comparisons of stop times (i.e.,
the
median of differences between Foods 1–2, 1–3, 1–4 . . . 4–5) as
the scored measure for range of stop times. Even after these
adjustments, the distributions of discrepancies, deviations and
ranges were heavily skewed, so the logarithms of these values
were used in further analyses. Means for the raw scores of the
five
scored variables in the six-screen condition are shown in Table
1A,
254 ROSE, LUO, BIALYSTOK, HERING, LAU, AND CRAIK
and Pearson correlations among the variables are shown in
Table
1B.
Principal component analyses (PCA). To examine the struc-
ture of the variance in breakfast performance we conducted a
PCA
with oblique rotation on the measures. To determine the number
of
components retained in the model, we used a combination of
two
commonly used criteria based on eigenvalues and a scree test.
For all
the reported component structures below, all eigenvalues for re-
tained components were greater than 1.2, eigenvalues for
dropped
components were less than 0.9, and the smallest break between
eigenvalues for retained components and dropped components
was
0.44.
The PCA revealed a solution with two components accounting
for 62% of the variance (Table 2A). The first component
received
high loadings from number of table settings, range of stop times
and deviation from ideal start times. The second component re-
ceived high loadings from number of food checks and
discrepancy
from stop times. The correlation between the components was
0.15, suggesting the rotation was successful in capturing unique
variance between the two components. We interpret the first set
of
variables as reflecting efficient planning and task management
to
achieve the primary goal of the task (cook the foods so that they
can be served together) and efficient switching between primary
and secondary goals (cooking and setting the table). That is,
good
planning and task management were associated with a large
num-
ber of table settings, a small range of stop times, and small
deviations from ideal start times. We interpret the second set of
variables as reflecting the ability to monitor cooking progress
and
complete the task effectively. In this case good performance
was
associated with a large number of food checks and a small dis-
crepancy between specified and actual cooking times. There is
also
a sense in which the first component reflects “global” variables
associated with good planning in advance of performing the task
(many table settings and small deviations from ideal start times
resulting in a small range of stop times) whereas the second
component reflects more “local” variables associated with many
food checks resulting in small discrepancies between actual and
ideal stop times for cooking (see also Craik & Bialystok, 2006).
Before discussing these results further, we report a second
experiment whose function was to cross-validate the structure
of
breakfast performance on an independent sample and to examine
the relations between the breakfast measures and measures of
executive functions and prospective memory.
Experiment 2
Method
Participants. Fifty-nine healthy adults aged 60–79 years,
M � 67.4 years, 38 females and 21 males, participated in the
study. Participants were screened for dementia using the
telephone
interview of cognitive status (TICS; Brandt, Spencer, &
Folstein,
1988). This instrument has a maximum score of 41, and a cutoff
for dementia at 25. We chose a cutoff for participation of 31
and
above, based on a prior clinical study by Desmond, Tatemichi,
and
Hanzawa (1994) whose group of 36 control participants (mean
age � 71.8 years) had a mean TICS score of 33.4 (SD � 4.2). In
the present case, mean TICS score was 35.8 (SD � 2.1). Partici-
pants were fluent English speakers who obtained an average
score
of 17.3 out of 20 correct on an abbreviated Shipley vocabulary
test,
and reported an average of 15.4 years of education. All
participants
Table 1
Means (SDs) of Measures From the Breakfast Task and
Correlations Among These Measures (Experiment 1)
1A. Means
Table settings Food checks Discrepancy (s) Range (s) Deviation
(s)
25.9 (7.8) 13.2 (6.5) 11 (7.4) 11.5 (8.3) 12.8 (15.0)
1B. Correlations (N � 28)
Table settings Food checks Discrepancy Range Deviation
Table settings 1.00 �.03 0.03 �0.18 �0.38
Food checks 1.00 �0.15 0.29 �0.09
Discrepancy 1.00 0.07 0.21
Range 1.00 0.48�
Deviation 1.00
Note. 1A. Values for Discrepancy, Range, and Deviation are
based on medians but values reported in this table are the mean
of those median values. 1B.
Values for Discrepancy, Range, and Deviations used in
correlations were log medians (see text).
� Correlation significant at p � .05.
Table 2
Rotated Component Structure and Component Loading on the
Breakfast Task Measures From Experiments 1 and 2
A. Expt 1 B. Expt 2.1 C. Expt 2.2
Components Factors Factors
1 2 1 2 1 2
Table settings .67 �.24 .38 �.09 .37 �.03
Food checks �.40 .74 .04 .50 .24 .59
Discrepancy �.17 �.71 .37 �.67 .18 �.59
Range �.76 .02 �.99 .16 �.92 .07
Deviation �.76 �.42 �.62 �.43 �.64 �.35
Note. Values in bold type for Experiment (Expt) 1 are
significant at p �
.05. Values used for Discrepancy, Range, and Deviations were
log medians
(see text). Discrepancy � discrepancy between specified and
actual stop
times; Deviation � deviation between ideal and actual start
times; Expt
2.1 � data collected on the first occasion; Expt 2.2 � data
collected on the
second occasion.
255COGNITIVE PROCESSES IN THE BREAKFAST TASK
had normal or corrected-to-normal vision and hearing. Addition-
ally, 55 of the same participants returned to the lab between 4
and
6 weeks later to perform the Breakfast Task a second time. The
study was part of a cognitive training study; 24 of the returning
participants had received 12 hr of practice on a computerized
version of the Virtual Week task (Rendell & Craik, 2000) de-
scribed later; 13 had received instruction in aspects of music,
and
18 were controls who received no further training. The resulting
data from the second visit provided a further opportunity to
assess
the structure of the Breakfast Task and to measure test–retest
reliabilities of its component measures.
Tasks and measures. On the first occasion, participants com-
pleted the following tasks in one 2-hr session. On the second
occasion, participants again performed the Breakfast Task and
the
Virtual Week task. Prior to each task, detailed instructions and
practice or sample trials were given to the participants to ensure
proper understanding.
The Breakfast Task. Administration of the Breakfast Task
was the same as in Experiment 1 except that participants did not
perform the two-screen condition. We wanted to see if the same
factor structure could be achieved with a shorter version of the
task. Additionally, all participants used the computer mouse
rather
than a touch screen in this study.
Basic cognitive abilities and executive functions. The follow-
ing tests assessed a number of basic cognitive abilities and
exec-
utive functions including verbal knowledge (Shipley
vocabulary),
processing speed (digit-symbol substitution), working memory
(n-back, Corsi block test), inhibition (Stroop test), and
reasoning
(Raven’s). Data were missing for four participants for the Corsi
test (computer error), two participants for the Virtual Week task
(computer error), and five participants did not perform the n-
back
task due to time limitations. Details for all tests are given
below.
Shipley vocabulary. The vocabulary subtest of the Shipley
Institute of Living Scale (Zachary, 1986) was used to assess
English vocabulary. To minimise testing time, rather than test
all
40 items we tested 20 items; half of the participants received
the
even-numbered items, and the remainder received the odd-
numbered items. For each item, participants were asked to
choose
the one word out of four which is the most similar in meaning to
the prompting word printed in capital letters. The task was
scored
based on the total number of items completed correctly.
Raven’s matrices. The 29-item multiple-choice test examines
nonverbal reasoning abilities by requiring participants to
correctly
choose an answer to complete a pattern (Raven, Court, &
Raven,
1996). Participants completed two practice questions. They then
tried to complete as many items as they could within a 10-min
time
limit. The total number of items correct and the number of items
attempted were recorded.
Digit-symbol substitution task. The digit-symbol task is a
speeded task measuring information processing speed
(Wechsler,
1997). A legend of nine single digits with corresponding
symbols
is at the top of the page. Seven rows of digits with empty
squares
underneath them are under the legend. After completing seven
practice items, participants were required to correctly fill in
sym-
bols under their corresponding numbers as quickly as they could
for 2 min. The total number of items correct was recorded.
Stroop task (Stroop, 1935). Participants were presented with
three sheets. The first sheet contained names of colours printed
in
black ink, and participants were asked to read the words. The
second sheet contained colour patches and participants were
asked
to name the ink colours. The third sheet was the interference
condition, in which colour names were printed in an incongruent
ink colour (e.g., the word red printed in green ink). The partici-
pants were required to name the ink colour and ignore the
words.
Participants were instructed to complete each sheet as fast as
they
could without making any mistakes. The time taken to complete
each sheet was measured in seconds. The Stroop Effect was
measured by interference cost, expressed as the time difference
between the interference condition and the colour-patch naming
condition. In this case, good performance is signalled by small
cost
values.
Working memory. Spatial working memory was assessed by a
computerized version of the Corsi block task (Milner, 1971).
The
task consisted of a forward condition and a backward condition.
In
the forward condition, a 6 � 6 grid of grey squares was
displayed
on a computer monitor. A sequence of blue squares was then
presented serially; that is, one of the 36 squares turned blue
briefly,
followed by one or more further blue squares depending on se-
quence length. Each blue square appeared for 1,000 ms,
followed
by a blank grid interstimulus interval of 500 ms. Sequence
length
ranged from two to eight squares. A brief recall prompt that
consisted of the grid with a red border around it appeared for
500
ms to indicate the end of the sequence presentation. Participants
were then required to reproduce the sequences by clicking on
the
squares with a computer mouse in the correct order of
presentation.
Two trials were presented at each span length between two and
eight, for a total of 14 trials. The backward condition was
similar
to the forward condition in that the same presentation design
was
used but participants were prompted to select the squares that
turned blue in the reverse order in which they were presented.
Participants completed a practice trial of three squares before
moving on to the experimental trials. Fourteen trials were pre-
sented, again ranging from two to eight squares. A total correct
score was obtained by summing the number of squares selected
correctly in both conditions.
Verbal working memory was assessed by the n-back task. The
n-back task required participants to constantly update
information
in working memory. The stimuli consisted of a sequence of
letters
presented at a rate of one per second. On presentation of each
letter, participants were to press a key labelled yes or no to
indicate
whether the letter matched the letter presented two letters back
in
the sequence. The n-back-block consisted of 50 trials with 17
targets and 33 nontargets. The dependent variable was the
propor-
tion of hits minus false alarms.
Prospective memory. The test of PM was a version of the
Virtual Week task (Rendell & Craik, 2000), which is a board
game
developed to assess PM in a simulated everyday setting. In the
current study, participants performed the computerized version
of
Virtual Week (for details, see Rendell & Henry, 2009; Rose,
Rendell, McDaniel, Aberle, & Kliegel, 2010). Each circuit of
the
game represents one day from 7 a.m. to 10 p.m., and
participants
move around the board by clicking on a computer icon that
simulates the roll of a die. At the beginning of each day, partici-
pants click on the “Start Card” button, which shows them cards
that indicate the tasks they are required to perform that day.
They
have to remember to carry out activities either at specified
“times”
(as they pass the relevant square on the board) or in response to
specified “events” that are given on “Event Cards” that come up
in
256 ROSE, LUO, BIALYSTOK, HERING, LAU, AND CRAIK
the course of the circuit. The PM tasks were either “regular”
(the
same tasks on all circuits) or “irregular” (different tasks on each
circuit). The same four regular tasks were performed on every
circuit of the board and were given in instructions before the
game
started; two were in response to events (taking antibiotics at
breakfast and dinner) and two were in response to squares indi-
cating virtual times on the board (taking asthma medication at
11
a.m. and 9 p.m.). Irregular tasks also included two tasks in re-
sponse to events and two other tasks in response to the virtual
time
presented in the centre of the screen. These tasks are different
for
each circuit, however, and were given by either the Start Card at
the beginning of each circuit or Event Cards presented during
the
game. As participants moved around the board, they were
required
to click on the Event Cards button as they passed “event
squares,”
make choices about daily activities (e.g., a choice of foods for
lunch), and remember to carry out the required activities. All
activities were those that people normally do in a typical day.
Participants carried out the specified actions by clicking on the
“Perform Task” button and selecting the appropriate task from a
list of PM tasks and distractors. The third type of PM task was a
time check task in which the participant had to click on the
Perform Task button and select the “lung capacity test” task
when
2 min and also 4 min had elapsed in real time from the start of
the
current circuit. This “real-life” time was displayed by a clock
that
began running at the click of the Start button in the centre of
the
board game and could be checked at any time. Therefore, 10 PM
responses were assessed on each day (one complete circuit
around
the board). Participants completed 3 days of the game following
a
“practice day.” The 3 days thus included six regular event-
related,
six regular time-related, six irregular event-related, six irregular
time-related, and six time-check responses. The dependent vari-
ables were the rate of accuracy for each type of response.
Results
Effects of training on Breakfast Task performance. The
purpose of the training manipulation was to assess whether pro-
spective memory was amenable to training, and this aspect of
the
study is discussed elsewhere. The results of the Breakfast Task,
the
virtual week task, and the various other cognitive tasks on the
first
and second occasions of testing are given below. First, however,
we wished to determine whether the different training
procedures
(Virtual Week, Musical Practice, and Controls) had a
differential
effect on Breakfast Task performance. Accordingly we
performed
five separate one-way ANOVAs on the five Breakfast Task mea-
sures—number of table settings, number of food checks, log
median discrepancy, log median range, and log median devia-
tion—with the three training groups as a between-subjects vari-
able. These analyses yielded no significant effect of training
group
in any case, all Fs � 1.28, ps � 0.28. Since no measure was
affected differentially by the different training procedures we
treated all participants on the second occasion as belonging to a
single group.
Means, correlations and exploratory factor analyses.
Tables 3A and 4A show the means of the five Breakfast Task
measures on the first and second testing occasion, respectively.
As
described earlier, medians for each participant were taken as the
measure for discrepancy cooking times, range of stop times, and
deviation from ideal start times; the values shown in the tables
are
the means of these medians. The scores in Table 4A (second
occasion) show somewhat better performance on all measures
than
the scores in Table 3A (first occasion); that is, more tables were
set
and the values of discrepancy, range, and deviation were
smaller,
in line with the idea that participants were more practiced on
the
second occasion. The values in Tables 3A and 4A show poorer
performance than those from Experiment 1, however (see Table
1),
presumably reflecting the fact that the participants in
Experiment
1 were younger (50.3 years compared with 67.4 years) and had
received more years of education (16.7 years compared with
15.4
years) than the participants in Experiment 2. A further
possibility
is that use of the touch-screen in Experiment 1, as opposed to
the
computer mouse in Experiment 2, may have benefited
participants
in the first study. The correlations among Breakfast Task
measures
are shown in Tables 3B and 4B.
To examine the structure within the breakfast measures and to
validate the structure obtained in Experiment 1, we performed
exploratory factor analyses specified by two factors on the data
from each testing occasion. Exploratory analyses were preferred
over confirmatory analyses given that the structure revealed in
the
Table 3
Means (SDs) of Measures From the Breakfast Task and
Correlations Among the Means (Experiment 2, First Occasion)
3A. Means (N � 59)
Table settings Food checks Discrepancy (s) Range (s) Deviation
(s)
15.0 (2.3) 18.4 (4.7) 25.8 (25.5) 23.2 (21.9) 26.2 (22.0)
3B. Correlations (N � 59)
Table settings Food checks Discrepancy Range Deviation
Table settings 1.00 �0.05 0.18 �0.39�� �0.20
Food checks 1.00 �0.33� 0.04 �0.16
Discrepancy 1.00 �0.47�� 0.05
Range 1.00 0.58��
Deviation 1.00
Note. 3A. Values for Discrepancy, Range, and Deviation are
medians. 3B. Values for Discrepancy, Range, and Deviations
used in correlations were log
medians (see text).
� Correlation significant at p � .05. �� Correlation significant
at p � .01.
257COGNITIVE PROCESSES IN THE BREAKFAST TASK
data from Experiment 1 was not predicted and was obtained
from
a small sample. Confirmation of the structure was therefore
sought
by convergence of the same pattern over replications of the
task.
The two-factor solution using maximum likelihood estimation
on
the data from the first occasion revealed a structure similar to
that
shown in Experiment 1 (see Table 2), with the first factor
explain-
ing 33% of the variance and the second factor explaining 19%
of
the variance (total � 52%). A goodness-of-fit-test indicated that
the observed solution was not different from a two-factor
model,
�2(1) � 0.15, p � .70. In contrast, fitting the data with a one-
factor model resulted in a significant difference between the ob-
served and imposed structure in the data, �2(5) � 17.22, p �
.005,
and the chi-square difference test indicated that the one-factor
model was a substantially poorer fit to the data, ��2(1) �
17.07,
p � .001. The first factor again received high loadings from a
small range of stop times and small deviations from ideal start
times. Two differences from Experiment 1 are, first, that the
number of food checks no longer loaded on the first factor and,
second, that the loading from number of table settings was sub-
stantially reduced. The second factor again received high
loadings
from a large number of food checks and small discrepancies
between specified and actual stop times. Thus, cross-validation
of
the structure of the breakfast measures on an independent
sample
was achieved with the first set of variables reflecting effective
planning and cooking performance (small deviations from ideal
start times and a narrow range of stop times), and the second set
of
variables reflecting the ability to efficiently carry out the plan
and
monitor cooking progress (a large number of food checks and
small discrepancies between specified and actual cooking times
for
each food).
A further exploratory factor analysis was carried out on the data
from the second testing occasion. Again, the two-factor model
fit
the data well, with the first factor accounting for 30% of the
variance and the second factor accounting for 16% of the
variance.
The goodness-of-fit test indicated that the observations were
well
fit by a two-factor model, �2(1) � 2.23, p � .14, which fitted
the
data better than a one-factor model, �2(5) � 13.40, p � .02,
with
a chi-square difference test again indicating that the one-factor
model was a significantly poorer fit, ��2(1) � 11.18, p � .001.
This analysis (see Table 2C) yielded a very similar pattern to
the
factor analysis from the first occasion; that is, the first factor
received high loadings from a small range of stop times and
small
deviations from ideal start times. The second factor received
high
loadings from a large number of food checks and small discrep-
ancies between specified and actual cooking times. The other
regularities shown across the three analyses shown in Table 2
include a tendency for a large number of table settings to relate
to
the first factor and small deviations from ideal start times to
relate
to the second factor. As discussed below, we interpret the first
factor as reflecting global aspects of planning, and the second
factor as reflecting local aspects of monitoring and task
execution.
In general, there are striking similarities in the components and
factors from all three occasions of testing (Tables 2A, 2B, 2C).
Test–retest reliability measures. Pearson product–moment
correlations were run between participants’ performance on
Break-
fast Task measures on the two occasions of testing, and these
values are shown in Table 5. Considering performance on the
six-screen version only, 39 participants completed all aspects of
the task on both occasions. Other participants completed
cooking
some but not all foods; these participants were dropped from
this
analysis. Test–retest correlations were significant for deviation
from ideal start times (0.48), number of table settings (0.76),
and
Table 4
Means (SDs) of Measures From the Breakfast Task and
Correlations Among These Measures (Experiment 2, Second
Occasion)
4A. Means (N � 51)
Table settings Food checks Discrepancy (s) Range (s) Deviation
(s)
16.0 (6.1) 18.4 (5.0) 14.9 (11.9) 20.7 (20.0) 20.4 (16.4)
4B. Correlations (N � 51)
Table settings Food checks Discrepancy Range Deviation
Table settings 1.00 �0.05 0.00 �0.34� �0.26
Food checks 1.00 �0.30� �0.19 �0.38��
Discrepancy 1.00 �0.22 0.12
Range 1.00 0.58��
Deviation 1.00
Note. 4A. Values for Discrepancy, Range, and Deviation are
medians. 4B. Values for Discrepancy, Range, and Deviations
used in correlations were log
medians (see text).
� Correlation significant at p � .05. �� Correlation significant
at p � .01.
Table 5
Test–Retest Reliability Measures
Breakfast measure p
Six-Screen version (N � 39)
Discrepancy of cooking times .22 .18
Range of stop times .24 .17
Deviation from ideal start time .48 .004
Number of table settings .76 �.001
Number of food checks .34 .03
Combined one-screen and six-screen versions (N � 27)
Discrepancy of cooking times .20 .34
Range of stop times .52 .01
Deviation from ideal start time .55 .004
Number of table settings .75 �.001
Number of food checks .34 .03
Note. Correlations significant at p � .05 are printed in bold
type.
258 ROSE, LUO, BIALYSTOK, HERING, LAU, AND CRAIK
number of food checks (0.34), although not for discrepancy and
range measures. Table 5 also shows the values calculated from
combined performance on the one-screen and six-screen
versions;
27 participants completed all aspects of both tests. The
combined
scores yielded a similar pattern, although now the range
measure
also gave a significant correlation (0.52). In one final analysis
we
correlated latent factor scores from the exploratory factor
analyses
between the first and second occasions. In the case of the first
latent factor, the value of r (n � 45) was
0.33, p � .03; for the
second latent factor, r(45) �
0.24, p � .05. The first factor thus
seems relatively stable, the second factor less so. One
possibility is
that the variance associated with the second component may
have
shifted between the first and second testing occasions as a result
of
the heterogeneity of experience between test and retest. In
general,
test–retest reliabilities for the Breakfast Task were significantly
positive if rather modest.
Breakfast performance in relation to EF and PM. We then
examined the relations between Breakfast Task measures
collected
on the first test occasion, and the EF and PM measures collected
on all 59 participants on the first occasion. We examined these
correlations using Pearson’s method among all variables (see
Table 6) and, as was done for the breakfast measures, we first
conducted separate PCA analyses of the EF and PM measures
and
then examined correlations between the resulting components
and
the Breakfast Task measures.
The PCA conducted on the five tasks tapping higher cognitive
functions including processing speed (digit-symbol
substitution),
working memory (n-back, Corsi block test), inhibition (Stroop
test), and reasoning (Raven’s) yielded one general component
that
accounted for 50% of the total variance. The component
loadings
of the five measures are presented in Table 7. Although these
tasks
measure a diverse set of abilities, we interpreted the variance in
common among the measures as capturing a general “executive
processing” factor, which we then used in subsequent analyses.
Inspection of the correlations among the different measures of
PM obtained from the Virtual Week task (regular event-related,
irregular event-related, regular time-related, irregular time-
related,
and time check tasks) revealed that the Virtual Week measures
were generally intercorrelated (see Table 6); they were then
sub-
mitted to a PCA with oblique rotation. This analysis yielded a
one-component structure that accounted for 55% of the
variance.
The component loadings are also shown in Table 7. Thus,
although
the different aspects of the VW task ostensibly measure
different
components of PM, we interpreted the common variance as re-
flecting a general PM ability.
We then correlated the EF components and the PM components
with the Breakfast measures taken on the first testing occasion
only (see Table 8). The EF component showed a significant
positive correlation with the number of table settings and
signifi-
cant negative correlations with range of stop times and
deviations
from ideal start times on the Breakfast Task. That is,
participants
with superior performance in EF tended to have more table set-
tings, smaller ranges and a smaller deviation from ideal start
times;
all variables that loaded on the first breakfast component. Taken
Table 6
Correlations Among All Variables in Experiment 2 (N � 46–59)
1 2 3 4 5 6 7 8 9 10 11 12 13 14 15
1. DigSymb 1.00 �0.07 0.39�� 0.46�� 0.43�� �0.38��
�0.41�� �0.08 0.16 0.33� 0.30� 0.30� 0.24 0.23 �0.04
2. Stroop 1.00 �0.19 �0.19 �0.09 0.23 0.12 �0.21 0.15 �0.23
�0.11 �0.19 �0.07 0.00 0.13
3. Raven 1.00 0.56�� 0.44�� �0.34� �0.26� �0.13 0.10
0.50�� 0.31� 0.39�� 0.32� 0.21 0.18
4. Corsi 1.00 0.45�� �0.41�� �0.43�� 0.01 0.14 0.47��
0.36�� 0.26 0.26 0.27� �0.04
5. n-back 1.00 �0.26 �0.19 �0.22 0.27� 0.23 0.07 0.09 0.27
0.16 0.07
6. Bf range 1.00 0.54�� �0.48�� 0.04 �0.39�� �0.26
�0.42�� 0.00 �0.17 �0.09
7. Bf dev 1.00 0.06 �0.24 �0.18 �0.26 �0.41�� �0.25 �0.19
�0.21
8. Bf disc 1.00 �0.33� 0.18 �0.09 �0.07 �0.25 �0.18 �0.22
9. Bf Check 1.00 �0.05 �0.02 0.09 0.13 0.14 0.03
10. Bf Tabl 1.00 0.33� 0.31� 0.19 0.06 �0.08
11. VWRE 1.00 0.59�� 0.55�� 0.60�� 0.32�
12. VWRT 1.00 0.44�� 0.39�� 0.26�
13. VWTC 1.00 0.49�� 0.21
14. VWIE 1.00 0.43��
15. VWIT 1.00
Note. DigSymb � Digit-symbol test; Bf � breakfast; dev �
deviation; disc � discrepancy; Tabl � numbers of tables set;
VW � virtual week; RE �
regular event; RT � regular time; TC � time check; IE �
irregular event; IT � irregular time. Stroop, Bf range, Bf
deviation, and Bf discrepancy were
log transformed due to nonnormal distributions. Significant
correlations are bolded.
� p � .05. �� p � .01.
Table 7
Component Loadings for the EF and PM Measures
Component Loading
Measure EF PM
Digit Symbol .72 —
Stroop Effect �.30 —
N-back .73 —
Corsi blocks .82 —
Ravens .79 —
VW regular event — .85
VW irregular event — .80
VW regular time — .73
VW irregular time — .55
VW Time-check — .74
Note. VW � virtual week. Separate PCAs were done on the
executive
functions (EF) and prospective memory (PM) measures.
259COGNITIVE PROCESSES IN THE BREAKFAST TASK
together this result suggests that superior EF is associated with
better global planning and more efficient management of
switch-
ing between the two main goals in the Breakfast Task, namely,
setting the table and cooking the foods.
The PM component showed only one significant correlation—a
negative relation to the deviation from ideal start time;
participants
who performed more accurately on the PM tasks were also more
likely to start each food at an ideal time. Thus, the PM variables
were also related to some degree to the first breakfast
component
shown in Table 2B. Table 8 also shows that the discrepancy in
cooking times and the number of food checks did not correlate
with either EF or PM. Inspection of the correlations in Table 6
reveals that discrepancy in cooking times correlated with
number
of food checks such that participants who checked the foods
more
often had a smaller discrepancy in cooking times. We have pre-
viously suggested that this combination signals close
monitoring
of cooking times and good local planning.
We then examined the correlations between the breakfast com-
ponents and the common EF and PM composite factors (see
Table
9). As suggested by the correlations on Table 8, the first
Breakfast
Task composite (BT1) correlated significantly with the EF com-
posite but the second Breakfast Task factor (BT2) did not
correlate
with either the EF or the PM factor, and was also independent
of
BT1 (r � .07). Additionally, the EF and PM components were
positively related, r � .37, p � .01. We can thus say that BT1
primarily reflects executive control, reasoning and working
mem-
ory functions (Digit-symbol, Stroop, Raven, Corsi, n-back).
Given
this set of relations and the make-up of BT1 (see Table 2) we
interpret the BT1 factor as an indicator of global planning.
Table
2 shows that BT2 relates strongly and consistently to number of
food checks and to the discrepancy between ideal and actual
cooking time—more checks result in smaller discrepancies. We
interpret this second factor as an indicator of local planning and
task completion that was, interestingly, unrelated to variation in
executive functions and higher-level planning in this sample.
Discussion
In their initial description and analysis of the Breakfast Task,
Craik and Bialystok (2006) concluded that the task provided
measures of global and local planning abilities, and that in turn
these abilities were related to individual differences in task
switch-
ing, working memory, and prospective memory. In general, the
present study confirmed these conclusions with fuller
supporting
data, but with the major exception that little evidence was found
for a prospective memory component in the Breakfast Task.
This
surprising finding is discussed later, but we first discuss the two
components revealed consistently by the PCA and factor
analyses
shown in Table 2.
These analyses revealed two separable components in breakfast
measures, each supported by a small number of underlying cog-
nitive processes. In both experiments, the first component
received
strong loadings from the range of stop times and deviation from
ideal start times, and a smaller loading from number of table
settings, reflecting participants’ efficiency to formulate a plan
and
switch between the two overall goals (Table 2A, B, C).
Experiment
2 showed that this component was correlated with the EF
compo-
nent abstracted from the executive function measures (see Table
9). Specifically, the EF component correlated reliably with
range
of stop times, deviation from ideal start times and number of
table
settings accomplished (see Table 8). In contrast, the second
com-
ponent received strong loadings from a large number of food
checks and the discrepancy from target cooking times,
reflecting
the ability to monitor cooking progress and stop cooking each
food
at the appropriate time. This component was independent of the
first (see Table 9) and was also unrelated to both EF and PM
composite factors (see Table 9). The two measures involved in
this
second component (checks and discrepancy) were also uncorre-
lated with EF and PM composites (see Table 8). The second
component thus appeared consistently in our three replications,
but was also consistently unrelated both to other cooking mea-
sures and to general cognitive activities. We have interpreted
this measure as reflecting the efficiency of monitoring cooking
progress and of stopping individual foods appropriately, but
with less relation to the efficiency of overall planning. We also
concede, however, that the second component may reflect fac-
tors specific to performing the Breakfast Task. It remains to be
seen whether individuals who score highly on this factor also
show good local planning abilities on other tasks.
The separation of the two Breakfast Task components is gener-
ally consistent with the analyses by Burgess et al. (2000) and
Logie
et al. (2011), whose SEM analyses revealed a separation
between
planning, the extent to which an individual’s plan reflects the
overall goal, and intent, the execution of the plan. Similarly,
our
breakfast measures reflected two separable components demon-
strating planning and task execution, respectively. A critical
fea-
ture of the Breakfast Task is the need to constantly consult
with,
and revise one’s plan during execution. For example, if a food
is
Table 9
Correlations Among Factor Scores (Ns for Each Correlation
in Brackets)
EF PM BT1 BT2
EF 1.00
PM 0.37 (49) 1.00
BT1 0.44 (42) 0.24 (49) 1.00
BT2 0.16 (42) 0.19 (49) 0.07 (51) 1.00
Note. Correlations significant at p � .01 are printed in bold. EF
� Factor
score for executive functions; PM � Factor score for
prospective memory;
BT1 � Breakfast Task, first factor; BT2 � Breakfast Task,
second factor.
Table 8
Correlations Between the EF and PM Components and the
Breakfast Measures
Component
EF PM
Breakfast measure
Number of table settings .55�� .23
Number of food checks .20 .10
Discrepancy cooking time �.18 �.21
Range of stop times �.45�� �.27
Deviation from ideal start time �.40�� �.36��
Note. EM � executive functions; PM � prospective memory.
� p � .05. �� p � .01.
260 ROSE, LUO, BIALYSTOK, HERING, LAU, AND CRAIK
started too early or too late, the participant must revise the
cooking
of subsequent foods accordingly to ensure that all foods will
finish
close together. Therefore, efficient performance of the
Breakfast
Task places a heavy load on maintaining and updating
information
in WM, particularly if the plan is weak or goes awry. Logie et
al.
(2011) also found that a measure of spatial WM predicted
perfor-
mance in a complex multitasking environment, in their case via
a
general memory factor. Logie and colleagues used deviation
from
ideal starting times from the Breakfast Task as a potential
predictor
of dual-task performance in their study, but found no significant
relations between deviation scores and other variables,
including
measures of WM. For unknown reasons this result differs from
the
present findings, where deviation correlated significantly with
Digit-symbol, Raven’s and the Corsi WM task (see Table 6). In
addition to a participant’s cognitive ability, various features of
the
particular task conditions will influence the need for more con-
trolled, strategic processing as opposed to a reliance on more
spontaneous, automatic processing (McDaniel & Einstein, 2000;
Rose et al., 2010).
The PCA used in Experiment 1 and the factor analyses used in
Experiment 2 yielded two components that were associated with
distinct underlying individual differences. As discussed previ-
ously, the first component is related to strong WM and EF
abilities.
The second component, with its pattern of many food checks
and
resultant small discrepancies between target and actual cooking
times, suggests an ability that focuses on specific, local aspects
of
the task, with less attention paid to the overall pattern of perfor-
mance. Parkinson’s patients have a tendency to focus on one
aspect of a task while neglecting other aspects (Gauntlett-
Gilbert,
Roberts, & Brown, 1999), and in a previous study we found that
patients with mild Parkinson’s disease showed significantly
smaller discrepancies in cooking times on the Breakfast Task
than
age-matched controls, at the expense of setting fewer tables
(Bialystok et al., 2008). Thus, the second component may
reflect
an ability that is effective for single focused tasks but is less
appropriate when tasks require attention to multiple
components.
One surprising finding in the present study was the absence of
a relationship between Breakfast Task components and measures
of prospective memory. Successful completion of the six-screen
version of the Breakfast Task requires timely switching between
table-setting and cooking the various foods; for this reason it
seemed that efficient starting and stopping cooking operations
should make heavy demands on PM (Craik & Bialystok, 2006).
Several factors may have contributed to this unexpected result.
The
first is that PM is assessed by only one other task—Virtual
Week—and it is possible that the type of PM measured by
Virtual
Week (where required actions are mostly cued by times on the
board or by specific event cards) is different from the uncued
PM
operations required by the Breakfast Task. In this sense, the
Breakfast Task requires more “self-initiated activity” than does
Virtual Week, and such activities are often central to PM
(Craik,
1983). Further, Table 6 shows that of the 25 correlations
between
the five Virtual Week measures and the five Breakfast Task
measures, one was a zero correlation and 22/24 of the remainder
were positive in the sense that Virtual Week measures tended to
relate to a large number of food checks and tables set, and to
small
values of range, discrepancy and deviation. Additionally, the
over-
all PM component correlated positively (although not signifi-
cantly) with both BT components (see Table 9), so it is perhaps
fair
to conclude that the Breakfast Task does exhibit some aspects
of
prospective memory as measured by the Virtual Week task. An-
other possibility is that the Breakfast Task does not in fact
provide
a good method for assessing differences in PM. Recall that par-
ticipants must switch between starting and stopping foods on
the
one hand and table-setting on the other, at intervals ranging be-
tween 30 sec and 2 min at most. Additionally, the fact that food
checks may be carried out at any time further reduces the
intervals
between cooking operations and setting the table. So the
require-
ment to “switch soon” is presumably kept in mind rather con-
stantly as a person performs the Breakfast Task, and the need to
retrieve a PM intention from outside current awareness is quite
small. Overall then, we conclude that the Breakfast Task
provides
estimates of both global planning (BT1) and local monitoring
and
task execution (BT2), but may also tap aspects of prospective
memory.
What do these results tell us about the cognitive structure of
complex planning behaviour? Perhaps the clearest conclusion is
that planning is indeed not a unitary construct (Burgess et al.,
2000, 2005; Craik & Bialystok, 2006; Logie et al., 2011). Our
data
showed not only that planning performance on the Breakfast
Task
is supported by multiple cognitive processes, but also that it can
be
separated into two major components, each of which is
supported
by a different set of processes. Nonetheless, our data show some
promise for the identification of common patterns across
different
types of planning tasks. First, our breakfast measures showed a
structure with separable components reflecting overall planning
efficiency and subtask management. Such a distinction is in line
with the one between “plan” and “intentionality” suggested by
Burgess et al. (2000) and by Logie et al. (2011), and is also
consistent with the suggestion that optimal outcome depends on
both efficient planning and successful execution. This suggests
that future assessments of this nature should employ a
framework
that includes both planning efficiency (how well the plans are
generated and revised to reflect the overall goal) and task-
management (how effectively people handle multiple subtasks
and
achieve subgoals).
Second, many have proposed that WM plays an important role
in generating, accessing, and revising plans (e.g., Cohen, 1996;
Gilhooly, 2005; Owen, 1997). Our data, along with other behav-
ioural evidence (Gilhooly, Wynn, Phillips, Logie, & Della Sala,
2002; Logie, Trawley, & Law, 2011; Phillips, Wynn, Gilhooly,
Della Sala, & Logie, 1999), is confirmatory of a relationship
between planning efficiency and aspects of WM functioning,
de-
spite great variety in the methods of assessment. Different tasks
may correlate with different WM measures; for example, visual
tasks such as Tower tasks engage mainly visuospatial WM
(Gilhooly et al., 2002). Errand tasks have many complex rules
to
remember and a map to navigate, and so load heavily on both
verbal and visuospatial WM capacity (Logie et al., 2011). In our
case, the individual correlations shown in Table 6 reveal that
the relation between the EF composite measure and BT1 (table
setting, range and deviation) is largely due to correlations with
visuospatial WM (Corsi test) as well as with Digit Symbol and
Raven’s matrices. Although precise relationships remain to be
specified, our suggestion is that WM as a general function of
holding and manipulating information in mind, presumably
contributes to a wide range of planning and multitask manage-
ment activities.
261COGNITIVE PROCESSES IN THE BREAKFAST TASK
What are the implications of the present results for the use of
the
Breakfast Task as a means of assessing capabilities and deficits
in
planning and monitoring behaviour in everyday life? The Break-
fast Task has the advantage of simulating an everyday activity
that
participants readily understand; they also find the task engaging
and enjoyable to perform. One major contribution of the present
results is the demonstration of the task’s stable factor structure
(Table 2A, B, C); this point enables the Breakfast Task to assess
global planning and local monitoring separately. An initial indi-
cation of such an assessment application is given by a case
study
describing an individual who had moderately severe problems in
prospective memory, attributed to a deficit in strategic
monitoring
(West et al., 2007). In performing the Breakfast Task this
person
made fewer food checks and had larger discrepancies in cooking
times relative to a reference group, in line with the idea that she
has
a specific impairment in local monitoring. Her performance on
other Breakfast Task measures was normal. A recent study by
Tanguay, Davidson, Guerrero Nuñez, and Ferland (2014) tested
22
patients with acquired brain injury and 22 controls on the
Break-
fast Task, and found that the patients scored substantially lower
on
all measures. The authors also had patients cook a real meal,
with
the finding that patients’ own assessment of their cooking
ability
correlated significantly with overall performance on the
Breakfast
Task, although clinicians’ assessments of the patients’ real-meal
cooking skills did not correlate with the computer task. One
possibility here is that well-practiced skills, such as cooking a
meal, involve semiautomated routines that do not require on-
the-
spot planning and decision-making, and therefore do not tap the
more “fluid intelligence” aspects needed to perform a novel
com-
plex task. We have also shown that the Breakfast Task is
sensitive
to normal aging; older adults performed less efficiently on all
five
Breakfast Task measures compared to younger adults (Craik &
Bialystok, 2006). As mentioned previously, Parkinson’s patients
performed well on local monitoring but less well on overall
plan-
ning measures (Bialystok et al., 2008). Finally, we have shown
that
older bilingual participants are significantly superior to
monolin-
gual counterparts at switching appropriately between table-
setting
and cooking operations (Craik & Bialystok, 2006). In overview,
evidence for the relation between the Breakfast Task and real-
life
planning abilities is still scanty, and one difficulty in this
regard
may be that all tasks, both lab-based and in real life, require a
combination of abilities that is rather specific to each task.
How-
ever, we are hopeful that the Breakfast Task has the potential to
assess two components of planning, and to provide independent
measures of these components.
In summary, this article reported a study whose purpose was to
assess and interpret measures from the Breakfast Task, a labora-
tory task designed to provide measures of planning, working
memory, and task switching. The task involves rules and serial
steps that reflect those required in real life meal preparation,
and is
therefore ecologically valid. The main outcome measures are
RTs
and proportions that may be applied to a wide range of
populations
and may be sensitive to various neuropsychological
impairments.
The present study clarifies the links between Breakfast Task
mea-
sures on the one hand and higher cognitive processes such as
WM,
processing speed, reasoning, monitoring, and task switching on
the
other. The results thus provide guidelines for assessments of
these
processes in ecologically valid settings, and the task itself
provides
a means for an enjoyable and engaging assessment of everyday
planning behaviour.
Résumé
La Breakfast Task (Craik & Bialystok, 2006) est une tâche
infor-
matisée qui simule la planification et la surveillance des
préparatifs
d’un petit-déjeuner, une tâche quotidienne importante pour
l’autonomie fonctionnelle. Dans l’Expérience 1, on a demandé à
28 adultes de réaliser la Breakfast Task, et les mesures obtenues
ont été soumises à une analyse en composantes principales en
vue
de déterminer la structure des processus cognitifs impliqués.
L’analyse a révélé une structure à deux composantes, qui com-
prendrait la planification globale et des capacités de contrôle
local.
Dans l’Expérience 2, on a procédé à une validation croisée de la
structure du rendement à la Breakfast Task au moyen d’un
nouvel
échantillon de 59 adultes plus vieux, en santé, à qui on a aussi
demandé de réaliser des tests évaluant la mémoire de travail, la
vitesse de traitement, l’inhibition, le raisonnement et la
mémoire
prospective. L’analyse factorielle a révélé que le volet de
planifi-
cation globale dans le cadre de la Breakfast Task était fortement
corrélé avec des différences individuelles dans les fonctions
exécu-
tives, mais que le volet de contrôle local était indépendant de
ces
fonctions. La Breakfast Task constitue un outil de d’évaluation
rapide, agréable et réaliste de la planification complexe au
quoti-
dien et de la surveillance ainsi que de leurs processus sous-
jacents,
tels que la mémoire de travail et les fonctions exécutives.
Mots-clés : planification, contrôle, mémoire de travail, mémoire
prospective, processus exécutifs.
References
Bialystok, E., Craik, F. I. M., & Stefurak, T. (2008). Planning
and task
management in Parkinson’s disease: Differential emphasis in
dual-task
performance. Journal of the International Neuropsychological
Society,
14, 257–265. http://dx.doi.org/10.1017/S1355617708080296
Brandt, J., Spencer, M., & Folstein, M. (1988). The telephone
interview for
cognitive status. Neuropsychiatry, Neuropsychology, and
Behavioral
Neurology, 1, 111–117.
Burgess, P. W., Simons, J. S., Coates, L. M.-A., & Channon, S.
(2005). The
search for specific planning processes. In R. Morris & G. Ward
(Eds.),
The cognitive psychology of planning (pp. 199–227). New
York, NY:
Psychology Press.
Burgess, P. W., Veitch, E., de Lacy Costello, A., & Shallice, T.
(2000). The
cognitive and neuroanatomical correlates of multitasking.
Neuropsycho-
logia, 38, 848–863. http://dx.doi.org/10.1016/S0028-
3932(99)00134-7
Cohen, G. (1996). Memory in the real world (2nd ed.). Hove,
UK: Psy-
chology Press.
Craik, F. I. M. (1983). On the transfer of information from
temporary to
permanent memory. Philosophical Transactions of the Royal
Society of
London Series B, Biological Sciences, 301, 341–359.
http://dx.doi.org/
10.1098/rstb.1983.0059
Craik, F. I. M., & Bialystok, E. (2006). Planning and task
management in
older adults: Cooking breakfast. Memory & Cognition, 34,
1236–1249.
http://dx.doi.org/10.3758/BF03193268
Desmond, D. W., Tatemichi, T. K., & Hanzawa, L. (1994). The
telephone
interview for cognitive status (TICS): Reliability and validity in
a stroke
sample. International Journal of Geriatric Psychiatry, 9, 803–
807.
http://dx.doi.org/10.1002/gps.930091006
Gauntlett-Gilbert, J., Roberts, R. C., & Brown, V. J. (1999).
Mechanisms
underlying attentional set-shifting in Parkinson’s disease.
Neuropsycho-
logia, 37, 605–616. http://dx.doi.org/10.1016/S0028-
3932(98)00049-9
262 ROSE, LUO, BIALYSTOK, HERING, LAU, AND CRAIK
Gilhooly, K. J. (2005). Working memory and planning. In R.
Morris & G.
Ward (Eds.), The cognitive psychology of planning (pp. 71–88).
New
York, NY: Psychology Press.
Gilhooly, K. J., Wynn, V., Phillips, L. H., Logie, R. H., & Della
Sala, S.
(2002). Visuo-spatial and verbal working memory in the five-
disc Tower
of London task: An individual differences approach. Thinking &
Rea-
soning, 8, 165–178.
http://dx.doi.org/10.1080/13546780244000006
Kerr, S. (1991). Prospective memory, aging, and lapses of
intention.
Unpublished master’s thesis, University of Toronto, Toronto,
Canada.
Logie, R. H., Trawley, S., & Law, A. (2011). Multitasking:
Multiple,
domain-specific cognitive functions in a virtual environment.
Memory &
Cognition, 39, 1561–1574. http://dx.doi.org/10.3758/s13421-
011-
0120-1
McDaniel, M. A., & Einstein, G. O. (2000). Strategic and
automatic
processes in prospective memory retrieval: A multiprocess
framework.
Applied Cognitive Psychology, 14, S127–S144.
http://dx.doi.org/
10.1002/acp.775
Milner, B. (1971). Interhemispheric differences in the
localization of
psychological processes in man. British Medical Bulletin, 27,
272–277.
Morris, R., & Ward, G. (Eds.). (2005). The cognitive
psychology of
planning. New York: Psychology Press.
Owen, A. M. (1997). Cognitive planning in humans:
Neuropsychological,
neuroanatomical and neuropharmacological perspectives.
Progress in
Neurobiology, 53, 431– 450. http://dx.doi.org/10.1016/S0301-
0082(97)00042-7
Owen, A. M. (2005). Cognitive planning in humans: New
insights from the
Tower of London (TOL) task. In R. Morris & G. Ward (Eds.),
The
cognitive psychology of planning (pp. 135–151). New York,
NY: Psy-
chology Press.
Phillips, L. H., Wynn, V., Gilhooly, K. J., Della Sala, S., &
Logie, R. H.
(1999). The role of memory in the Tower of London task.
Memory, 7,
209–231. http://dx.doi.org/10.1080/741944066
Raven, J. C., Court, J. H., & Raven, J. (1996). Manual for
Raven’s
Progressive Matrices and Mill Hill Vocabulary Scales. Oxford,
UK:
Oxford Psychologists Press.
Rendell, P. G., & Craik, F. I. M. (2000). Virtual Week and
actual week:
Age-related differences in prospective memory. Applied
Cognitive Psy-
chology, 14, S43–S62. http://dx.doi.org/10.1002/acp.770
Rendell, P. G., & Henry, J. D. (2009). A review of Virtual Week
for
prospective memory assessment: Clinical implications. Brain
Impair-
ment, 10, 14–22. http://dx.doi.org/10.1375/brim.10.1.14
Rose, N. S., Rendell, P. G., McDaniel, M. A., Aberle, I., &
Kliegel, M.
(2010). Age and individual differences in prospective memory
during a
“Virtual Week”: The roles of working memory, vigilance, task
regular-
ity, and cue focality. Psychology and Aging, 25, 595–605.
http://dx.doi
.org/10.1037/a0019771
Stroop, J. R. (1935). Studies of interference in serial verbal
reactions.
Journal of Experimental Psychology, 18, 643–662.
http://dx.doi.org/
10.1037/h0054651
Tanguay, A. N., Davidson, P. S. R., Guerrero Nuñez, K. V., &
Ferland,
M. B. (2014). Cooking breakfast after a brain injury. Frontiers
in
Behavioral Neuroscience, 8, 272.
http://dx.doi.org/10.3389/fnbeh.2014
.00272
Ward, G., & Morris, R. (2005). Introduction to the psychology
of planning.
In R. Morris & G. Ward (Eds.), The cognitive psychology of
planning
(pp. 1–34). New York, NY: Psychology Press.
Wechsler, D. (1997). Wechsler Adult Intelligence Scale (3rd
ed.). San
Antonio, TX: Harcourt Assessment.
West, R., McNerney, M. W., & Krauss, I. (2007). Impaired
strategic
monitoring as the locus of a focal prospective memory deficit.
Neuro-
case, 13, 115–126.
http://dx.doi.org/10.1080/13554790701399247
Zachary, R. A. (1986). Shipley Institute of Living Scale:
Revised manual.
Los Angeles, CA: Western Psychological Services.
Received October 25, 2014
Accepted March 16, 2015 �
263COGNITIVE PROCESSES IN THE BREAKFAST TASK
Describe at least three ways that factors in the external
environment influence employee behavior. If you were an HRD
professional involved with an action team that was charged with
evaluating the likely success of a proposed downsizing of your
organization, what factors would you want to consider in
making this recommendation? That is, based on what you know
of HRD to this point, how can HRD professionals impact the
likely success or failure of this action?
External factors that affect the employees’ behavior are:
• Economic factor: If the economy is booming and employees
have plenty of jobs, then the behaviour at the work would be
overall happier. On the contrary, there will be fear and
anxiousness among employees if the economy is facing
recession. That anxiety leads to lower productivity and hamper
employee performance.
• Technological factor: Day by day advancement in the
technology made employees feel regressive and less motivated.
Employees resist changing and avoiding learning new things. To
avoid this situation, a manager should impart timely updated
training to employees.
• Competition in Industry: Increased competition within an
industry may raise questions on the survival of the company
which leads to frustration and less motivated employees.
However, employees feel motivated in a stable industry where it
is easy to attract customers.
Explain the role that trainability plays in the effectiveness of an
HRD program or intervention. Briefly describe the options
available to assess the trainability of employees.
Following are the roles of the trainability in the effectiveness of
an HRD intervention:
• The foremost role of the trainability is to place the trained
employees who are self-motivated so they can perform well
without wastage of time and resources.
• Another role of trainability in the effectiveness of an HRD
program is to increase the numbers of trainees who take less
time in the training period or whom company have to incur less
expense.
Cognitive Processes in the Breakfast Task Planning and Monito.docx

More Related Content

Similar to Cognitive Processes in the Breakfast Task Planning and Monito.docx

The use of cardiac orienting responses as an early and scalable biomarker of ...
The use of cardiac orienting responses as an early and scalable biomarker of ...The use of cardiac orienting responses as an early and scalable biomarker of ...
The use of cardiac orienting responses as an early and scalable biomarker of ...BARRY STANLEY 2 fasd
 
Role of Executive Functioning and Literary Reapproach for Measures of Intelli...
Role of Executive Functioning and Literary Reapproach for Measures of Intelli...Role of Executive Functioning and Literary Reapproach for Measures of Intelli...
Role of Executive Functioning and Literary Reapproach for Measures of Intelli...inventionjournals
 
Dingus_SchoolFeedingPrograms
Dingus_SchoolFeedingProgramsDingus_SchoolFeedingPrograms
Dingus_SchoolFeedingProgramsDavid J Dingus
 
Wekerle CIHR Team - Can we identify biological markers of risk and resilienc...
Wekerle CIHR Team -  Can we identify biological markers of risk and resilienc...Wekerle CIHR Team -  Can we identify biological markers of risk and resilienc...
Wekerle CIHR Team - Can we identify biological markers of risk and resilienc...Christine Wekerle
 
Holt et al. (2015) NeuroImageClinical Looming Controls and Patients
Holt et al. (2015) NeuroImageClinical Looming Controls and PatientsHolt et al. (2015) NeuroImageClinical Looming Controls and Patients
Holt et al. (2015) NeuroImageClinical Looming Controls and PatientsStephanie DeCross
 
Evidence based practices for asd a review (2015)
Evidence based practices for asd a review (2015)Evidence based practices for asd a review (2015)
Evidence based practices for asd a review (2015)Jeane Araujo
 
Execitive function and fluid inteligence after frontal lobe lesions
Execitive function and fluid inteligence after frontal lobe lesionsExecitive function and fluid inteligence after frontal lobe lesions
Execitive function and fluid inteligence after frontal lobe lesionsJUAN MANUEL CAMACHO BETANCOURT
 
1. AbstractResearchers function in a complex environment and.docx
1. AbstractResearchers function in a complex environment and.docx1. AbstractResearchers function in a complex environment and.docx
1. AbstractResearchers function in a complex environment and.docxSONU61709
 
The Effects of Sleep Deprivation on Item and AssociativeReco.docx
The Effects of Sleep Deprivation on Item and AssociativeReco.docxThe Effects of Sleep Deprivation on Item and AssociativeReco.docx
The Effects of Sleep Deprivation on Item and AssociativeReco.docxtodd701
 
The Relationship Between Body Image And The Media
The Relationship Between Body Image And The MediaThe Relationship Between Body Image And The Media
The Relationship Between Body Image And The MediaJessica Myers
 
High School Start time paper
High School Start time paperHigh School Start time paper
High School Start time paperSarah Hashmi
 
Task switchingStephen MonsellSchool of Psychology Univer.docx
Task switchingStephen MonsellSchool of Psychology Univer.docxTask switchingStephen MonsellSchool of Psychology Univer.docx
Task switchingStephen MonsellSchool of Psychology Univer.docxjosies1
 
The effects of skipping breakfast on the academic performance
The effects of skipping breakfast on the academic performance The effects of skipping breakfast on the academic performance
The effects of skipping breakfast on the academic performance Hafizah R
 
Poster2_Hillary_PhysAct+Cogn (1)
Poster2_Hillary_PhysAct+Cogn (1)Poster2_Hillary_PhysAct+Cogn (1)
Poster2_Hillary_PhysAct+Cogn (1)Hillary Nguyen
 
Fluid reasoning and the developing brain
Fluid reasoning and the developing brainFluid reasoning and the developing brain
Fluid reasoning and the developing braincarlafig
 
O R I G I N A L A R T I C L EThe Brief Attachment Scale (B.docx
O R I G I N A L A R T I C L EThe Brief Attachment Scale (B.docxO R I G I N A L A R T I C L EThe Brief Attachment Scale (B.docx
O R I G I N A L A R T I C L EThe Brief Attachment Scale (B.docxvannagoforth
 
Attentional Changes During Implicit Learning Signal Validity .docx
Attentional Changes During Implicit Learning Signal Validity .docxAttentional Changes During Implicit Learning Signal Validity .docx
Attentional Changes During Implicit Learning Signal Validity .docxrock73
 
Accelerating The Development Of Formal Thinking In Middle And High School Stu...
Accelerating The Development Of Formal Thinking In Middle And High School Stu...Accelerating The Development Of Formal Thinking In Middle And High School Stu...
Accelerating The Development Of Formal Thinking In Middle And High School Stu...Steven Wallach
 

Similar to Cognitive Processes in the Breakfast Task Planning and Monito.docx (20)

The use of cardiac orienting responses as an early and scalable biomarker of ...
The use of cardiac orienting responses as an early and scalable biomarker of ...The use of cardiac orienting responses as an early and scalable biomarker of ...
The use of cardiac orienting responses as an early and scalable biomarker of ...
 
Transmisi Publikasi
Transmisi Publikasi Transmisi Publikasi
Transmisi Publikasi
 
Role of Executive Functioning and Literary Reapproach for Measures of Intelli...
Role of Executive Functioning and Literary Reapproach for Measures of Intelli...Role of Executive Functioning and Literary Reapproach for Measures of Intelli...
Role of Executive Functioning and Literary Reapproach for Measures of Intelli...
 
Dingus_SchoolFeedingPrograms
Dingus_SchoolFeedingProgramsDingus_SchoolFeedingPrograms
Dingus_SchoolFeedingPrograms
 
EFPoster
EFPosterEFPoster
EFPoster
 
Wekerle CIHR Team - Can we identify biological markers of risk and resilienc...
Wekerle CIHR Team -  Can we identify biological markers of risk and resilienc...Wekerle CIHR Team -  Can we identify biological markers of risk and resilienc...
Wekerle CIHR Team - Can we identify biological markers of risk and resilienc...
 
Holt et al. (2015) NeuroImageClinical Looming Controls and Patients
Holt et al. (2015) NeuroImageClinical Looming Controls and PatientsHolt et al. (2015) NeuroImageClinical Looming Controls and Patients
Holt et al. (2015) NeuroImageClinical Looming Controls and Patients
 
Evidence based practices for asd a review (2015)
Evidence based practices for asd a review (2015)Evidence based practices for asd a review (2015)
Evidence based practices for asd a review (2015)
 
Execitive function and fluid inteligence after frontal lobe lesions
Execitive function and fluid inteligence after frontal lobe lesionsExecitive function and fluid inteligence after frontal lobe lesions
Execitive function and fluid inteligence after frontal lobe lesions
 
1. AbstractResearchers function in a complex environment and.docx
1. AbstractResearchers function in a complex environment and.docx1. AbstractResearchers function in a complex environment and.docx
1. AbstractResearchers function in a complex environment and.docx
 
The Effects of Sleep Deprivation on Item and AssociativeReco.docx
The Effects of Sleep Deprivation on Item and AssociativeReco.docxThe Effects of Sleep Deprivation on Item and AssociativeReco.docx
The Effects of Sleep Deprivation on Item and AssociativeReco.docx
 
The Relationship Between Body Image And The Media
The Relationship Between Body Image And The MediaThe Relationship Between Body Image And The Media
The Relationship Between Body Image And The Media
 
High School Start time paper
High School Start time paperHigh School Start time paper
High School Start time paper
 
Task switchingStephen MonsellSchool of Psychology Univer.docx
Task switchingStephen MonsellSchool of Psychology Univer.docxTask switchingStephen MonsellSchool of Psychology Univer.docx
Task switchingStephen MonsellSchool of Psychology Univer.docx
 
The effects of skipping breakfast on the academic performance
The effects of skipping breakfast on the academic performance The effects of skipping breakfast on the academic performance
The effects of skipping breakfast on the academic performance
 
Poster2_Hillary_PhysAct+Cogn (1)
Poster2_Hillary_PhysAct+Cogn (1)Poster2_Hillary_PhysAct+Cogn (1)
Poster2_Hillary_PhysAct+Cogn (1)
 
Fluid reasoning and the developing brain
Fluid reasoning and the developing brainFluid reasoning and the developing brain
Fluid reasoning and the developing brain
 
O R I G I N A L A R T I C L EThe Brief Attachment Scale (B.docx
O R I G I N A L A R T I C L EThe Brief Attachment Scale (B.docxO R I G I N A L A R T I C L EThe Brief Attachment Scale (B.docx
O R I G I N A L A R T I C L EThe Brief Attachment Scale (B.docx
 
Attentional Changes During Implicit Learning Signal Validity .docx
Attentional Changes During Implicit Learning Signal Validity .docxAttentional Changes During Implicit Learning Signal Validity .docx
Attentional Changes During Implicit Learning Signal Validity .docx
 
Accelerating The Development Of Formal Thinking In Middle And High School Stu...
Accelerating The Development Of Formal Thinking In Middle And High School Stu...Accelerating The Development Of Formal Thinking In Middle And High School Stu...
Accelerating The Development Of Formal Thinking In Middle And High School Stu...
 

More from mary772

Coding NotesImproving Diagnosis By Jacquie zegan, CCS, w.docx
Coding NotesImproving Diagnosis By Jacquie zegan, CCS, w.docxCoding NotesImproving Diagnosis By Jacquie zegan, CCS, w.docx
Coding NotesImproving Diagnosis By Jacquie zegan, CCS, w.docxmary772
 
CNL-521 Topic 3 Vargas Case StudyBob and Elizabeth arrive.docx
CNL-521 Topic 3 Vargas Case StudyBob and Elizabeth arrive.docxCNL-521 Topic 3 Vargas Case StudyBob and Elizabeth arrive.docx
CNL-521 Topic 3 Vargas Case StudyBob and Elizabeth arrive.docxmary772
 
Cognitive and Language Development Milestones Picture Book[WLO .docx
Cognitive and Language Development Milestones Picture Book[WLO .docxCognitive and Language Development Milestones Picture Book[WLO .docx
Cognitive and Language Development Milestones Picture Book[WLO .docxmary772
 
Codes of (un)dress and gender constructs from the Greek to t.docx
Codes of (un)dress and gender constructs from the Greek to t.docxCodes of (un)dress and gender constructs from the Greek to t.docx
Codes of (un)dress and gender constructs from the Greek to t.docxmary772
 
Coding Assignment 3CSC 330 Advanced Data Structures, Spri.docx
Coding Assignment 3CSC 330 Advanced Data Structures, Spri.docxCoding Assignment 3CSC 330 Advanced Data Structures, Spri.docx
Coding Assignment 3CSC 330 Advanced Data Structures, Spri.docxmary772
 
CodeZipButtonDemo.javaCodeZipButtonDemo.java Demonstrate a p.docx
CodeZipButtonDemo.javaCodeZipButtonDemo.java Demonstrate a p.docxCodeZipButtonDemo.javaCodeZipButtonDemo.java Demonstrate a p.docx
CodeZipButtonDemo.javaCodeZipButtonDemo.java Demonstrate a p.docxmary772
 
CoevolutionOver the ages, many species have become irremediably .docx
CoevolutionOver the ages, many species have become irremediably .docxCoevolutionOver the ages, many species have become irremediably .docx
CoevolutionOver the ages, many species have become irremediably .docxmary772
 
Coding Component (50)Weve provided you with an implementation .docx
Coding Component (50)Weve provided you with an implementation .docxCoding Component (50)Weve provided you with an implementation .docx
Coding Component (50)Weve provided you with an implementation .docxmary772
 
Codes of Ethics Guides Not Prescriptions A set of rules and di.docx
Codes of Ethics Guides Not Prescriptions A set of rules and di.docxCodes of Ethics Guides Not Prescriptions A set of rules and di.docx
Codes of Ethics Guides Not Prescriptions A set of rules and di.docxmary772
 
Codecademy Monetizing a Movement 815-093 815-093 Codecademy.docx
Codecademy Monetizing a Movement 815-093 815-093 Codecademy.docxCodecademy Monetizing a Movement 815-093 815-093 Codecademy.docx
Codecademy Monetizing a Movement 815-093 815-093 Codecademy.docxmary772
 
Code switching involves using 1 language or nonstandard versions of .docx
Code switching involves using 1 language or nonstandard versions of .docxCode switching involves using 1 language or nonstandard versions of .docx
Code switching involves using 1 language or nonstandard versions of .docxmary772
 
Code of Ethics for the Nutrition and Dietetics Pr.docx
Code of Ethics  for the Nutrition and Dietetics Pr.docxCode of Ethics  for the Nutrition and Dietetics Pr.docx
Code of Ethics for the Nutrition and Dietetics Pr.docxmary772
 
Code of Ethics for Engineers 4. Engineers shall act .docx
Code of Ethics for Engineers 4. Engineers shall act .docxCode of Ethics for Engineers 4. Engineers shall act .docx
Code of Ethics for Engineers 4. Engineers shall act .docxmary772
 
Coder Name Rebecca Oquendo .docx
Coder Name  Rebecca Oquendo                                    .docxCoder Name  Rebecca Oquendo                                    .docx
Coder Name Rebecca Oquendo .docxmary772
 
Codes of Ethical Conduct A Bottom-Up ApproachRonald Paul .docx
Codes of Ethical Conduct A Bottom-Up ApproachRonald Paul .docxCodes of Ethical Conduct A Bottom-Up ApproachRonald Paul .docx
Codes of Ethical Conduct A Bottom-Up ApproachRonald Paul .docxmary772
 
CNL-530 Topic 2 Sexual Response Cycle ChartMasters and John.docx
CNL-530 Topic 2 Sexual Response Cycle ChartMasters and John.docxCNL-530 Topic 2 Sexual Response Cycle ChartMasters and John.docx
CNL-530 Topic 2 Sexual Response Cycle ChartMasters and John.docxmary772
 
Code#RE00200012002020MN2DGHEType of Service.docx
Code#RE00200012002020MN2DGHEType of Service.docxCode#RE00200012002020MN2DGHEType of Service.docx
Code#RE00200012002020MN2DGHEType of Service.docxmary772
 
CODE OF ETHICSReview the following case study and address the qu.docx
CODE OF ETHICSReview the following case study and address the qu.docxCODE OF ETHICSReview the following case study and address the qu.docx
CODE OF ETHICSReview the following case study and address the qu.docxmary772
 
cocaine, conspiracy theories and the cia in central america by Craig.docx
cocaine, conspiracy theories and the cia in central america by Craig.docxcocaine, conspiracy theories and the cia in central america by Craig.docx
cocaine, conspiracy theories and the cia in central america by Craig.docxmary772
 
Code of EthicsThe Code of Ethical Conduct and Statement of Com.docx
Code of EthicsThe Code of Ethical Conduct and Statement of Com.docxCode of EthicsThe Code of Ethical Conduct and Statement of Com.docx
Code of EthicsThe Code of Ethical Conduct and Statement of Com.docxmary772
 

More from mary772 (20)

Coding NotesImproving Diagnosis By Jacquie zegan, CCS, w.docx
Coding NotesImproving Diagnosis By Jacquie zegan, CCS, w.docxCoding NotesImproving Diagnosis By Jacquie zegan, CCS, w.docx
Coding NotesImproving Diagnosis By Jacquie zegan, CCS, w.docx
 
CNL-521 Topic 3 Vargas Case StudyBob and Elizabeth arrive.docx
CNL-521 Topic 3 Vargas Case StudyBob and Elizabeth arrive.docxCNL-521 Topic 3 Vargas Case StudyBob and Elizabeth arrive.docx
CNL-521 Topic 3 Vargas Case StudyBob and Elizabeth arrive.docx
 
Cognitive and Language Development Milestones Picture Book[WLO .docx
Cognitive and Language Development Milestones Picture Book[WLO .docxCognitive and Language Development Milestones Picture Book[WLO .docx
Cognitive and Language Development Milestones Picture Book[WLO .docx
 
Codes of (un)dress and gender constructs from the Greek to t.docx
Codes of (un)dress and gender constructs from the Greek to t.docxCodes of (un)dress and gender constructs from the Greek to t.docx
Codes of (un)dress and gender constructs from the Greek to t.docx
 
Coding Assignment 3CSC 330 Advanced Data Structures, Spri.docx
Coding Assignment 3CSC 330 Advanced Data Structures, Spri.docxCoding Assignment 3CSC 330 Advanced Data Structures, Spri.docx
Coding Assignment 3CSC 330 Advanced Data Structures, Spri.docx
 
CodeZipButtonDemo.javaCodeZipButtonDemo.java Demonstrate a p.docx
CodeZipButtonDemo.javaCodeZipButtonDemo.java Demonstrate a p.docxCodeZipButtonDemo.javaCodeZipButtonDemo.java Demonstrate a p.docx
CodeZipButtonDemo.javaCodeZipButtonDemo.java Demonstrate a p.docx
 
CoevolutionOver the ages, many species have become irremediably .docx
CoevolutionOver the ages, many species have become irremediably .docxCoevolutionOver the ages, many species have become irremediably .docx
CoevolutionOver the ages, many species have become irremediably .docx
 
Coding Component (50)Weve provided you with an implementation .docx
Coding Component (50)Weve provided you with an implementation .docxCoding Component (50)Weve provided you with an implementation .docx
Coding Component (50)Weve provided you with an implementation .docx
 
Codes of Ethics Guides Not Prescriptions A set of rules and di.docx
Codes of Ethics Guides Not Prescriptions A set of rules and di.docxCodes of Ethics Guides Not Prescriptions A set of rules and di.docx
Codes of Ethics Guides Not Prescriptions A set of rules and di.docx
 
Codecademy Monetizing a Movement 815-093 815-093 Codecademy.docx
Codecademy Monetizing a Movement 815-093 815-093 Codecademy.docxCodecademy Monetizing a Movement 815-093 815-093 Codecademy.docx
Codecademy Monetizing a Movement 815-093 815-093 Codecademy.docx
 
Code switching involves using 1 language or nonstandard versions of .docx
Code switching involves using 1 language or nonstandard versions of .docxCode switching involves using 1 language or nonstandard versions of .docx
Code switching involves using 1 language or nonstandard versions of .docx
 
Code of Ethics for the Nutrition and Dietetics Pr.docx
Code of Ethics  for the Nutrition and Dietetics Pr.docxCode of Ethics  for the Nutrition and Dietetics Pr.docx
Code of Ethics for the Nutrition and Dietetics Pr.docx
 
Code of Ethics for Engineers 4. Engineers shall act .docx
Code of Ethics for Engineers 4. Engineers shall act .docxCode of Ethics for Engineers 4. Engineers shall act .docx
Code of Ethics for Engineers 4. Engineers shall act .docx
 
Coder Name Rebecca Oquendo .docx
Coder Name  Rebecca Oquendo                                    .docxCoder Name  Rebecca Oquendo                                    .docx
Coder Name Rebecca Oquendo .docx
 
Codes of Ethical Conduct A Bottom-Up ApproachRonald Paul .docx
Codes of Ethical Conduct A Bottom-Up ApproachRonald Paul .docxCodes of Ethical Conduct A Bottom-Up ApproachRonald Paul .docx
Codes of Ethical Conduct A Bottom-Up ApproachRonald Paul .docx
 
CNL-530 Topic 2 Sexual Response Cycle ChartMasters and John.docx
CNL-530 Topic 2 Sexual Response Cycle ChartMasters and John.docxCNL-530 Topic 2 Sexual Response Cycle ChartMasters and John.docx
CNL-530 Topic 2 Sexual Response Cycle ChartMasters and John.docx
 
Code#RE00200012002020MN2DGHEType of Service.docx
Code#RE00200012002020MN2DGHEType of Service.docxCode#RE00200012002020MN2DGHEType of Service.docx
Code#RE00200012002020MN2DGHEType of Service.docx
 
CODE OF ETHICSReview the following case study and address the qu.docx
CODE OF ETHICSReview the following case study and address the qu.docxCODE OF ETHICSReview the following case study and address the qu.docx
CODE OF ETHICSReview the following case study and address the qu.docx
 
cocaine, conspiracy theories and the cia in central america by Craig.docx
cocaine, conspiracy theories and the cia in central america by Craig.docxcocaine, conspiracy theories and the cia in central america by Craig.docx
cocaine, conspiracy theories and the cia in central america by Craig.docx
 
Code of EthicsThe Code of Ethical Conduct and Statement of Com.docx
Code of EthicsThe Code of Ethical Conduct and Statement of Com.docxCode of EthicsThe Code of Ethical Conduct and Statement of Com.docx
Code of EthicsThe Code of Ethical Conduct and Statement of Com.docx
 

Recently uploaded

Making communications land - Are they received and understood as intended? we...
Making communications land - Are they received and understood as intended? we...Making communications land - Are they received and understood as intended? we...
Making communications land - Are they received and understood as intended? we...Association for Project Management
 
Kodo Millet PPT made by Ghanshyam bairwa college of Agriculture kumher bhara...
Kodo Millet  PPT made by Ghanshyam bairwa college of Agriculture kumher bhara...Kodo Millet  PPT made by Ghanshyam bairwa college of Agriculture kumher bhara...
Kodo Millet PPT made by Ghanshyam bairwa college of Agriculture kumher bhara...pradhanghanshyam7136
 
HMCS Max Bernays Pre-Deployment Brief (May 2024).pptx
HMCS Max Bernays Pre-Deployment Brief (May 2024).pptxHMCS Max Bernays Pre-Deployment Brief (May 2024).pptx
HMCS Max Bernays Pre-Deployment Brief (May 2024).pptxEsquimalt MFRC
 
ICT role in 21st century education and it's challenges.
ICT role in 21st century education and it's challenges.ICT role in 21st century education and it's challenges.
ICT role in 21st century education and it's challenges.MaryamAhmad92
 
Accessible Digital Futures project (20/03/2024)
Accessible Digital Futures project (20/03/2024)Accessible Digital Futures project (20/03/2024)
Accessible Digital Futures project (20/03/2024)Jisc
 
SOC 101 Demonstration of Learning Presentation
SOC 101 Demonstration of Learning PresentationSOC 101 Demonstration of Learning Presentation
SOC 101 Demonstration of Learning Presentationcamerronhm
 
Basic Civil Engineering first year Notes- Chapter 4 Building.pptx
Basic Civil Engineering first year Notes- Chapter 4 Building.pptxBasic Civil Engineering first year Notes- Chapter 4 Building.pptx
Basic Civil Engineering first year Notes- Chapter 4 Building.pptxDenish Jangid
 
Single or Multiple melodic lines structure
Single or Multiple melodic lines structureSingle or Multiple melodic lines structure
Single or Multiple melodic lines structuredhanjurrannsibayan2
 
Jual Obat Aborsi Hongkong ( Asli No.1 ) 085657271886 Obat Penggugur Kandungan...
Jual Obat Aborsi Hongkong ( Asli No.1 ) 085657271886 Obat Penggugur Kandungan...Jual Obat Aborsi Hongkong ( Asli No.1 ) 085657271886 Obat Penggugur Kandungan...
Jual Obat Aborsi Hongkong ( Asli No.1 ) 085657271886 Obat Penggugur Kandungan...ZurliaSoop
 
How to Manage Global Discount in Odoo 17 POS
How to Manage Global Discount in Odoo 17 POSHow to Manage Global Discount in Odoo 17 POS
How to Manage Global Discount in Odoo 17 POSCeline George
 
ComPTIA Overview | Comptia Security+ Book SY0-701
ComPTIA Overview | Comptia Security+ Book SY0-701ComPTIA Overview | Comptia Security+ Book SY0-701
ComPTIA Overview | Comptia Security+ Book SY0-701bronxfugly43
 
Graduate Outcomes Presentation Slides - English
Graduate Outcomes Presentation Slides - EnglishGraduate Outcomes Presentation Slides - English
Graduate Outcomes Presentation Slides - Englishneillewis46
 
2024-NATIONAL-LEARNING-CAMP-AND-OTHER.pptx
2024-NATIONAL-LEARNING-CAMP-AND-OTHER.pptx2024-NATIONAL-LEARNING-CAMP-AND-OTHER.pptx
2024-NATIONAL-LEARNING-CAMP-AND-OTHER.pptxMaritesTamaniVerdade
 
Salient Features of India constitution especially power and functions
Salient Features of India constitution especially power and functionsSalient Features of India constitution especially power and functions
Salient Features of India constitution especially power and functionsKarakKing
 
Unit-V; Pricing (Pharma Marketing Management).pptx
Unit-V; Pricing (Pharma Marketing Management).pptxUnit-V; Pricing (Pharma Marketing Management).pptx
Unit-V; Pricing (Pharma Marketing Management).pptxVishalSingh1417
 
Python Notes for mca i year students osmania university.docx
Python Notes for mca i year students osmania university.docxPython Notes for mca i year students osmania university.docx
Python Notes for mca i year students osmania university.docxRamakrishna Reddy Bijjam
 
FSB Advising Checklist - Orientation 2024
FSB Advising Checklist - Orientation 2024FSB Advising Checklist - Orientation 2024
FSB Advising Checklist - Orientation 2024Elizabeth Walsh
 
SKILL OF INTRODUCING THE LESSON MICRO SKILLS.pptx
SKILL OF INTRODUCING THE LESSON MICRO SKILLS.pptxSKILL OF INTRODUCING THE LESSON MICRO SKILLS.pptx
SKILL OF INTRODUCING THE LESSON MICRO SKILLS.pptxAmanpreet Kaur
 
Spellings Wk 3 English CAPS CARES Please Practise
Spellings Wk 3 English CAPS CARES Please PractiseSpellings Wk 3 English CAPS CARES Please Practise
Spellings Wk 3 English CAPS CARES Please PractiseAnaAcapella
 

Recently uploaded (20)

Making communications land - Are they received and understood as intended? we...
Making communications land - Are they received and understood as intended? we...Making communications land - Are they received and understood as intended? we...
Making communications land - Are they received and understood as intended? we...
 
Kodo Millet PPT made by Ghanshyam bairwa college of Agriculture kumher bhara...
Kodo Millet  PPT made by Ghanshyam bairwa college of Agriculture kumher bhara...Kodo Millet  PPT made by Ghanshyam bairwa college of Agriculture kumher bhara...
Kodo Millet PPT made by Ghanshyam bairwa college of Agriculture kumher bhara...
 
HMCS Max Bernays Pre-Deployment Brief (May 2024).pptx
HMCS Max Bernays Pre-Deployment Brief (May 2024).pptxHMCS Max Bernays Pre-Deployment Brief (May 2024).pptx
HMCS Max Bernays Pre-Deployment Brief (May 2024).pptx
 
ICT role in 21st century education and it's challenges.
ICT role in 21st century education and it's challenges.ICT role in 21st century education and it's challenges.
ICT role in 21st century education and it's challenges.
 
Accessible Digital Futures project (20/03/2024)
Accessible Digital Futures project (20/03/2024)Accessible Digital Futures project (20/03/2024)
Accessible Digital Futures project (20/03/2024)
 
SOC 101 Demonstration of Learning Presentation
SOC 101 Demonstration of Learning PresentationSOC 101 Demonstration of Learning Presentation
SOC 101 Demonstration of Learning Presentation
 
Basic Civil Engineering first year Notes- Chapter 4 Building.pptx
Basic Civil Engineering first year Notes- Chapter 4 Building.pptxBasic Civil Engineering first year Notes- Chapter 4 Building.pptx
Basic Civil Engineering first year Notes- Chapter 4 Building.pptx
 
Single or Multiple melodic lines structure
Single or Multiple melodic lines structureSingle or Multiple melodic lines structure
Single or Multiple melodic lines structure
 
Jual Obat Aborsi Hongkong ( Asli No.1 ) 085657271886 Obat Penggugur Kandungan...
Jual Obat Aborsi Hongkong ( Asli No.1 ) 085657271886 Obat Penggugur Kandungan...Jual Obat Aborsi Hongkong ( Asli No.1 ) 085657271886 Obat Penggugur Kandungan...
Jual Obat Aborsi Hongkong ( Asli No.1 ) 085657271886 Obat Penggugur Kandungan...
 
How to Manage Global Discount in Odoo 17 POS
How to Manage Global Discount in Odoo 17 POSHow to Manage Global Discount in Odoo 17 POS
How to Manage Global Discount in Odoo 17 POS
 
ComPTIA Overview | Comptia Security+ Book SY0-701
ComPTIA Overview | Comptia Security+ Book SY0-701ComPTIA Overview | Comptia Security+ Book SY0-701
ComPTIA Overview | Comptia Security+ Book SY0-701
 
Graduate Outcomes Presentation Slides - English
Graduate Outcomes Presentation Slides - EnglishGraduate Outcomes Presentation Slides - English
Graduate Outcomes Presentation Slides - English
 
Mehran University Newsletter Vol-X, Issue-I, 2024
Mehran University Newsletter Vol-X, Issue-I, 2024Mehran University Newsletter Vol-X, Issue-I, 2024
Mehran University Newsletter Vol-X, Issue-I, 2024
 
2024-NATIONAL-LEARNING-CAMP-AND-OTHER.pptx
2024-NATIONAL-LEARNING-CAMP-AND-OTHER.pptx2024-NATIONAL-LEARNING-CAMP-AND-OTHER.pptx
2024-NATIONAL-LEARNING-CAMP-AND-OTHER.pptx
 
Salient Features of India constitution especially power and functions
Salient Features of India constitution especially power and functionsSalient Features of India constitution especially power and functions
Salient Features of India constitution especially power and functions
 
Unit-V; Pricing (Pharma Marketing Management).pptx
Unit-V; Pricing (Pharma Marketing Management).pptxUnit-V; Pricing (Pharma Marketing Management).pptx
Unit-V; Pricing (Pharma Marketing Management).pptx
 
Python Notes for mca i year students osmania university.docx
Python Notes for mca i year students osmania university.docxPython Notes for mca i year students osmania university.docx
Python Notes for mca i year students osmania university.docx
 
FSB Advising Checklist - Orientation 2024
FSB Advising Checklist - Orientation 2024FSB Advising Checklist - Orientation 2024
FSB Advising Checklist - Orientation 2024
 
SKILL OF INTRODUCING THE LESSON MICRO SKILLS.pptx
SKILL OF INTRODUCING THE LESSON MICRO SKILLS.pptxSKILL OF INTRODUCING THE LESSON MICRO SKILLS.pptx
SKILL OF INTRODUCING THE LESSON MICRO SKILLS.pptx
 
Spellings Wk 3 English CAPS CARES Please Practise
Spellings Wk 3 English CAPS CARES Please PractiseSpellings Wk 3 English CAPS CARES Please Practise
Spellings Wk 3 English CAPS CARES Please Practise
 

Cognitive Processes in the Breakfast Task Planning and Monito.docx

  • 1. Cognitive Processes in the Breakfast Task: Planning and Monitoring Nathan S. Rose Rotman Research Institute at Baycrest, Toronto, Canada Lin Luo and Ellen Bialystok York University Alexandra Hering, Karen Lau, and Fergus I. M. Craik Rotman Research Institute at Baycrest, Toronto, Canada The Breakfast Task (Craik & Bialystok, 2006) is a computerized task that simulates the planning and monitoring requirements involved in cooking breakfast, an everyday activity important for functional independence. In Experiment 1, 28 adults performed the Breakfast Task, and outcome measures were examined with principal component analysis to elucidate the structure of cognitive processes underlying performance. Analyses revealed a 2-component structure which putatively captured global planning and local monitoring abilities. In Experiment 2, the structure of Breakfast Task performance was cross- validated on a new sample of 59 healthy older adults who also performed tests assessing working memory, processing speed, inhibition, reasoning and prospective memory. Factor analyses showed that the global planning component from the Breakfast Task was significantly correlated with individual differences in executive functions but the local monitoring component was independent of such func-
  • 2. tions. The Breakfast Task provides a fast, enjoyable, and lifelike assessment of complex everyday planning and monitoring, and their underlying processes such as working memory and executive functions. Keywords: planning, monitoring, working memory, prospective memory, executive processes The cognitive processes underlying many everyday activities, such as running errands, shopping for groceries, or preparing a meal, are surprisingly complex. To complete such activities it is necessary to formulate a sequence of actions to achieve the goals, store and update the action plan in working memory, and con- sciously monitor and coordinate the execution of subtasks. These aspects of cognitive processes are often grouped under the um- brella term planning (Morris & Ward, 2005). Efficient planning clearly depends on a multitude of cognitive processes, but the relative contribution of specific processes is less clear, and their apparent involvement may depend both on the particular task and on how planning is assessed. Laboratory studies investigating planning behaviour typically adopt one of two general approaches (Ward & Morris, 2005). The first approach is represented by tower tasks, such as Tower of Hanoi and its variants (e.g., Owen, 2005), in which participants are required to solve an unfamiliar problem following a set of restric- tions. This approach has the advantage of experimental control, but is often criticised for its limited applicability to everyday situa-
  • 3. tions. The second approach, in contrast, uses tasks in which the goals and contexts are common in everyday life. Examples of this method include errand tasks and their variants (Burgess, Simons, Coates, & Channon, 2005), in which participants are given a series of tasks to perform in a set order, typically in real-life settings. This approach has the advantage of better ecological validity, but the complexity of such tasks reduces the ability to specify the cognitive components. The present study aims to give a fuller description of the cognitive processes involved in planning by using a simulated “real-life” task that has both ecological validity and experimental control. The task in question is the Breakfast Task (Craik & Bialystok, 2006), which is a computerized task that simulates the planning and task management requirements in a common everyday situa- tion: cooking breakfast. The task is described in detail later, but in overview the participant’s task was to “cook” five breakfast foods in such a way that the five foods were not over- or undercooked, and were “ready to serve” at the same time. The task was imple- mented on a touch-screen computer, and participants started and stopped cooking each food by pressing the START and STOP buttons next to the icon indicating that food (see Figure 1). Cooking progress of each food was indicated by a countdown timer running in real time. Between starting and stopping cooking, the participant also carried out a table-setting task as a background This article was published Online First May 4, 2015.
  • 4. Nathan S. Rose, Rotman Research Institute at Baycrest, Toronto, Can- ada; Lin Luo and Ellen Bialystok, Department of Psychology, York Uni- versity; Alexandra Hering, Karen Lau, and Fergus I. M. Craik, Rotman Research Institute at Baycrest. None of the authors has any financial interest or will receive any financial benefit from the work reported in this article. This work was supported by Grant 8261-03 to Fergus I. M. Craik from the Natural Sciences and Engineering Research Council of Canada, Grant MOP57482 to Ellen Bialystok and Fergus I. M. Craik from the Canadian Institutes of Health Research, and a Kickstart Grant from the Centre for Brain Fitness to Nathan S. Rose and Fergus I. M. Craik. We thank Sharyn Kreuger, Jane Logan, Ashley Morgan, Evelyn Zastepa, Karen Lau, Yunjo Lee, Jenna Ware, and Brittany Murphy for their help with data collection and scoring. Correspondence concerning this article should be addressed to Fergus I. M. Craik, Rotman Research Institute at Baycrest, 3560 Bathurst Street, Toronto, Ontario M6A 2E1, Canada. E-mail: [email protected] Canadian Journal of Experimental Psychology / Revue canadienne de psychologie expérimentale © 2015 Canadian Psychological Association
  • 5. 2015, Vol. 69, No. 3, 252–263 1196-1961/15/$12.00 http://dx.doi.org/10.1037/cep0000054 252 activity. The overall task was to coordinate and manage cooking the foods, while setting as many places as possible. The Breakfast Task clearly demands good multitasking abilities to perform it efficiently, and previous studies have provided mod- els of planning in a multitasking context. As one example, Burgess, Veitch, de Lacy Costello, and Shallice (2000) studied the performance of 60 brain-damaged patients and 60 controls on the Greenwich Test, which consists of three complex open-ended tasks to be performed in 10 min. Their data suggested a three-factor model consisting of memory, planning, and intention, with plan- ning and intention (including prospective memory) being depen- dent on good learning and memory for the rules governing the task. A subsequent study by Logie, Trawley, and Law (2011) followed up the Burgess et al. (2000) findings but used healthy young adults as participants. They used a multiple-errands task performed in a virtual environment: a 3-D model of a four-story building. Logie and colleagues (2011) confirmed the three-factor structure of memory, planning, and intention proposed by Burgess and col- leagues, although memory was not as crucial as a precursor for
  • 6. planning as in the earlier study. Additionally, Logie and colleagues found that a measure of spatial working memory was a strong predictor of success in their task. Interestingly they used the Breakfast Task as their measure of prospective memory but found that Breakfast Task performance did not predict success on their multiple-errand task. As a tentative summary statement, it may be suggested that the factor structure of different multitasking situations will vary de- pending on the precise needs of each particular task. Thus, for example, the Greenwich Test used by Burgess et al. (2000) re- quires substantial learning of complex rules, so planning and intention depended on adequate learning and memory. The task used by Logie et al. (2011) required retention of visuospatial information so it makes sense that visual working memory was a strong predictor of success in their experiment. In the case of the Breakfast Task we predicted that good performance would depend on the ability to formulate and execute a plan, and to maintain the overall goal in mind while monitoring and executing the subgoals. Craik and Bialystok (2006) proposed that the cognitive abilities involved in achieving these goals include working memory, to hold both the general plan and the progress of each food in mind, task switching to switch efficiently between cooking and table setting, and prospective memory, to remember to start and stop foods appropriately. The Breakfast Task measures are sensitive to factors known to affect executive functioning and prospective memory, such as
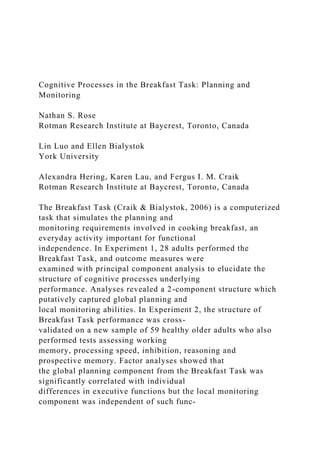
  • 7. healthy aging (Craik & Bialystok, 2006; Kerr, 1991), bilingual- ism (Craik & Bialystok, 2006), and neurological pathologies (Bialystok, Craik, & Stefurak, 2008; West, McNerney, & Krauss, 2007), providing some support for their validity. However, the interpretation of the measures was substantially intuitive. No direct evidence is yet available to establish the relationship between each measure and its proposed underlying cognitive processes. The primary purpose of the present study was thus to provide a more principled description of the cognitive processes involved in the Breakfast Task itself; a secondary purpose was the more general Figure 1. A sample screen for the one-screen condition of the Breakfast Task, showing foods in the process of being cooked. Neither the toast nor the coffee has been started, so their cooking indicators are not yet shown. The eggs and pancakes have each been cooking for a few seconds, and the sausages have been cooking for over 1½ min (Reproduced with permission from Craik & Bialystok, 2006). See the online article for the color version of this figure. 253COGNITIVE PROCESSES IN THE BREAKFAST TASK one of providing more information on the cognitive processes that contribute to efficient planning and task management behaviour. In the first experiment we tested 28 adults aged 39–68 years on the Breakfast Task. We performed principal component analysis (PCA) on the set of breakfast measures to examine the structure of
  • 8. performance. In the second experiment we tested an independent sample of 59 healthy older adults on the task—to cross-validate the structure of Breakfast Task performance—and on a range of tests of cognitive functions. These tests focused on the measurement of executive functions (EF) and prospective memory (PM), the main candidate processes underlying complex planning activities. Just as planning is not a unitary construct, neither should executive functions and prospective memory be regarded as unitary con- structs. We therefore included multiple tests and measures to reflect different aspects of these abilities. We performed explor- atory factor analyses on the sets of EF and PM measures to extract processing components tapped by these measures, and then exam- ined the relations between these processing components and the breakfast measures with correlational analyses. Again, the primary purpose of this paper was to provide a detailed account of the processes measured by the Breakfast Task, rather than to test any particular model of planning and multitasking. Because of this, and the relatively small sample sizes, the analysis techniques used were exploratory ones (PCA, factor analysis and correlations) rather than a confirmatory one such as structural equation modelling. Experiment 1 Method
  • 9. Participants. Twenty-eight adults aged 39–68 years, M � 50.3 years, 18 females and 10 males, participated in the study. The large spread of ages was deliberately chosen with the expectation that this would yield a range of performance levels, similar to what one might expect when testing clinical samples. Participants were volunteers from the community who received $12-per-hr remuner- ation for participation. The participants spoke English fluently and had received 16.7 years of education on average. All participants had normal or corrected-to-normal vision and hearing and stated that they were in good health. Tasks and measures: The Breakfast Task. The Breakfast Task was implemented on a computer using a 34 cm by 27 cm touch-screen monitor. Participants were required to prepare a virtual breakfast consisting of five foods and set a table while the foods were cooking. As depicted in Figure 1, each food was shown on the screen along with its required cooking time, a START and a STOP button, and a thermometer-like timer indicating cooking progress. Participants pressed the buttons to start or stop cooking the corresponding food. Each timer was initially set to the required cooking time for its corresponding food and started to move down in real time once cooking started. After the correct cooking
  • 10. time, the timer reached zero with no further indication of the amount of overcooking. The program recorded the time that the START and STOP buttons were pressed so that the duration of undercooking or overcooking could be calculated. At the same time, participants set a table by placing forks, knives, spoons and plates in the correct arrangement in four place settings (see Figure 1). Participants were told that their primary goal was to cook the foods for the correct duration (i.e., to avoid undercooking or overcooking the foods) and to have all the foods ready at the same time, and their secondary goal was to set as many places as they could. The task began with detailed instructions and a practice session to ensure that participants understood the task. Participants then completed the three conditions described in Craik and Bialystok (2006) in a fixed order. In the one-screen condition (performed first), all the foods and the table were on the same screen, as shown in Figure 1. In the two-screen condition (performed second), the table appeared on one screen and the five foods and their time bars appeared on a different screen, requiring switching between the two screens. In the six-screen condition (performed last), each of the five foods occupied a separate screen, in addition to the table screen. In the present study, the one-screen and two-screen conditions were regarded as practice trials for the six-screen condition, which
  • 11. requires the greatest amounts of planning, monitoring, and task- switching. Performance on this last condition is described in the Results section. The program recorded the timing of all the responses as the participants completed the task. The timing information was used to calculate the following measures. The first variable, discrepancy cooking time was the absolute value of the difference in time between the actual and required cooking times (i.e., amount of undercooking or overcooking) averaged across the five foods, and may therefore reflect the effective management of switching be- tween the primary and secondary tasks. Range of stop times was the difference in seconds between stopping the first and the last food. A value close to zero indicated the foods finished cooking at approximately the same time, thereby reflecting optimal perfor- mance on the primary task goal. Deviation of start times was the average deviation between the ideal and actual start times for Foods 2 to 5. In order for the foods to be done cooking around the same time, the ideal time to start each food depended on when previous foods were started. Therefore, “ideal start times” were cal- culated for each food, adjusted according to the previous start times (for a more detailed description of this calculation, see Craik & Bialystok, 2006). Number of food checks was the number of times the participant switched to the food screen to check the cooking progress for the two- and six-screen conditions. Finally, number of table
  • 12. settings, calculated as the number of settings completed, captured performance on the secondary task (setting the table). Results In this study all participants remembered to start and stop all foods, but the task is demanding with the result that participants often temporarily neglected one or more foods while concentrating on other foods or setting the table. This feature of the task resulted in many cases in which participants might have four discrepancy scores of a few seconds but one poorly monitored food with a discrepancy of 60 s or more. To compensate for such anomalies we took medians as the scored measure for discrepancy cooking times and deviation of start times, and for the same reason took the median of all 10 between-food comparisons of stop times (i.e., the median of differences between Foods 1–2, 1–3, 1–4 . . . 4–5) as the scored measure for range of stop times. Even after these adjustments, the distributions of discrepancies, deviations and ranges were heavily skewed, so the logarithms of these values were used in further analyses. Means for the raw scores of the five scored variables in the six-screen condition are shown in Table 1A, 254 ROSE, LUO, BIALYSTOK, HERING, LAU, AND CRAIK and Pearson correlations among the variables are shown in
  • 13. Table 1B. Principal component analyses (PCA). To examine the struc- ture of the variance in breakfast performance we conducted a PCA with oblique rotation on the measures. To determine the number of components retained in the model, we used a combination of two commonly used criteria based on eigenvalues and a scree test. For all the reported component structures below, all eigenvalues for re- tained components were greater than 1.2, eigenvalues for dropped components were less than 0.9, and the smallest break between eigenvalues for retained components and dropped components was 0.44. The PCA revealed a solution with two components accounting for 62% of the variance (Table 2A). The first component received high loadings from number of table settings, range of stop times and deviation from ideal start times. The second component re- ceived high loadings from number of food checks and discrepancy from stop times. The correlation between the components was 0.15, suggesting the rotation was successful in capturing unique variance between the two components. We interpret the first set of variables as reflecting efficient planning and task management to achieve the primary goal of the task (cook the foods so that they can be served together) and efficient switching between primary
  • 14. and secondary goals (cooking and setting the table). That is, good planning and task management were associated with a large num- ber of table settings, a small range of stop times, and small deviations from ideal start times. We interpret the second set of variables as reflecting the ability to monitor cooking progress and complete the task effectively. In this case good performance was associated with a large number of food checks and a small dis- crepancy between specified and actual cooking times. There is also a sense in which the first component reflects “global” variables associated with good planning in advance of performing the task (many table settings and small deviations from ideal start times resulting in a small range of stop times) whereas the second component reflects more “local” variables associated with many food checks resulting in small discrepancies between actual and ideal stop times for cooking (see also Craik & Bialystok, 2006). Before discussing these results further, we report a second experiment whose function was to cross-validate the structure of breakfast performance on an independent sample and to examine the relations between the breakfast measures and measures of executive functions and prospective memory. Experiment 2 Method Participants. Fifty-nine healthy adults aged 60–79 years, M � 67.4 years, 38 females and 21 males, participated in the study. Participants were screened for dementia using the telephone
  • 15. interview of cognitive status (TICS; Brandt, Spencer, & Folstein, 1988). This instrument has a maximum score of 41, and a cutoff for dementia at 25. We chose a cutoff for participation of 31 and above, based on a prior clinical study by Desmond, Tatemichi, and Hanzawa (1994) whose group of 36 control participants (mean age � 71.8 years) had a mean TICS score of 33.4 (SD � 4.2). In the present case, mean TICS score was 35.8 (SD � 2.1). Partici- pants were fluent English speakers who obtained an average score of 17.3 out of 20 correct on an abbreviated Shipley vocabulary test, and reported an average of 15.4 years of education. All participants Table 1 Means (SDs) of Measures From the Breakfast Task and Correlations Among These Measures (Experiment 1) 1A. Means Table settings Food checks Discrepancy (s) Range (s) Deviation (s) 25.9 (7.8) 13.2 (6.5) 11 (7.4) 11.5 (8.3) 12.8 (15.0) 1B. Correlations (N � 28) Table settings Food checks Discrepancy Range Deviation Table settings 1.00 �.03 0.03 �0.18 �0.38 Food checks 1.00 �0.15 0.29 �0.09 Discrepancy 1.00 0.07 0.21 Range 1.00 0.48�
  • 16. Deviation 1.00 Note. 1A. Values for Discrepancy, Range, and Deviation are based on medians but values reported in this table are the mean of those median values. 1B. Values for Discrepancy, Range, and Deviations used in correlations were log medians (see text). � Correlation significant at p � .05. Table 2 Rotated Component Structure and Component Loading on the Breakfast Task Measures From Experiments 1 and 2 A. Expt 1 B. Expt 2.1 C. Expt 2.2 Components Factors Factors 1 2 1 2 1 2 Table settings .67 �.24 .38 �.09 .37 �.03 Food checks �.40 .74 .04 .50 .24 .59 Discrepancy �.17 �.71 .37 �.67 .18 �.59 Range �.76 .02 �.99 .16 �.92 .07 Deviation �.76 �.42 �.62 �.43 �.64 �.35 Note. Values in bold type for Experiment (Expt) 1 are significant at p � .05. Values used for Discrepancy, Range, and Deviations were log medians (see text). Discrepancy � discrepancy between specified and actual stop times; Deviation � deviation between ideal and actual start times; Expt 2.1 � data collected on the first occasion; Expt 2.2 � data collected on the second occasion.
  • 17. 255COGNITIVE PROCESSES IN THE BREAKFAST TASK had normal or corrected-to-normal vision and hearing. Addition- ally, 55 of the same participants returned to the lab between 4 and 6 weeks later to perform the Breakfast Task a second time. The study was part of a cognitive training study; 24 of the returning participants had received 12 hr of practice on a computerized version of the Virtual Week task (Rendell & Craik, 2000) de- scribed later; 13 had received instruction in aspects of music, and 18 were controls who received no further training. The resulting data from the second visit provided a further opportunity to assess the structure of the Breakfast Task and to measure test–retest reliabilities of its component measures. Tasks and measures. On the first occasion, participants com- pleted the following tasks in one 2-hr session. On the second occasion, participants again performed the Breakfast Task and the Virtual Week task. Prior to each task, detailed instructions and practice or sample trials were given to the participants to ensure proper understanding. The Breakfast Task. Administration of the Breakfast Task was the same as in Experiment 1 except that participants did not perform the two-screen condition. We wanted to see if the same factor structure could be achieved with a shorter version of the task. Additionally, all participants used the computer mouse rather than a touch screen in this study.
  • 18. Basic cognitive abilities and executive functions. The follow- ing tests assessed a number of basic cognitive abilities and exec- utive functions including verbal knowledge (Shipley vocabulary), processing speed (digit-symbol substitution), working memory (n-back, Corsi block test), inhibition (Stroop test), and reasoning (Raven’s). Data were missing for four participants for the Corsi test (computer error), two participants for the Virtual Week task (computer error), and five participants did not perform the n- back task due to time limitations. Details for all tests are given below. Shipley vocabulary. The vocabulary subtest of the Shipley Institute of Living Scale (Zachary, 1986) was used to assess English vocabulary. To minimise testing time, rather than test all 40 items we tested 20 items; half of the participants received the even-numbered items, and the remainder received the odd- numbered items. For each item, participants were asked to choose the one word out of four which is the most similar in meaning to the prompting word printed in capital letters. The task was scored based on the total number of items completed correctly. Raven’s matrices. The 29-item multiple-choice test examines nonverbal reasoning abilities by requiring participants to correctly choose an answer to complete a pattern (Raven, Court, & Raven, 1996). Participants completed two practice questions. They then tried to complete as many items as they could within a 10-min
  • 19. time limit. The total number of items correct and the number of items attempted were recorded. Digit-symbol substitution task. The digit-symbol task is a speeded task measuring information processing speed (Wechsler, 1997). A legend of nine single digits with corresponding symbols is at the top of the page. Seven rows of digits with empty squares underneath them are under the legend. After completing seven practice items, participants were required to correctly fill in sym- bols under their corresponding numbers as quickly as they could for 2 min. The total number of items correct was recorded. Stroop task (Stroop, 1935). Participants were presented with three sheets. The first sheet contained names of colours printed in black ink, and participants were asked to read the words. The second sheet contained colour patches and participants were asked to name the ink colours. The third sheet was the interference condition, in which colour names were printed in an incongruent ink colour (e.g., the word red printed in green ink). The partici- pants were required to name the ink colour and ignore the words. Participants were instructed to complete each sheet as fast as they could without making any mistakes. The time taken to complete each sheet was measured in seconds. The Stroop Effect was measured by interference cost, expressed as the time difference between the interference condition and the colour-patch naming condition. In this case, good performance is signalled by small
  • 20. cost values. Working memory. Spatial working memory was assessed by a computerized version of the Corsi block task (Milner, 1971). The task consisted of a forward condition and a backward condition. In the forward condition, a 6 � 6 grid of grey squares was displayed on a computer monitor. A sequence of blue squares was then presented serially; that is, one of the 36 squares turned blue briefly, followed by one or more further blue squares depending on se- quence length. Each blue square appeared for 1,000 ms, followed by a blank grid interstimulus interval of 500 ms. Sequence length ranged from two to eight squares. A brief recall prompt that consisted of the grid with a red border around it appeared for 500 ms to indicate the end of the sequence presentation. Participants were then required to reproduce the sequences by clicking on the squares with a computer mouse in the correct order of presentation. Two trials were presented at each span length between two and eight, for a total of 14 trials. The backward condition was similar to the forward condition in that the same presentation design was used but participants were prompted to select the squares that turned blue in the reverse order in which they were presented. Participants completed a practice trial of three squares before moving on to the experimental trials. Fourteen trials were pre- sented, again ranging from two to eight squares. A total correct
  • 21. score was obtained by summing the number of squares selected correctly in both conditions. Verbal working memory was assessed by the n-back task. The n-back task required participants to constantly update information in working memory. The stimuli consisted of a sequence of letters presented at a rate of one per second. On presentation of each letter, participants were to press a key labelled yes or no to indicate whether the letter matched the letter presented two letters back in the sequence. The n-back-block consisted of 50 trials with 17 targets and 33 nontargets. The dependent variable was the propor- tion of hits minus false alarms. Prospective memory. The test of PM was a version of the Virtual Week task (Rendell & Craik, 2000), which is a board game developed to assess PM in a simulated everyday setting. In the current study, participants performed the computerized version of Virtual Week (for details, see Rendell & Henry, 2009; Rose, Rendell, McDaniel, Aberle, & Kliegel, 2010). Each circuit of the game represents one day from 7 a.m. to 10 p.m., and participants move around the board by clicking on a computer icon that simulates the roll of a die. At the beginning of each day, partici- pants click on the “Start Card” button, which shows them cards that indicate the tasks they are required to perform that day. They have to remember to carry out activities either at specified “times”
  • 22. (as they pass the relevant square on the board) or in response to specified “events” that are given on “Event Cards” that come up in 256 ROSE, LUO, BIALYSTOK, HERING, LAU, AND CRAIK the course of the circuit. The PM tasks were either “regular” (the same tasks on all circuits) or “irregular” (different tasks on each circuit). The same four regular tasks were performed on every circuit of the board and were given in instructions before the game started; two were in response to events (taking antibiotics at breakfast and dinner) and two were in response to squares indi- cating virtual times on the board (taking asthma medication at 11 a.m. and 9 p.m.). Irregular tasks also included two tasks in re- sponse to events and two other tasks in response to the virtual time presented in the centre of the screen. These tasks are different for each circuit, however, and were given by either the Start Card at the beginning of each circuit or Event Cards presented during the game. As participants moved around the board, they were required to click on the Event Cards button as they passed “event squares,” make choices about daily activities (e.g., a choice of foods for lunch), and remember to carry out the required activities. All activities were those that people normally do in a typical day. Participants carried out the specified actions by clicking on the “Perform Task” button and selecting the appropriate task from a list of PM tasks and distractors. The third type of PM task was a
  • 23. time check task in which the participant had to click on the Perform Task button and select the “lung capacity test” task when 2 min and also 4 min had elapsed in real time from the start of the current circuit. This “real-life” time was displayed by a clock that began running at the click of the Start button in the centre of the board game and could be checked at any time. Therefore, 10 PM responses were assessed on each day (one complete circuit around the board). Participants completed 3 days of the game following a “practice day.” The 3 days thus included six regular event- related, six regular time-related, six irregular event-related, six irregular time-related, and six time-check responses. The dependent vari- ables were the rate of accuracy for each type of response. Results Effects of training on Breakfast Task performance. The purpose of the training manipulation was to assess whether pro- spective memory was amenable to training, and this aspect of the study is discussed elsewhere. The results of the Breakfast Task, the virtual week task, and the various other cognitive tasks on the first and second occasions of testing are given below. First, however, we wished to determine whether the different training procedures (Virtual Week, Musical Practice, and Controls) had a differential
  • 24. effect on Breakfast Task performance. Accordingly we performed five separate one-way ANOVAs on the five Breakfast Task mea- sures—number of table settings, number of food checks, log median discrepancy, log median range, and log median devia- tion—with the three training groups as a between-subjects vari- able. These analyses yielded no significant effect of training group in any case, all Fs � 1.28, ps � 0.28. Since no measure was affected differentially by the different training procedures we treated all participants on the second occasion as belonging to a single group. Means, correlations and exploratory factor analyses. Tables 3A and 4A show the means of the five Breakfast Task measures on the first and second testing occasion, respectively. As described earlier, medians for each participant were taken as the measure for discrepancy cooking times, range of stop times, and deviation from ideal start times; the values shown in the tables are the means of these medians. The scores in Table 4A (second occasion) show somewhat better performance on all measures than the scores in Table 3A (first occasion); that is, more tables were set and the values of discrepancy, range, and deviation were smaller, in line with the idea that participants were more practiced on the second occasion. The values in Tables 3A and 4A show poorer performance than those from Experiment 1, however (see Table 1), presumably reflecting the fact that the participants in Experiment 1 were younger (50.3 years compared with 67.4 years) and had
  • 25. received more years of education (16.7 years compared with 15.4 years) than the participants in Experiment 2. A further possibility is that use of the touch-screen in Experiment 1, as opposed to the computer mouse in Experiment 2, may have benefited participants in the first study. The correlations among Breakfast Task measures are shown in Tables 3B and 4B. To examine the structure within the breakfast measures and to validate the structure obtained in Experiment 1, we performed exploratory factor analyses specified by two factors on the data from each testing occasion. Exploratory analyses were preferred over confirmatory analyses given that the structure revealed in the Table 3 Means (SDs) of Measures From the Breakfast Task and Correlations Among the Means (Experiment 2, First Occasion) 3A. Means (N � 59) Table settings Food checks Discrepancy (s) Range (s) Deviation (s) 15.0 (2.3) 18.4 (4.7) 25.8 (25.5) 23.2 (21.9) 26.2 (22.0) 3B. Correlations (N � 59) Table settings Food checks Discrepancy Range Deviation Table settings 1.00 �0.05 0.18 �0.39�� �0.20 Food checks 1.00 �0.33� 0.04 �0.16
  • 26. Discrepancy 1.00 �0.47�� 0.05 Range 1.00 0.58�� Deviation 1.00 Note. 3A. Values for Discrepancy, Range, and Deviation are medians. 3B. Values for Discrepancy, Range, and Deviations used in correlations were log medians (see text). � Correlation significant at p � .05. �� Correlation significant at p � .01. 257COGNITIVE PROCESSES IN THE BREAKFAST TASK data from Experiment 1 was not predicted and was obtained from a small sample. Confirmation of the structure was therefore sought by convergence of the same pattern over replications of the task. The two-factor solution using maximum likelihood estimation on the data from the first occasion revealed a structure similar to that shown in Experiment 1 (see Table 2), with the first factor explain- ing 33% of the variance and the second factor explaining 19% of the variance (total � 52%). A goodness-of-fit-test indicated that the observed solution was not different from a two-factor model, �2(1) � 0.15, p � .70. In contrast, fitting the data with a one- factor model resulted in a significant difference between the ob- served and imposed structure in the data, �2(5) � 17.22, p �
  • 27. .005, and the chi-square difference test indicated that the one-factor model was a substantially poorer fit to the data, ��2(1) � 17.07, p � .001. The first factor again received high loadings from a small range of stop times and small deviations from ideal start times. Two differences from Experiment 1 are, first, that the number of food checks no longer loaded on the first factor and, second, that the loading from number of table settings was sub- stantially reduced. The second factor again received high loadings from a large number of food checks and small discrepancies between specified and actual stop times. Thus, cross-validation of the structure of the breakfast measures on an independent sample was achieved with the first set of variables reflecting effective planning and cooking performance (small deviations from ideal start times and a narrow range of stop times), and the second set of variables reflecting the ability to efficiently carry out the plan and monitor cooking progress (a large number of food checks and small discrepancies between specified and actual cooking times for each food). A further exploratory factor analysis was carried out on the data from the second testing occasion. Again, the two-factor model fit the data well, with the first factor accounting for 30% of the variance and the second factor accounting for 16% of the variance. The goodness-of-fit test indicated that the observations were well fit by a two-factor model, �2(1) � 2.23, p � .14, which fitted
  • 28. the data better than a one-factor model, �2(5) � 13.40, p � .02, with a chi-square difference test again indicating that the one-factor model was a significantly poorer fit, ��2(1) � 11.18, p � .001. This analysis (see Table 2C) yielded a very similar pattern to the factor analysis from the first occasion; that is, the first factor received high loadings from a small range of stop times and small deviations from ideal start times. The second factor received high loadings from a large number of food checks and small discrep- ancies between specified and actual cooking times. The other regularities shown across the three analyses shown in Table 2 include a tendency for a large number of table settings to relate to the first factor and small deviations from ideal start times to relate to the second factor. As discussed below, we interpret the first factor as reflecting global aspects of planning, and the second factor as reflecting local aspects of monitoring and task execution. In general, there are striking similarities in the components and factors from all three occasions of testing (Tables 2A, 2B, 2C). Test–retest reliability measures. Pearson product–moment correlations were run between participants’ performance on Break- fast Task measures on the two occasions of testing, and these values are shown in Table 5. Considering performance on the six-screen version only, 39 participants completed all aspects of the task on both occasions. Other participants completed cooking some but not all foods; these participants were dropped from
  • 29. this analysis. Test–retest correlations were significant for deviation from ideal start times (0.48), number of table settings (0.76), and Table 4 Means (SDs) of Measures From the Breakfast Task and Correlations Among These Measures (Experiment 2, Second Occasion) 4A. Means (N � 51) Table settings Food checks Discrepancy (s) Range (s) Deviation (s) 16.0 (6.1) 18.4 (5.0) 14.9 (11.9) 20.7 (20.0) 20.4 (16.4) 4B. Correlations (N � 51) Table settings Food checks Discrepancy Range Deviation Table settings 1.00 �0.05 0.00 �0.34� �0.26 Food checks 1.00 �0.30� �0.19 �0.38�� Discrepancy 1.00 �0.22 0.12 Range 1.00 0.58�� Deviation 1.00 Note. 4A. Values for Discrepancy, Range, and Deviation are medians. 4B. Values for Discrepancy, Range, and Deviations used in correlations were log medians (see text). � Correlation significant at p � .05. �� Correlation significant at p � .01.
  • 30. Table 5 Test–Retest Reliability Measures Breakfast measure p Six-Screen version (N � 39) Discrepancy of cooking times .22 .18 Range of stop times .24 .17 Deviation from ideal start time .48 .004 Number of table settings .76 �.001 Number of food checks .34 .03 Combined one-screen and six-screen versions (N � 27) Discrepancy of cooking times .20 .34 Range of stop times .52 .01 Deviation from ideal start time .55 .004 Number of table settings .75 �.001 Number of food checks .34 .03 Note. Correlations significant at p � .05 are printed in bold type. 258 ROSE, LUO, BIALYSTOK, HERING, LAU, AND CRAIK number of food checks (0.34), although not for discrepancy and range measures. Table 5 also shows the values calculated from combined performance on the one-screen and six-screen versions; 27 participants completed all aspects of both tests. The combined scores yielded a similar pattern, although now the range measure also gave a significant correlation (0.52). In one final analysis we
  • 31. correlated latent factor scores from the exploratory factor analyses between the first and second occasions. In the case of the first latent factor, the value of r (n � 45) was 0.33, p � .03; for the second latent factor, r(45) � 0.24, p � .05. The first factor thus seems relatively stable, the second factor less so. One possibility is that the variance associated with the second component may have shifted between the first and second testing occasions as a result of the heterogeneity of experience between test and retest. In general, test–retest reliabilities for the Breakfast Task were significantly positive if rather modest. Breakfast performance in relation to EF and PM. We then examined the relations between Breakfast Task measures collected on the first test occasion, and the EF and PM measures collected on all 59 participants on the first occasion. We examined these correlations using Pearson’s method among all variables (see Table 6) and, as was done for the breakfast measures, we first conducted separate PCA analyses of the EF and PM measures and then examined correlations between the resulting components and the Breakfast Task measures. The PCA conducted on the five tasks tapping higher cognitive functions including processing speed (digit-symbol substitution), working memory (n-back, Corsi block test), inhibition (Stroop test), and reasoning (Raven’s) yielded one general component
  • 32. that accounted for 50% of the total variance. The component loadings of the five measures are presented in Table 7. Although these tasks measure a diverse set of abilities, we interpreted the variance in common among the measures as capturing a general “executive processing” factor, which we then used in subsequent analyses. Inspection of the correlations among the different measures of PM obtained from the Virtual Week task (regular event-related, irregular event-related, regular time-related, irregular time- related, and time check tasks) revealed that the Virtual Week measures were generally intercorrelated (see Table 6); they were then sub- mitted to a PCA with oblique rotation. This analysis yielded a one-component structure that accounted for 55% of the variance. The component loadings are also shown in Table 7. Thus, although the different aspects of the VW task ostensibly measure different components of PM, we interpreted the common variance as re- flecting a general PM ability. We then correlated the EF components and the PM components with the Breakfast measures taken on the first testing occasion only (see Table 8). The EF component showed a significant positive correlation with the number of table settings and signifi- cant negative correlations with range of stop times and deviations from ideal start times on the Breakfast Task. That is, participants
  • 33. with superior performance in EF tended to have more table set- tings, smaller ranges and a smaller deviation from ideal start times; all variables that loaded on the first breakfast component. Taken Table 6 Correlations Among All Variables in Experiment 2 (N � 46–59) 1 2 3 4 5 6 7 8 9 10 11 12 13 14 15 1. DigSymb 1.00 �0.07 0.39�� 0.46�� 0.43�� �0.38�� �0.41�� �0.08 0.16 0.33� 0.30� 0.30� 0.24 0.23 �0.04 2. Stroop 1.00 �0.19 �0.19 �0.09 0.23 0.12 �0.21 0.15 �0.23 �0.11 �0.19 �0.07 0.00 0.13 3. Raven 1.00 0.56�� 0.44�� �0.34� �0.26� �0.13 0.10 0.50�� 0.31� 0.39�� 0.32� 0.21 0.18 4. Corsi 1.00 0.45�� �0.41�� �0.43�� 0.01 0.14 0.47�� 0.36�� 0.26 0.26 0.27� �0.04 5. n-back 1.00 �0.26 �0.19 �0.22 0.27� 0.23 0.07 0.09 0.27 0.16 0.07 6. Bf range 1.00 0.54�� �0.48�� 0.04 �0.39�� �0.26 �0.42�� 0.00 �0.17 �0.09 7. Bf dev 1.00 0.06 �0.24 �0.18 �0.26 �0.41�� �0.25 �0.19 �0.21 8. Bf disc 1.00 �0.33� 0.18 �0.09 �0.07 �0.25 �0.18 �0.22 9. Bf Check 1.00 �0.05 �0.02 0.09 0.13 0.14 0.03 10. Bf Tabl 1.00 0.33� 0.31� 0.19 0.06 �0.08 11. VWRE 1.00 0.59�� 0.55�� 0.60�� 0.32� 12. VWRT 1.00 0.44�� 0.39�� 0.26� 13. VWTC 1.00 0.49�� 0.21 14. VWIE 1.00 0.43�� 15. VWIT 1.00
  • 34. Note. DigSymb � Digit-symbol test; Bf � breakfast; dev � deviation; disc � discrepancy; Tabl � numbers of tables set; VW � virtual week; RE � regular event; RT � regular time; TC � time check; IE � irregular event; IT � irregular time. Stroop, Bf range, Bf deviation, and Bf discrepancy were log transformed due to nonnormal distributions. Significant correlations are bolded. � p � .05. �� p � .01. Table 7 Component Loadings for the EF and PM Measures Component Loading Measure EF PM Digit Symbol .72 — Stroop Effect �.30 — N-back .73 — Corsi blocks .82 — Ravens .79 — VW regular event — .85 VW irregular event — .80 VW regular time — .73 VW irregular time — .55 VW Time-check — .74 Note. VW � virtual week. Separate PCAs were done on the executive functions (EF) and prospective memory (PM) measures. 259COGNITIVE PROCESSES IN THE BREAKFAST TASK
  • 35. together this result suggests that superior EF is associated with better global planning and more efficient management of switch- ing between the two main goals in the Breakfast Task, namely, setting the table and cooking the foods. The PM component showed only one significant correlation—a negative relation to the deviation from ideal start time; participants who performed more accurately on the PM tasks were also more likely to start each food at an ideal time. Thus, the PM variables were also related to some degree to the first breakfast component shown in Table 2B. Table 8 also shows that the discrepancy in cooking times and the number of food checks did not correlate with either EF or PM. Inspection of the correlations in Table 6 reveals that discrepancy in cooking times correlated with number of food checks such that participants who checked the foods more often had a smaller discrepancy in cooking times. We have pre- viously suggested that this combination signals close monitoring of cooking times and good local planning. We then examined the correlations between the breakfast com- ponents and the common EF and PM composite factors (see Table 9). As suggested by the correlations on Table 8, the first Breakfast Task composite (BT1) correlated significantly with the EF com- posite but the second Breakfast Task factor (BT2) did not correlate with either the EF or the PM factor, and was also independent of
  • 36. BT1 (r � .07). Additionally, the EF and PM components were positively related, r � .37, p � .01. We can thus say that BT1 primarily reflects executive control, reasoning and working mem- ory functions (Digit-symbol, Stroop, Raven, Corsi, n-back). Given this set of relations and the make-up of BT1 (see Table 2) we interpret the BT1 factor as an indicator of global planning. Table 2 shows that BT2 relates strongly and consistently to number of food checks and to the discrepancy between ideal and actual cooking time—more checks result in smaller discrepancies. We interpret this second factor as an indicator of local planning and task completion that was, interestingly, unrelated to variation in executive functions and higher-level planning in this sample. Discussion In their initial description and analysis of the Breakfast Task, Craik and Bialystok (2006) concluded that the task provided measures of global and local planning abilities, and that in turn these abilities were related to individual differences in task switch- ing, working memory, and prospective memory. In general, the present study confirmed these conclusions with fuller supporting data, but with the major exception that little evidence was found for a prospective memory component in the Breakfast Task. This surprising finding is discussed later, but we first discuss the two components revealed consistently by the PCA and factor analyses shown in Table 2. These analyses revealed two separable components in breakfast
  • 37. measures, each supported by a small number of underlying cog- nitive processes. In both experiments, the first component received strong loadings from the range of stop times and deviation from ideal start times, and a smaller loading from number of table settings, reflecting participants’ efficiency to formulate a plan and switch between the two overall goals (Table 2A, B, C). Experiment 2 showed that this component was correlated with the EF compo- nent abstracted from the executive function measures (see Table 9). Specifically, the EF component correlated reliably with range of stop times, deviation from ideal start times and number of table settings accomplished (see Table 8). In contrast, the second com- ponent received strong loadings from a large number of food checks and the discrepancy from target cooking times, reflecting the ability to monitor cooking progress and stop cooking each food at the appropriate time. This component was independent of the first (see Table 9) and was also unrelated to both EF and PM composite factors (see Table 9). The two measures involved in this second component (checks and discrepancy) were also uncorre- lated with EF and PM composites (see Table 8). The second component thus appeared consistently in our three replications, but was also consistently unrelated both to other cooking mea- sures and to general cognitive activities. We have interpreted this measure as reflecting the efficiency of monitoring cooking progress and of stopping individual foods appropriately, but with less relation to the efficiency of overall planning. We also concede, however, that the second component may reflect fac-
  • 38. tors specific to performing the Breakfast Task. It remains to be seen whether individuals who score highly on this factor also show good local planning abilities on other tasks. The separation of the two Breakfast Task components is gener- ally consistent with the analyses by Burgess et al. (2000) and Logie et al. (2011), whose SEM analyses revealed a separation between planning, the extent to which an individual’s plan reflects the overall goal, and intent, the execution of the plan. Similarly, our breakfast measures reflected two separable components demon- strating planning and task execution, respectively. A critical fea- ture of the Breakfast Task is the need to constantly consult with, and revise one’s plan during execution. For example, if a food is Table 9 Correlations Among Factor Scores (Ns for Each Correlation in Brackets) EF PM BT1 BT2 EF 1.00 PM 0.37 (49) 1.00 BT1 0.44 (42) 0.24 (49) 1.00 BT2 0.16 (42) 0.19 (49) 0.07 (51) 1.00 Note. Correlations significant at p � .01 are printed in bold. EF � Factor score for executive functions; PM � Factor score for prospective memory; BT1 � Breakfast Task, first factor; BT2 � Breakfast Task,
  • 39. second factor. Table 8 Correlations Between the EF and PM Components and the Breakfast Measures Component EF PM Breakfast measure Number of table settings .55�� .23 Number of food checks .20 .10 Discrepancy cooking time �.18 �.21 Range of stop times �.45�� �.27 Deviation from ideal start time �.40�� �.36�� Note. EM � executive functions; PM � prospective memory. � p � .05. �� p � .01. 260 ROSE, LUO, BIALYSTOK, HERING, LAU, AND CRAIK started too early or too late, the participant must revise the cooking of subsequent foods accordingly to ensure that all foods will finish close together. Therefore, efficient performance of the Breakfast Task places a heavy load on maintaining and updating information in WM, particularly if the plan is weak or goes awry. Logie et al. (2011) also found that a measure of spatial WM predicted perfor-
  • 40. mance in a complex multitasking environment, in their case via a general memory factor. Logie and colleagues used deviation from ideal starting times from the Breakfast Task as a potential predictor of dual-task performance in their study, but found no significant relations between deviation scores and other variables, including measures of WM. For unknown reasons this result differs from the present findings, where deviation correlated significantly with Digit-symbol, Raven’s and the Corsi WM task (see Table 6). In addition to a participant’s cognitive ability, various features of the particular task conditions will influence the need for more con- trolled, strategic processing as opposed to a reliance on more spontaneous, automatic processing (McDaniel & Einstein, 2000; Rose et al., 2010). The PCA used in Experiment 1 and the factor analyses used in Experiment 2 yielded two components that were associated with distinct underlying individual differences. As discussed previ- ously, the first component is related to strong WM and EF abilities. The second component, with its pattern of many food checks and resultant small discrepancies between target and actual cooking times, suggests an ability that focuses on specific, local aspects of the task, with less attention paid to the overall pattern of perfor- mance. Parkinson’s patients have a tendency to focus on one aspect of a task while neglecting other aspects (Gauntlett- Gilbert, Roberts, & Brown, 1999), and in a previous study we found that patients with mild Parkinson’s disease showed significantly
  • 41. smaller discrepancies in cooking times on the Breakfast Task than age-matched controls, at the expense of setting fewer tables (Bialystok et al., 2008). Thus, the second component may reflect an ability that is effective for single focused tasks but is less appropriate when tasks require attention to multiple components. One surprising finding in the present study was the absence of a relationship between Breakfast Task components and measures of prospective memory. Successful completion of the six-screen version of the Breakfast Task requires timely switching between table-setting and cooking the various foods; for this reason it seemed that efficient starting and stopping cooking operations should make heavy demands on PM (Craik & Bialystok, 2006). Several factors may have contributed to this unexpected result. The first is that PM is assessed by only one other task—Virtual Week—and it is possible that the type of PM measured by Virtual Week (where required actions are mostly cued by times on the board or by specific event cards) is different from the uncued PM operations required by the Breakfast Task. In this sense, the Breakfast Task requires more “self-initiated activity” than does Virtual Week, and such activities are often central to PM (Craik, 1983). Further, Table 6 shows that of the 25 correlations between the five Virtual Week measures and the five Breakfast Task measures, one was a zero correlation and 22/24 of the remainder were positive in the sense that Virtual Week measures tended to relate to a large number of food checks and tables set, and to small values of range, discrepancy and deviation. Additionally, the
  • 42. over- all PM component correlated positively (although not signifi- cantly) with both BT components (see Table 9), so it is perhaps fair to conclude that the Breakfast Task does exhibit some aspects of prospective memory as measured by the Virtual Week task. An- other possibility is that the Breakfast Task does not in fact provide a good method for assessing differences in PM. Recall that par- ticipants must switch between starting and stopping foods on the one hand and table-setting on the other, at intervals ranging be- tween 30 sec and 2 min at most. Additionally, the fact that food checks may be carried out at any time further reduces the intervals between cooking operations and setting the table. So the require- ment to “switch soon” is presumably kept in mind rather con- stantly as a person performs the Breakfast Task, and the need to retrieve a PM intention from outside current awareness is quite small. Overall then, we conclude that the Breakfast Task provides estimates of both global planning (BT1) and local monitoring and task execution (BT2), but may also tap aspects of prospective memory. What do these results tell us about the cognitive structure of complex planning behaviour? Perhaps the clearest conclusion is that planning is indeed not a unitary construct (Burgess et al., 2000, 2005; Craik & Bialystok, 2006; Logie et al., 2011). Our data showed not only that planning performance on the Breakfast Task
  • 43. is supported by multiple cognitive processes, but also that it can be separated into two major components, each of which is supported by a different set of processes. Nonetheless, our data show some promise for the identification of common patterns across different types of planning tasks. First, our breakfast measures showed a structure with separable components reflecting overall planning efficiency and subtask management. Such a distinction is in line with the one between “plan” and “intentionality” suggested by Burgess et al. (2000) and by Logie et al. (2011), and is also consistent with the suggestion that optimal outcome depends on both efficient planning and successful execution. This suggests that future assessments of this nature should employ a framework that includes both planning efficiency (how well the plans are generated and revised to reflect the overall goal) and task- management (how effectively people handle multiple subtasks and achieve subgoals). Second, many have proposed that WM plays an important role in generating, accessing, and revising plans (e.g., Cohen, 1996; Gilhooly, 2005; Owen, 1997). Our data, along with other behav- ioural evidence (Gilhooly, Wynn, Phillips, Logie, & Della Sala, 2002; Logie, Trawley, & Law, 2011; Phillips, Wynn, Gilhooly, Della Sala, & Logie, 1999), is confirmatory of a relationship between planning efficiency and aspects of WM functioning, de- spite great variety in the methods of assessment. Different tasks may correlate with different WM measures; for example, visual tasks such as Tower tasks engage mainly visuospatial WM (Gilhooly et al., 2002). Errand tasks have many complex rules to remember and a map to navigate, and so load heavily on both
  • 44. verbal and visuospatial WM capacity (Logie et al., 2011). In our case, the individual correlations shown in Table 6 reveal that the relation between the EF composite measure and BT1 (table setting, range and deviation) is largely due to correlations with visuospatial WM (Corsi test) as well as with Digit Symbol and Raven’s matrices. Although precise relationships remain to be specified, our suggestion is that WM as a general function of holding and manipulating information in mind, presumably contributes to a wide range of planning and multitask manage- ment activities. 261COGNITIVE PROCESSES IN THE BREAKFAST TASK What are the implications of the present results for the use of the Breakfast Task as a means of assessing capabilities and deficits in planning and monitoring behaviour in everyday life? The Break- fast Task has the advantage of simulating an everyday activity that participants readily understand; they also find the task engaging and enjoyable to perform. One major contribution of the present results is the demonstration of the task’s stable factor structure (Table 2A, B, C); this point enables the Breakfast Task to assess global planning and local monitoring separately. An initial indi- cation of such an assessment application is given by a case study describing an individual who had moderately severe problems in prospective memory, attributed to a deficit in strategic monitoring (West et al., 2007). In performing the Breakfast Task this person made fewer food checks and had larger discrepancies in cooking times relative to a reference group, in line with the idea that she
  • 45. has a specific impairment in local monitoring. Her performance on other Breakfast Task measures was normal. A recent study by Tanguay, Davidson, Guerrero Nuñez, and Ferland (2014) tested 22 patients with acquired brain injury and 22 controls on the Break- fast Task, and found that the patients scored substantially lower on all measures. The authors also had patients cook a real meal, with the finding that patients’ own assessment of their cooking ability correlated significantly with overall performance on the Breakfast Task, although clinicians’ assessments of the patients’ real-meal cooking skills did not correlate with the computer task. One possibility here is that well-practiced skills, such as cooking a meal, involve semiautomated routines that do not require on- the- spot planning and decision-making, and therefore do not tap the more “fluid intelligence” aspects needed to perform a novel com- plex task. We have also shown that the Breakfast Task is sensitive to normal aging; older adults performed less efficiently on all five Breakfast Task measures compared to younger adults (Craik & Bialystok, 2006). As mentioned previously, Parkinson’s patients performed well on local monitoring but less well on overall plan- ning measures (Bialystok et al., 2008). Finally, we have shown that older bilingual participants are significantly superior to monolin- gual counterparts at switching appropriately between table-
  • 46. setting and cooking operations (Craik & Bialystok, 2006). In overview, evidence for the relation between the Breakfast Task and real- life planning abilities is still scanty, and one difficulty in this regard may be that all tasks, both lab-based and in real life, require a combination of abilities that is rather specific to each task. How- ever, we are hopeful that the Breakfast Task has the potential to assess two components of planning, and to provide independent measures of these components. In summary, this article reported a study whose purpose was to assess and interpret measures from the Breakfast Task, a labora- tory task designed to provide measures of planning, working memory, and task switching. The task involves rules and serial steps that reflect those required in real life meal preparation, and is therefore ecologically valid. The main outcome measures are RTs and proportions that may be applied to a wide range of populations and may be sensitive to various neuropsychological impairments. The present study clarifies the links between Breakfast Task mea- sures on the one hand and higher cognitive processes such as WM, processing speed, reasoning, monitoring, and task switching on the other. The results thus provide guidelines for assessments of these processes in ecologically valid settings, and the task itself provides
  • 47. a means for an enjoyable and engaging assessment of everyday planning behaviour. Résumé La Breakfast Task (Craik & Bialystok, 2006) est une tâche infor- matisée qui simule la planification et la surveillance des préparatifs d’un petit-déjeuner, une tâche quotidienne importante pour l’autonomie fonctionnelle. Dans l’Expérience 1, on a demandé à 28 adultes de réaliser la Breakfast Task, et les mesures obtenues ont été soumises à une analyse en composantes principales en vue de déterminer la structure des processus cognitifs impliqués. L’analyse a révélé une structure à deux composantes, qui com- prendrait la planification globale et des capacités de contrôle local. Dans l’Expérience 2, on a procédé à une validation croisée de la structure du rendement à la Breakfast Task au moyen d’un nouvel échantillon de 59 adultes plus vieux, en santé, à qui on a aussi demandé de réaliser des tests évaluant la mémoire de travail, la vitesse de traitement, l’inhibition, le raisonnement et la mémoire prospective. L’analyse factorielle a révélé que le volet de planifi- cation globale dans le cadre de la Breakfast Task était fortement corrélé avec des différences individuelles dans les fonctions exécu- tives, mais que le volet de contrôle local était indépendant de ces fonctions. La Breakfast Task constitue un outil de d’évaluation rapide, agréable et réaliste de la planification complexe au quoti- dien et de la surveillance ainsi que de leurs processus sous-
  • 48. jacents, tels que la mémoire de travail et les fonctions exécutives. Mots-clés : planification, contrôle, mémoire de travail, mémoire prospective, processus exécutifs. References Bialystok, E., Craik, F. I. M., & Stefurak, T. (2008). Planning and task management in Parkinson’s disease: Differential emphasis in dual-task performance. Journal of the International Neuropsychological Society, 14, 257–265. http://dx.doi.org/10.1017/S1355617708080296 Brandt, J., Spencer, M., & Folstein, M. (1988). The telephone interview for cognitive status. Neuropsychiatry, Neuropsychology, and Behavioral Neurology, 1, 111–117. Burgess, P. W., Simons, J. S., Coates, L. M.-A., & Channon, S. (2005). The search for specific planning processes. In R. Morris & G. Ward (Eds.), The cognitive psychology of planning (pp. 199–227). New York, NY: Psychology Press. Burgess, P. W., Veitch, E., de Lacy Costello, A., & Shallice, T. (2000). The cognitive and neuroanatomical correlates of multitasking. Neuropsycho- logia, 38, 848–863. http://dx.doi.org/10.1016/S0028- 3932(99)00134-7
  • 49. Cohen, G. (1996). Memory in the real world (2nd ed.). Hove, UK: Psy- chology Press. Craik, F. I. M. (1983). On the transfer of information from temporary to permanent memory. Philosophical Transactions of the Royal Society of London Series B, Biological Sciences, 301, 341–359. http://dx.doi.org/ 10.1098/rstb.1983.0059 Craik, F. I. M., & Bialystok, E. (2006). Planning and task management in older adults: Cooking breakfast. Memory & Cognition, 34, 1236–1249. http://dx.doi.org/10.3758/BF03193268 Desmond, D. W., Tatemichi, T. K., & Hanzawa, L. (1994). The telephone interview for cognitive status (TICS): Reliability and validity in a stroke sample. International Journal of Geriatric Psychiatry, 9, 803– 807. http://dx.doi.org/10.1002/gps.930091006 Gauntlett-Gilbert, J., Roberts, R. C., & Brown, V. J. (1999). Mechanisms underlying attentional set-shifting in Parkinson’s disease. Neuropsycho- logia, 37, 605–616. http://dx.doi.org/10.1016/S0028- 3932(98)00049-9 262 ROSE, LUO, BIALYSTOK, HERING, LAU, AND CRAIK
  • 50. Gilhooly, K. J. (2005). Working memory and planning. In R. Morris & G. Ward (Eds.), The cognitive psychology of planning (pp. 71–88). New York, NY: Psychology Press. Gilhooly, K. J., Wynn, V., Phillips, L. H., Logie, R. H., & Della Sala, S. (2002). Visuo-spatial and verbal working memory in the five- disc Tower of London task: An individual differences approach. Thinking & Rea- soning, 8, 165–178. http://dx.doi.org/10.1080/13546780244000006 Kerr, S. (1991). Prospective memory, aging, and lapses of intention. Unpublished master’s thesis, University of Toronto, Toronto, Canada. Logie, R. H., Trawley, S., & Law, A. (2011). Multitasking: Multiple, domain-specific cognitive functions in a virtual environment. Memory & Cognition, 39, 1561–1574. http://dx.doi.org/10.3758/s13421- 011- 0120-1 McDaniel, M. A., & Einstein, G. O. (2000). Strategic and automatic processes in prospective memory retrieval: A multiprocess framework. Applied Cognitive Psychology, 14, S127–S144. http://dx.doi.org/
  • 51. 10.1002/acp.775 Milner, B. (1971). Interhemispheric differences in the localization of psychological processes in man. British Medical Bulletin, 27, 272–277. Morris, R., & Ward, G. (Eds.). (2005). The cognitive psychology of planning. New York: Psychology Press. Owen, A. M. (1997). Cognitive planning in humans: Neuropsychological, neuroanatomical and neuropharmacological perspectives. Progress in Neurobiology, 53, 431– 450. http://dx.doi.org/10.1016/S0301- 0082(97)00042-7 Owen, A. M. (2005). Cognitive planning in humans: New insights from the Tower of London (TOL) task. In R. Morris & G. Ward (Eds.), The cognitive psychology of planning (pp. 135–151). New York, NY: Psy- chology Press. Phillips, L. H., Wynn, V., Gilhooly, K. J., Della Sala, S., & Logie, R. H. (1999). The role of memory in the Tower of London task. Memory, 7, 209–231. http://dx.doi.org/10.1080/741944066 Raven, J. C., Court, J. H., & Raven, J. (1996). Manual for Raven’s Progressive Matrices and Mill Hill Vocabulary Scales. Oxford, UK:
  • 52. Oxford Psychologists Press. Rendell, P. G., & Craik, F. I. M. (2000). Virtual Week and actual week: Age-related differences in prospective memory. Applied Cognitive Psy- chology, 14, S43–S62. http://dx.doi.org/10.1002/acp.770 Rendell, P. G., & Henry, J. D. (2009). A review of Virtual Week for prospective memory assessment: Clinical implications. Brain Impair- ment, 10, 14–22. http://dx.doi.org/10.1375/brim.10.1.14 Rose, N. S., Rendell, P. G., McDaniel, M. A., Aberle, I., & Kliegel, M. (2010). Age and individual differences in prospective memory during a “Virtual Week”: The roles of working memory, vigilance, task regular- ity, and cue focality. Psychology and Aging, 25, 595–605. http://dx.doi .org/10.1037/a0019771 Stroop, J. R. (1935). Studies of interference in serial verbal reactions. Journal of Experimental Psychology, 18, 643–662. http://dx.doi.org/ 10.1037/h0054651 Tanguay, A. N., Davidson, P. S. R., Guerrero Nuñez, K. V., & Ferland, M. B. (2014). Cooking breakfast after a brain injury. Frontiers in Behavioral Neuroscience, 8, 272. http://dx.doi.org/10.3389/fnbeh.2014
  • 53. .00272 Ward, G., & Morris, R. (2005). Introduction to the psychology of planning. In R. Morris & G. Ward (Eds.), The cognitive psychology of planning (pp. 1–34). New York, NY: Psychology Press. Wechsler, D. (1997). Wechsler Adult Intelligence Scale (3rd ed.). San Antonio, TX: Harcourt Assessment. West, R., McNerney, M. W., & Krauss, I. (2007). Impaired strategic monitoring as the locus of a focal prospective memory deficit. Neuro- case, 13, 115–126. http://dx.doi.org/10.1080/13554790701399247 Zachary, R. A. (1986). Shipley Institute of Living Scale: Revised manual. Los Angeles, CA: Western Psychological Services. Received October 25, 2014 Accepted March 16, 2015 � 263COGNITIVE PROCESSES IN THE BREAKFAST TASK Describe at least three ways that factors in the external environment influence employee behavior. If you were an HRD professional involved with an action team that was charged with evaluating the likely success of a proposed downsizing of your organization, what factors would you want to consider in making this recommendation? That is, based on what you know of HRD to this point, how can HRD professionals impact the
  • 54. likely success or failure of this action? External factors that affect the employees’ behavior are: • Economic factor: If the economy is booming and employees have plenty of jobs, then the behaviour at the work would be overall happier. On the contrary, there will be fear and anxiousness among employees if the economy is facing recession. That anxiety leads to lower productivity and hamper employee performance. • Technological factor: Day by day advancement in the technology made employees feel regressive and less motivated. Employees resist changing and avoiding learning new things. To avoid this situation, a manager should impart timely updated training to employees. • Competition in Industry: Increased competition within an industry may raise questions on the survival of the company which leads to frustration and less motivated employees. However, employees feel motivated in a stable industry where it is easy to attract customers. Explain the role that trainability plays in the effectiveness of an HRD program or intervention. Briefly describe the options available to assess the trainability of employees. Following are the roles of the trainability in the effectiveness of an HRD intervention: • The foremost role of the trainability is to place the trained employees who are self-motivated so they can perform well without wastage of time and resources. • Another role of trainability in the effectiveness of an HRD program is to increase the numbers of trainees who take less time in the training period or whom company have to incur less expense.