Education Future 2022 Infographic
•
0 likes•17 views

Equipping students for the new world of work 2022 infographic by McCrindle Research

Recommended
More Related Content
Similar to Education Future 2022 Infographic
Similar to Education Future 2022 Infographic (20)
More from Mark McCrindle
More from Mark McCrindle (20)
Recently uploaded
Recently uploaded (20)
Education Future 2022 Infographic
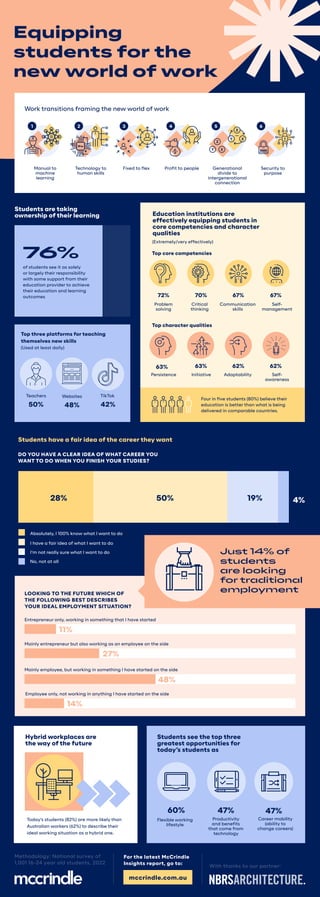
- 1. Manual to machine learning Technology to human skills Fixed to flex Profit to people Generational divide to intergenerational connection Security to purpose Problem solving 72% 63% 70% 63% 67% 62% 67% 62% Persistence Critical thinking e v i t a i t i n I Communication skills y t i l i b a t p a d A Self- management Self- awareness of students see it as solely or largely their responsibility with some support from their education provider to achieve their education and learning outcomes Work transitions framing the new world of work Students are taking ownership of their learning Education institutions are effectively equipping students in core competencies and character qualities Top three platforms for teaching themselves new skills Top core competencies Top character qualities (Extremely/very effectively) (Used at least daily) Teachers 50% 76% Websites 48% TikTok 42% Four in five students (80%) believe their education is better than what is being delivered in comparable countries. 1 2 3 4 5 6 Equipping students for the new world of work Today’s students (82%) are more likely than Australian workers (62%) to describe their ideal working situation as a hybrid one. Students have a fair idea of the career they want Hybrid workplaces are the way of the future Students see the top three greatest opportunities for today’s students as DO YOU HAVE A CLEAR IDEA OF WHAT CAREER YOU WANT TO DO WHEN YOU FINISH YOUR STUDIES? LOOKING TO THE FUTURE WHICH OF THE FOLLOWING BEST DESCRIBES YOUR IDEAL EMPLOYMENT SITUATION? Entrepreneur only, working in something that I have started Flexible working lifestyle Productivity and benefits that come from technology Career mobility (ability to change careers) Mainly entrepreneur but also working as an employee on the side Mainly employee, but working in something I have started on the side Employee only, not working in anything I have started on the side Just 14% of students are looking for traditional employment 11% 27% 48% 14% 60% 47% 47% Absolutely, I 100% know what I want to do I have a fair idea of what I want to do I'm not really sure what I want to do No, not at all 28% 19% 4% 50% With thanks to our partner: For the latest McCrindle Insights report, go to: mccrindle.com.au Methodology: National survey of 1,001 16-24 year old students, 2022