Download to read offline


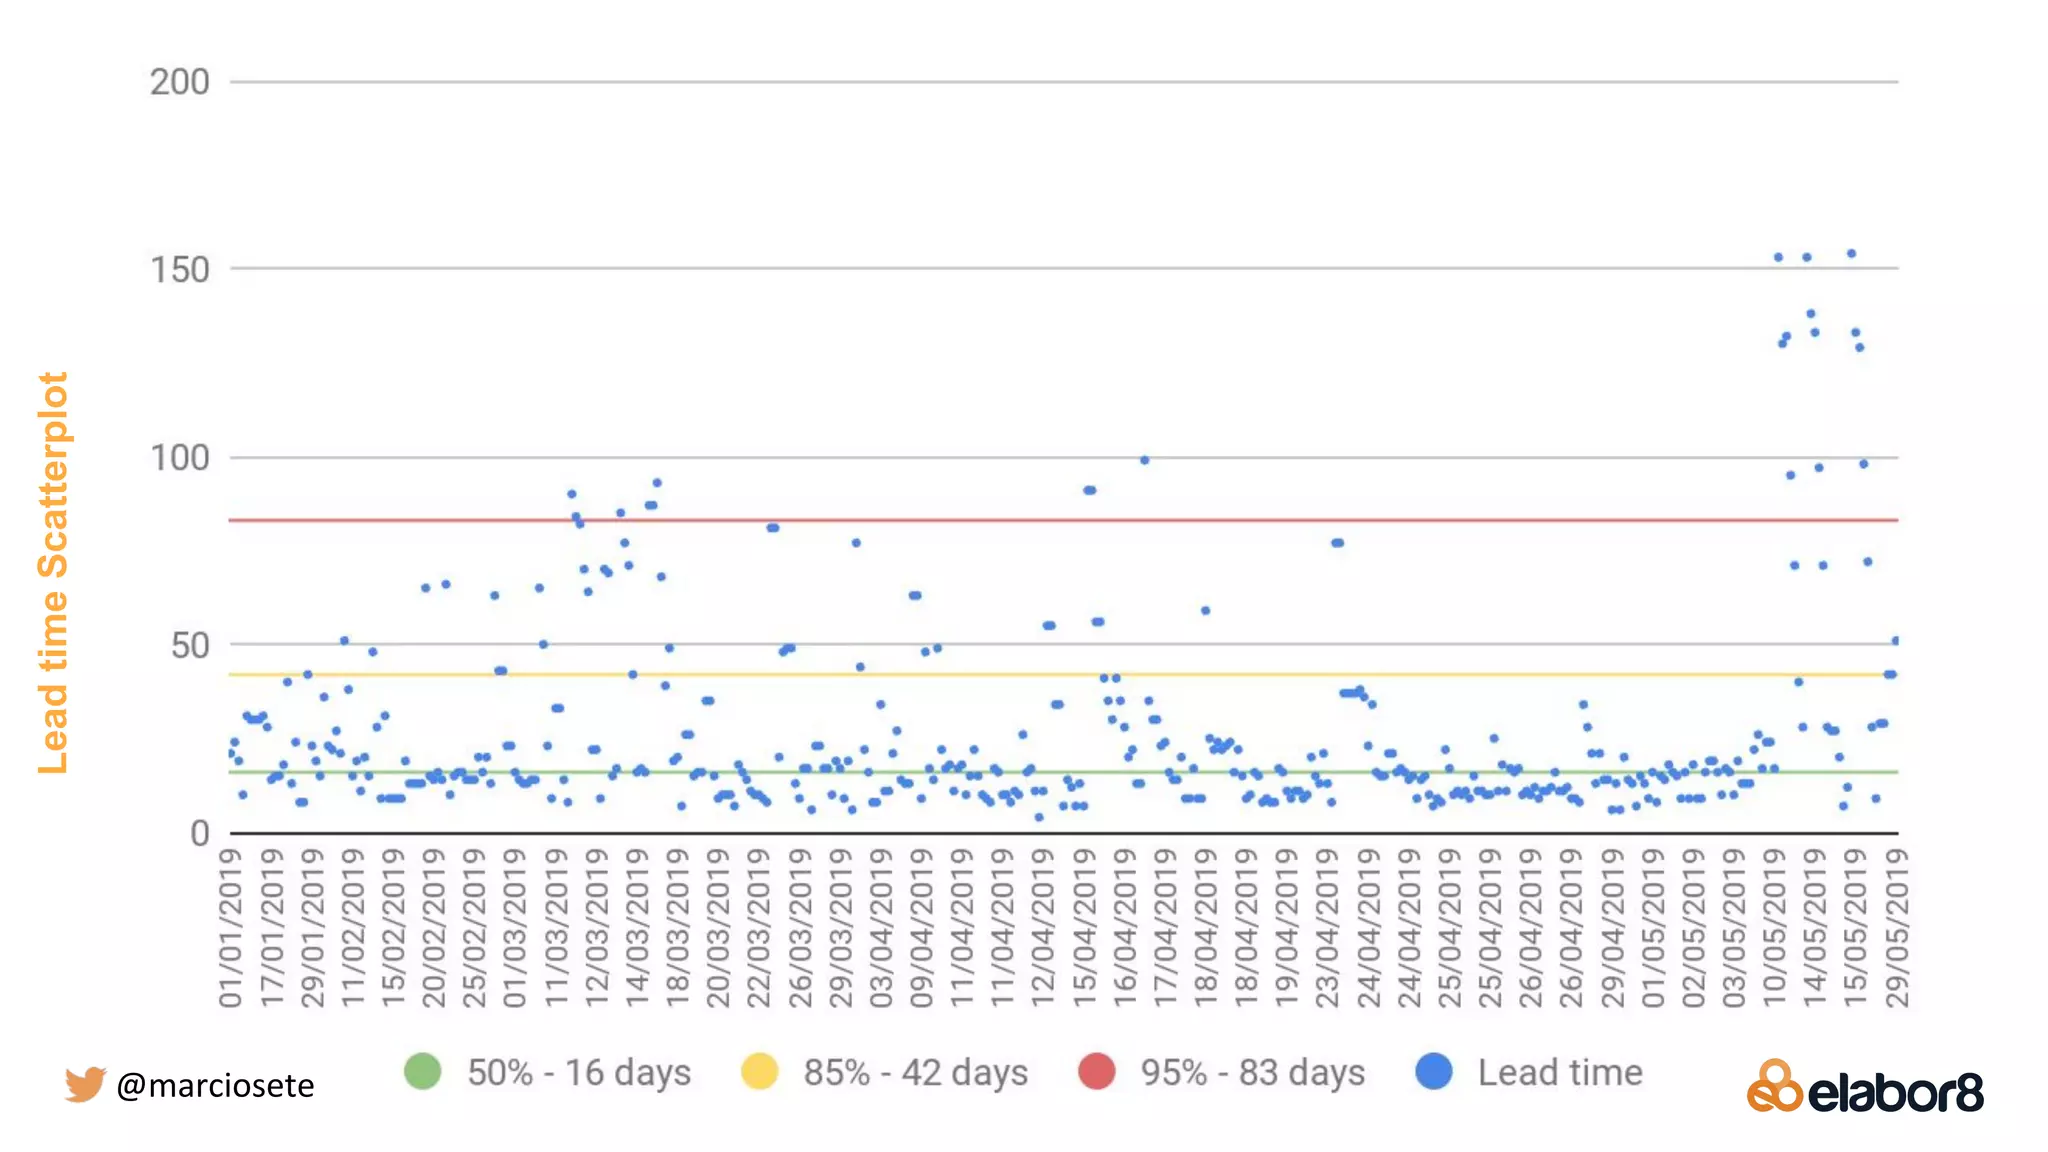
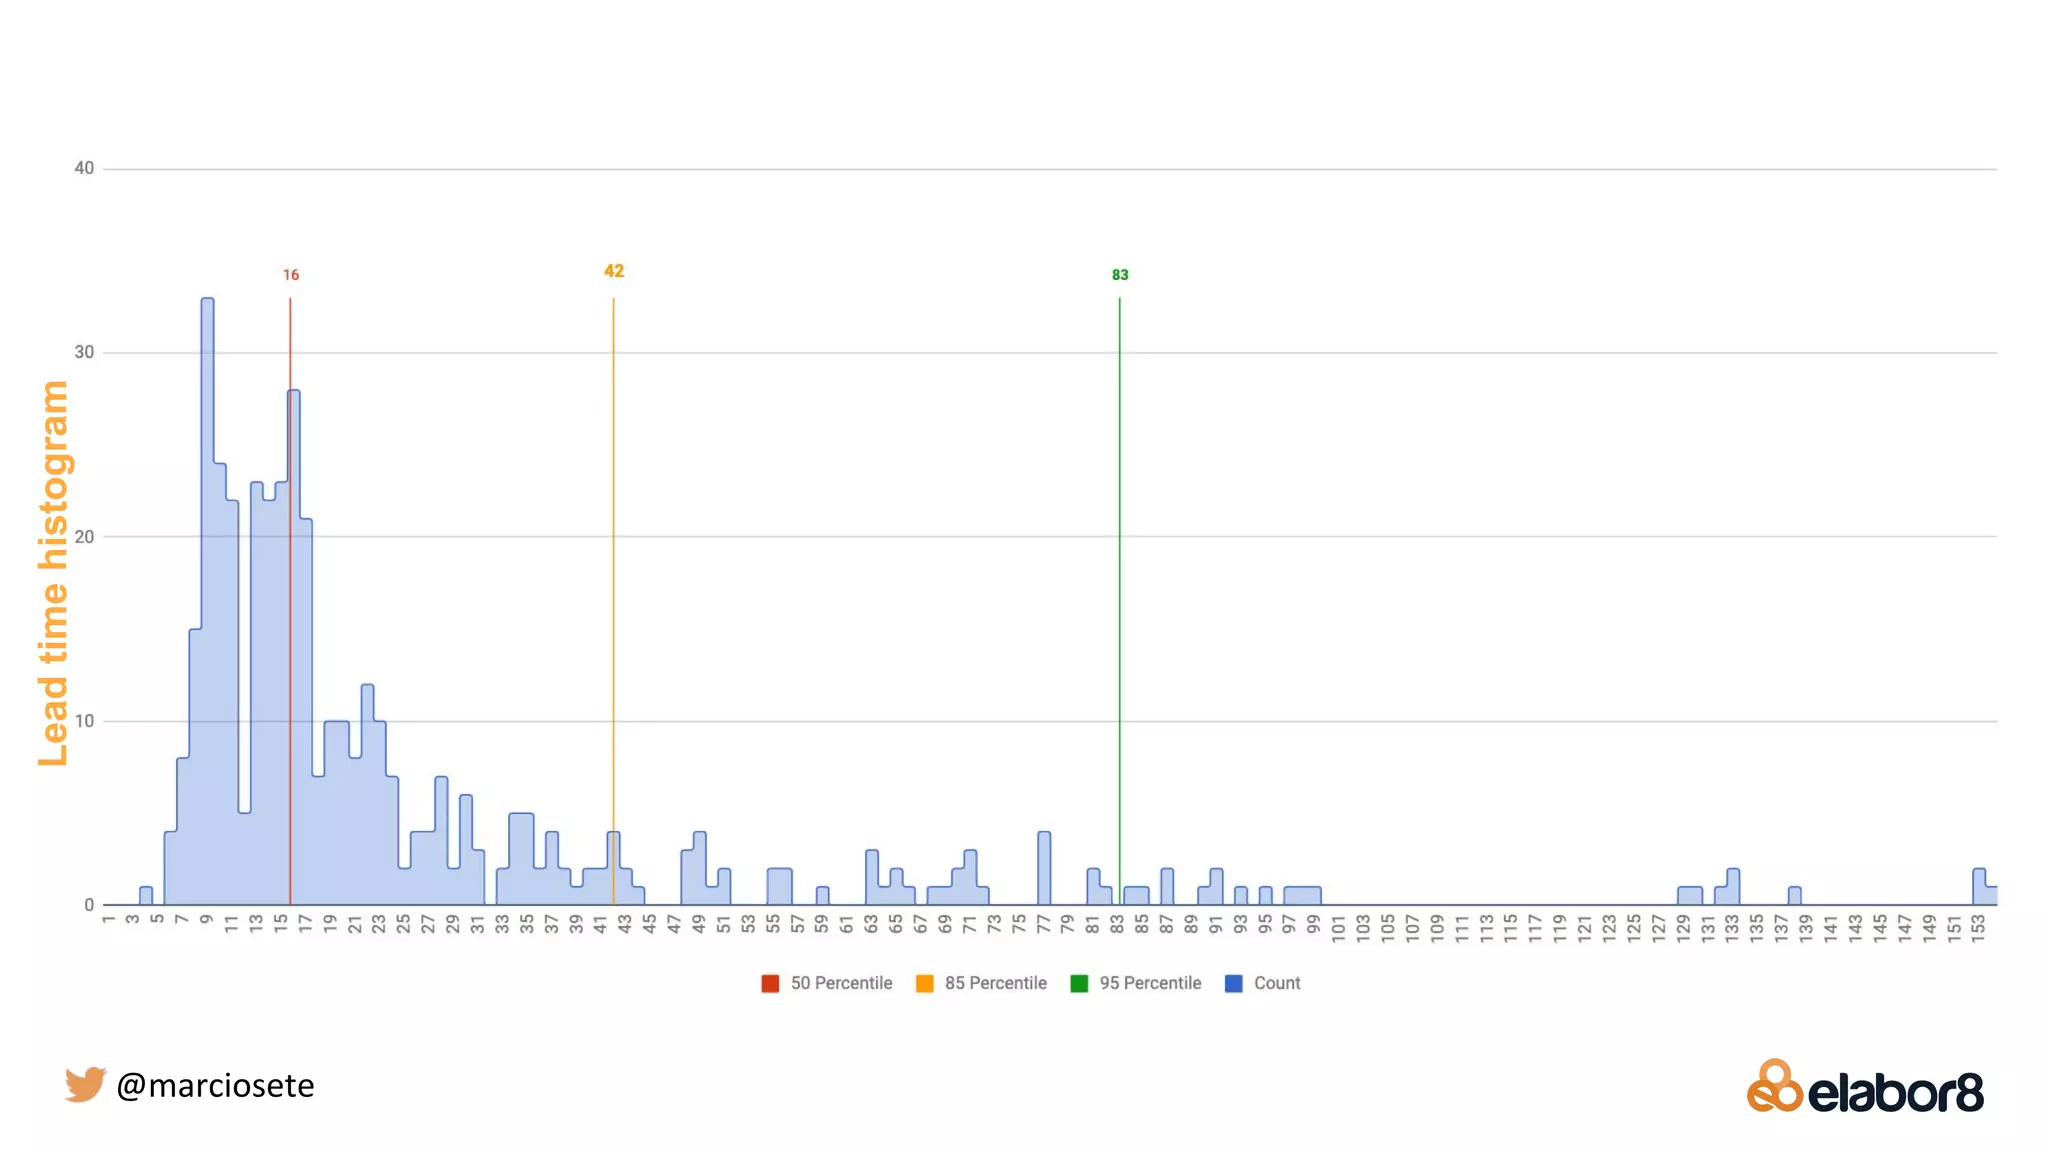

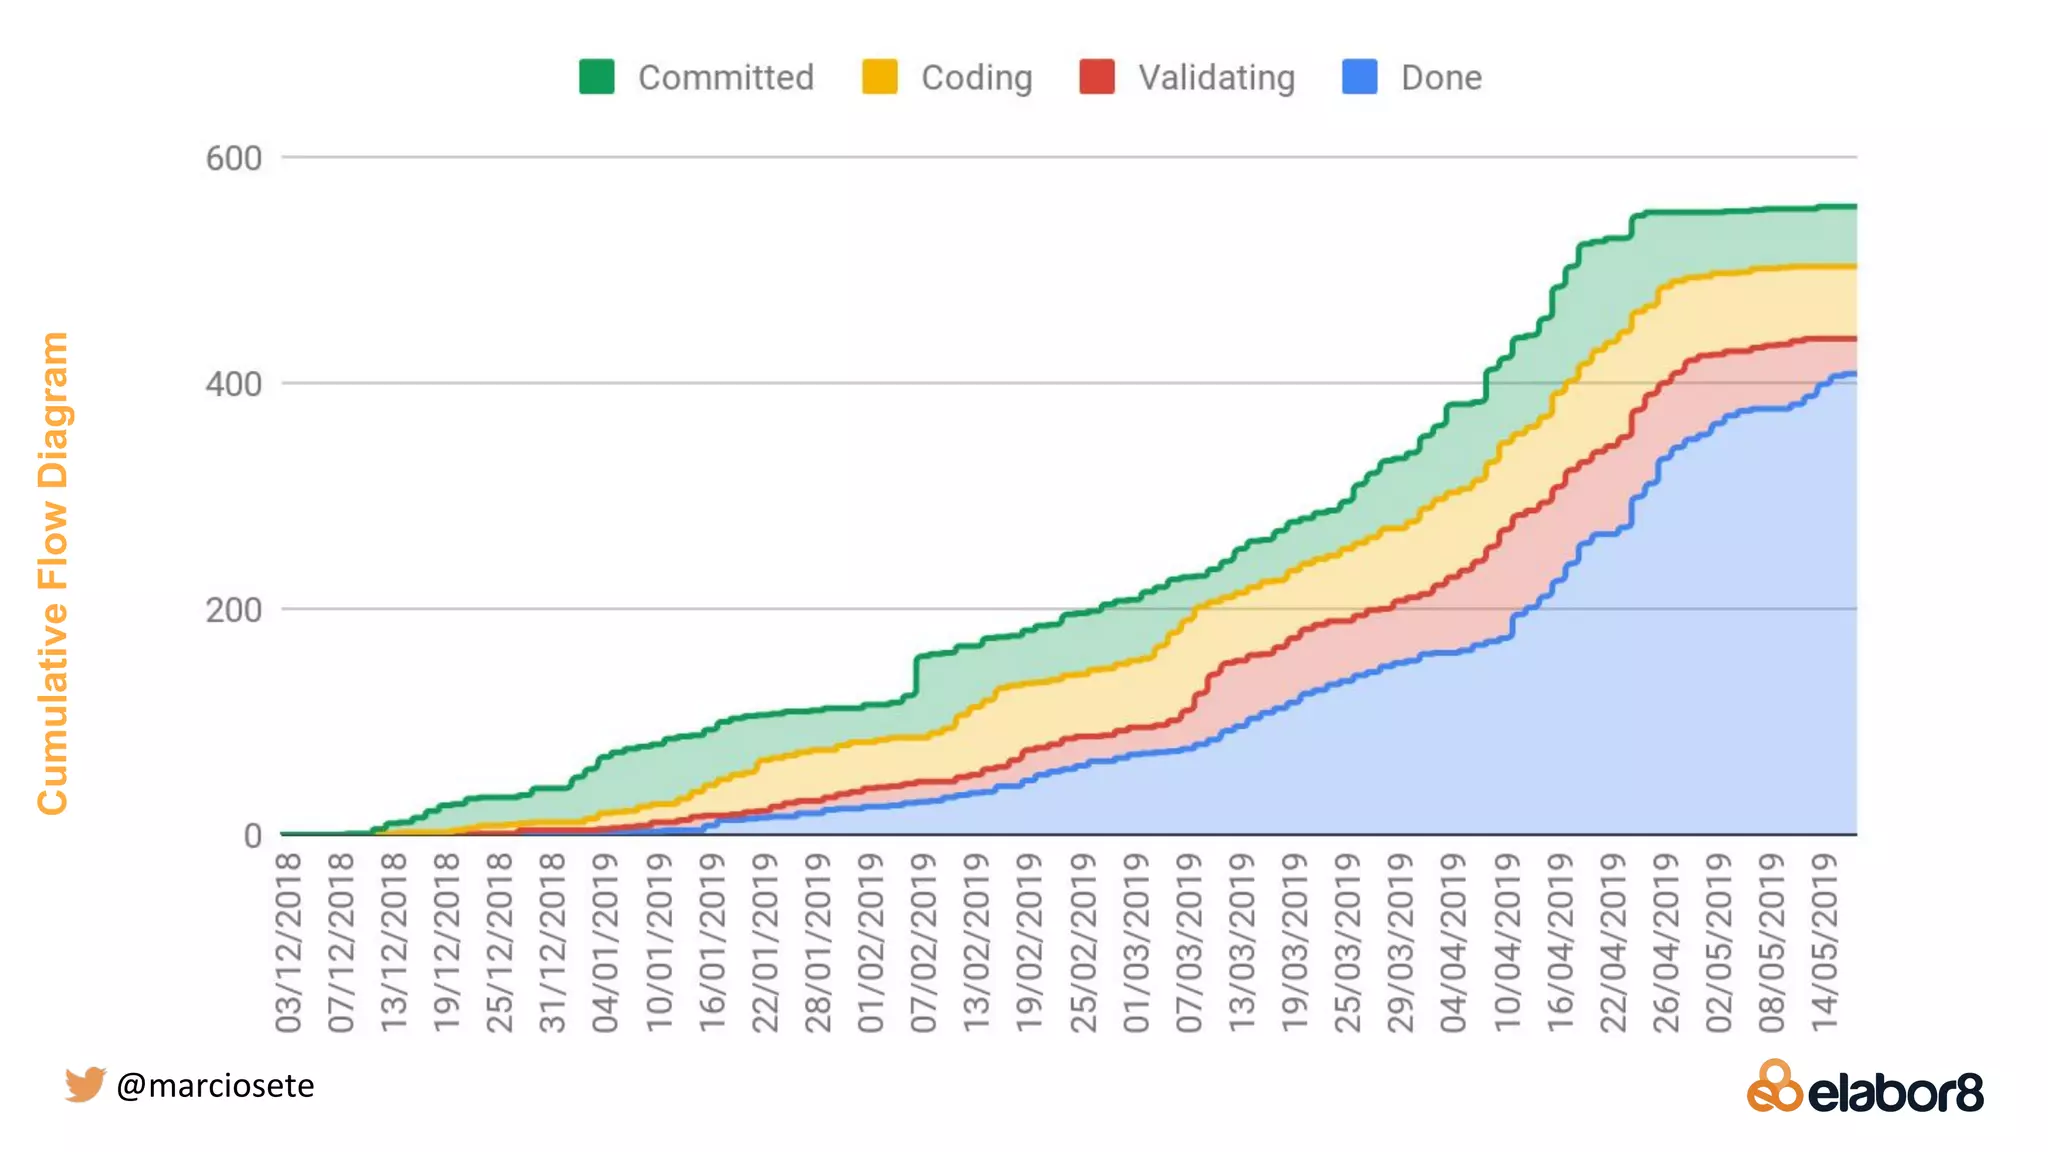
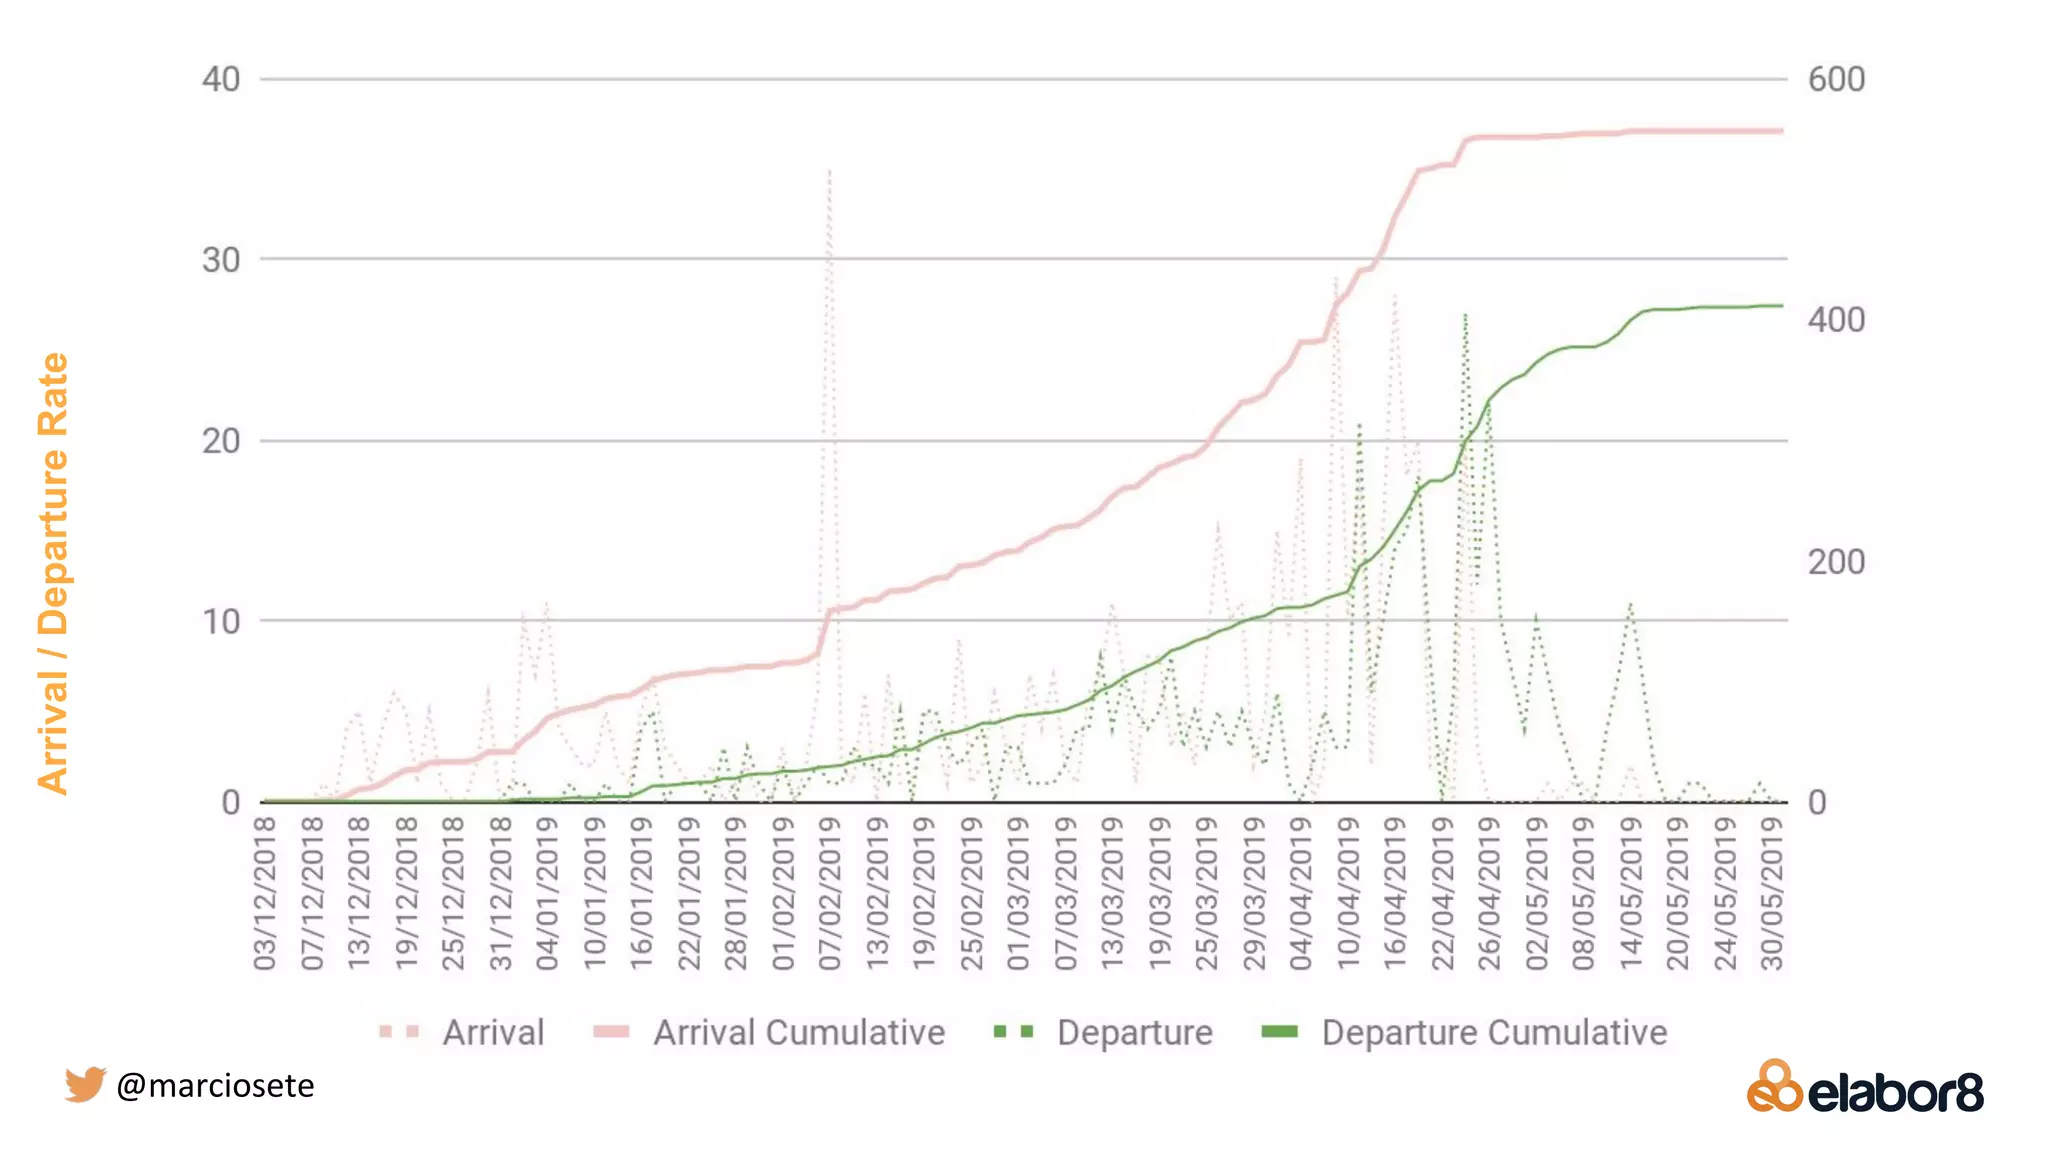
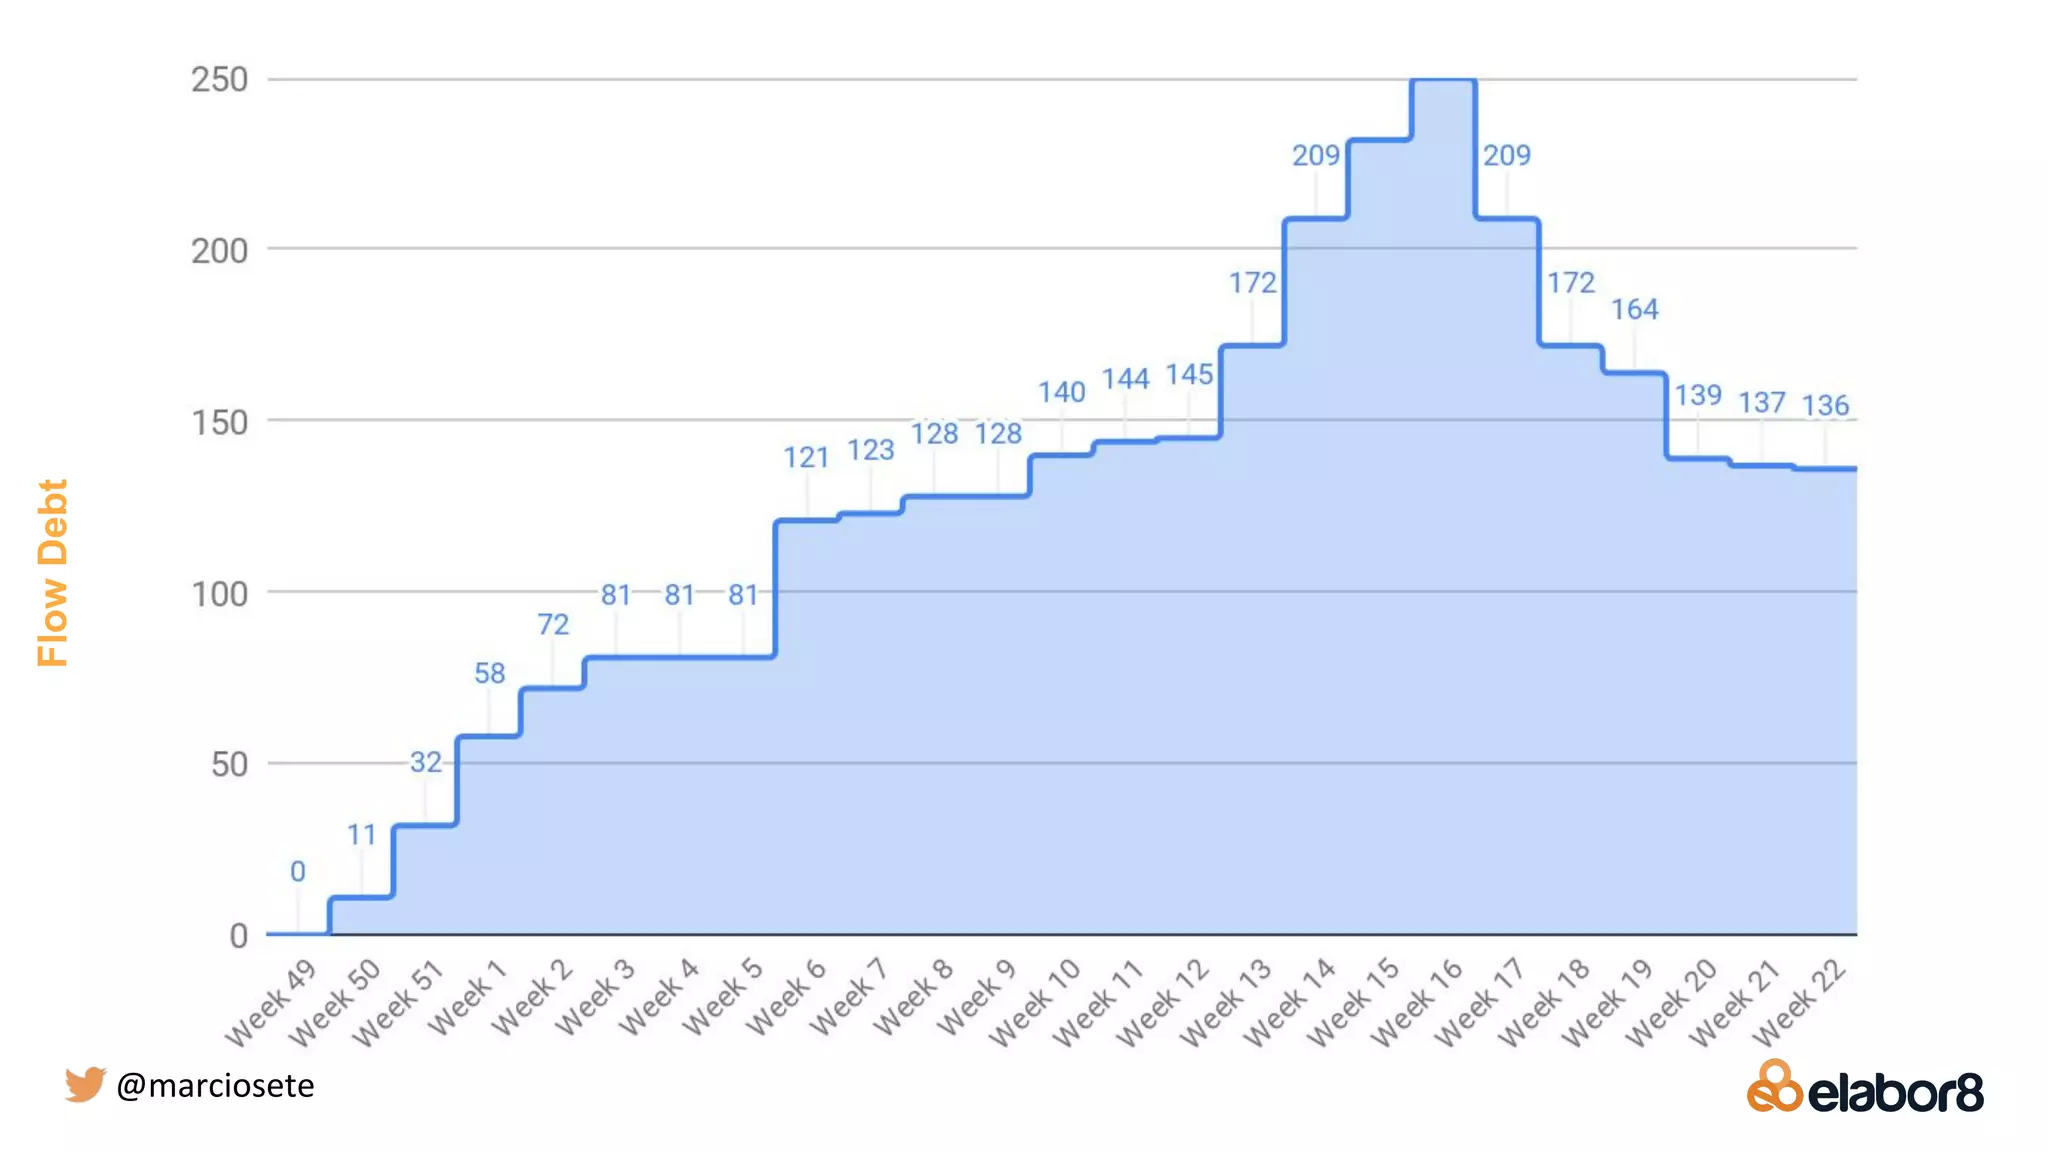
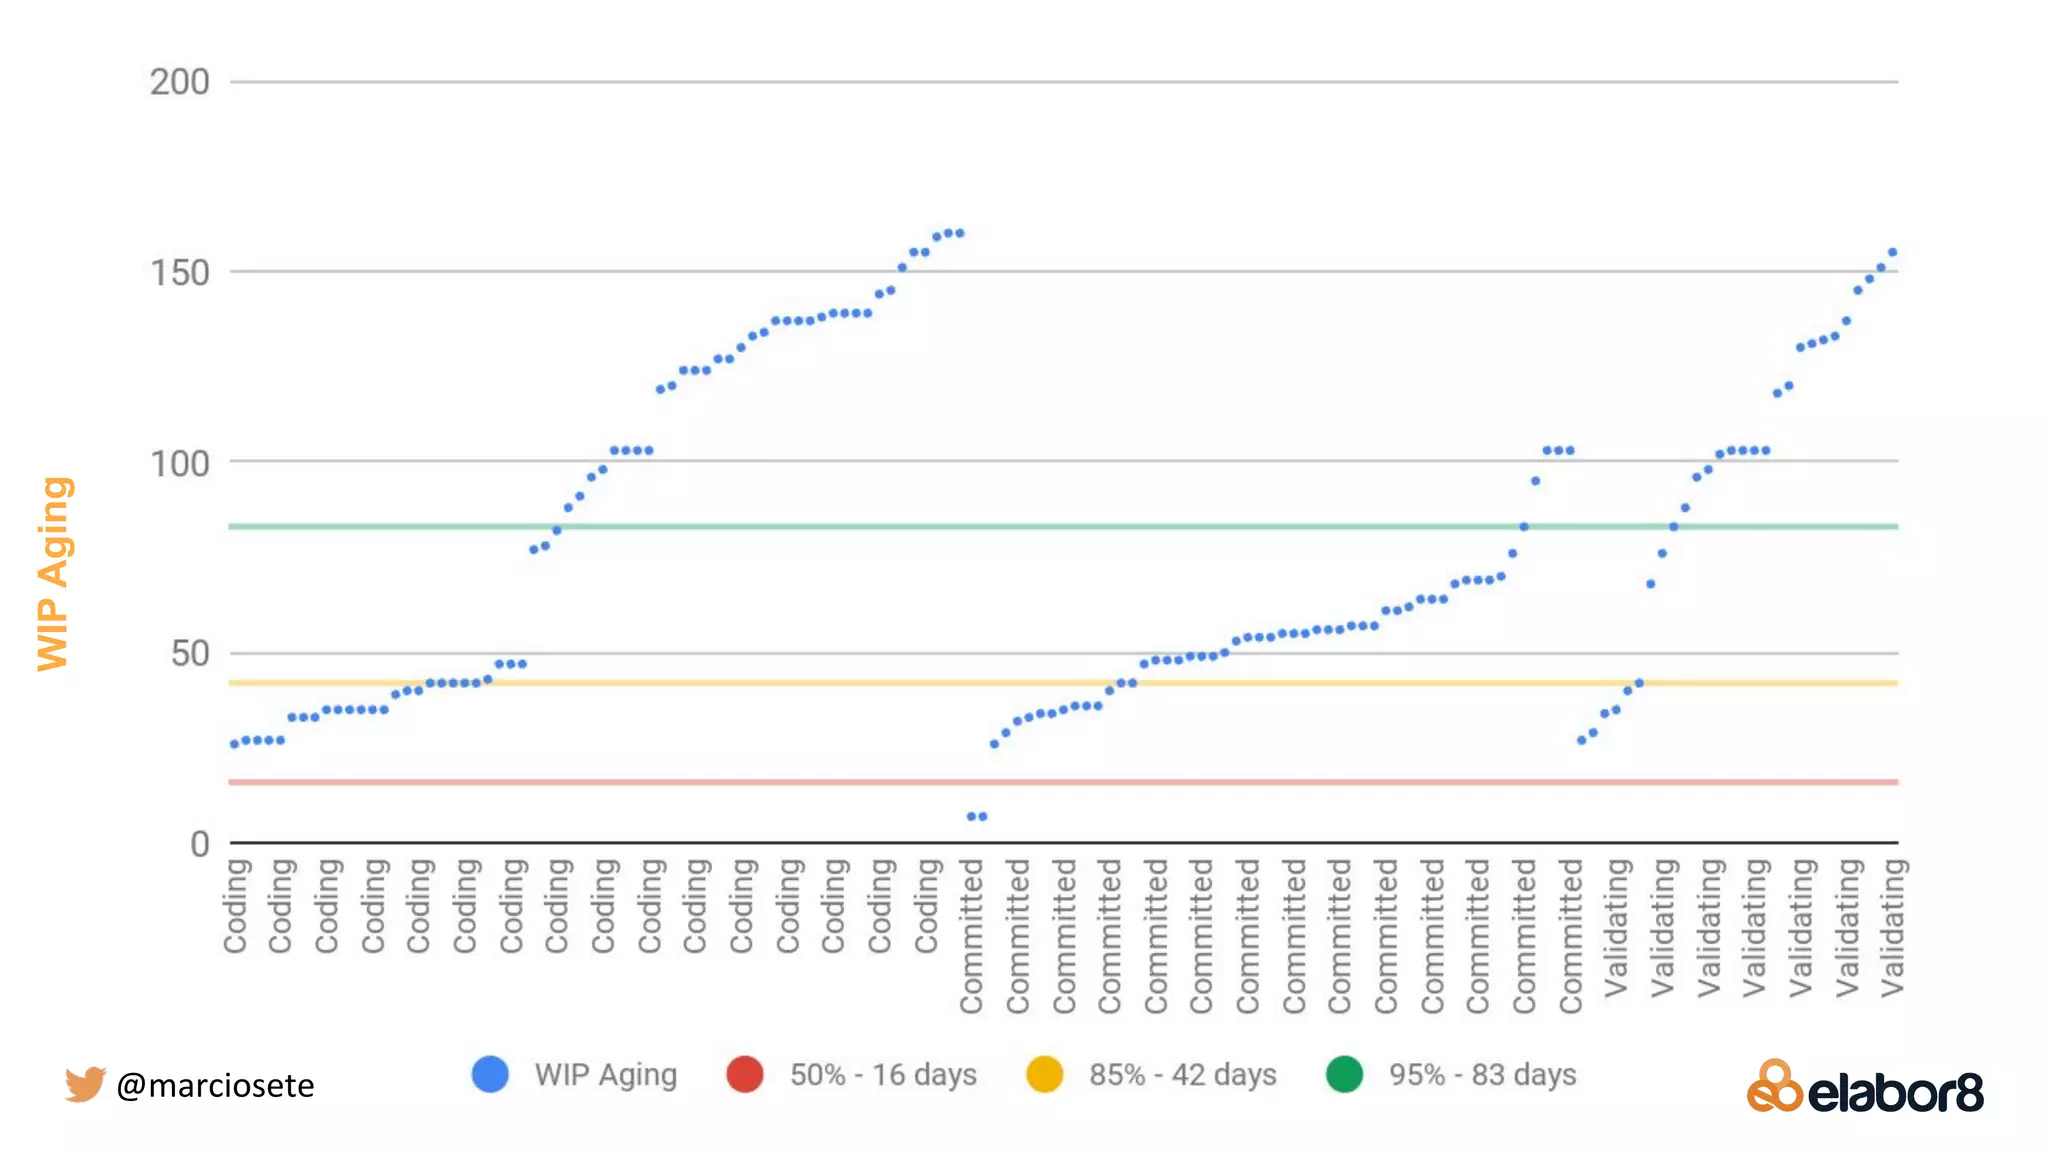
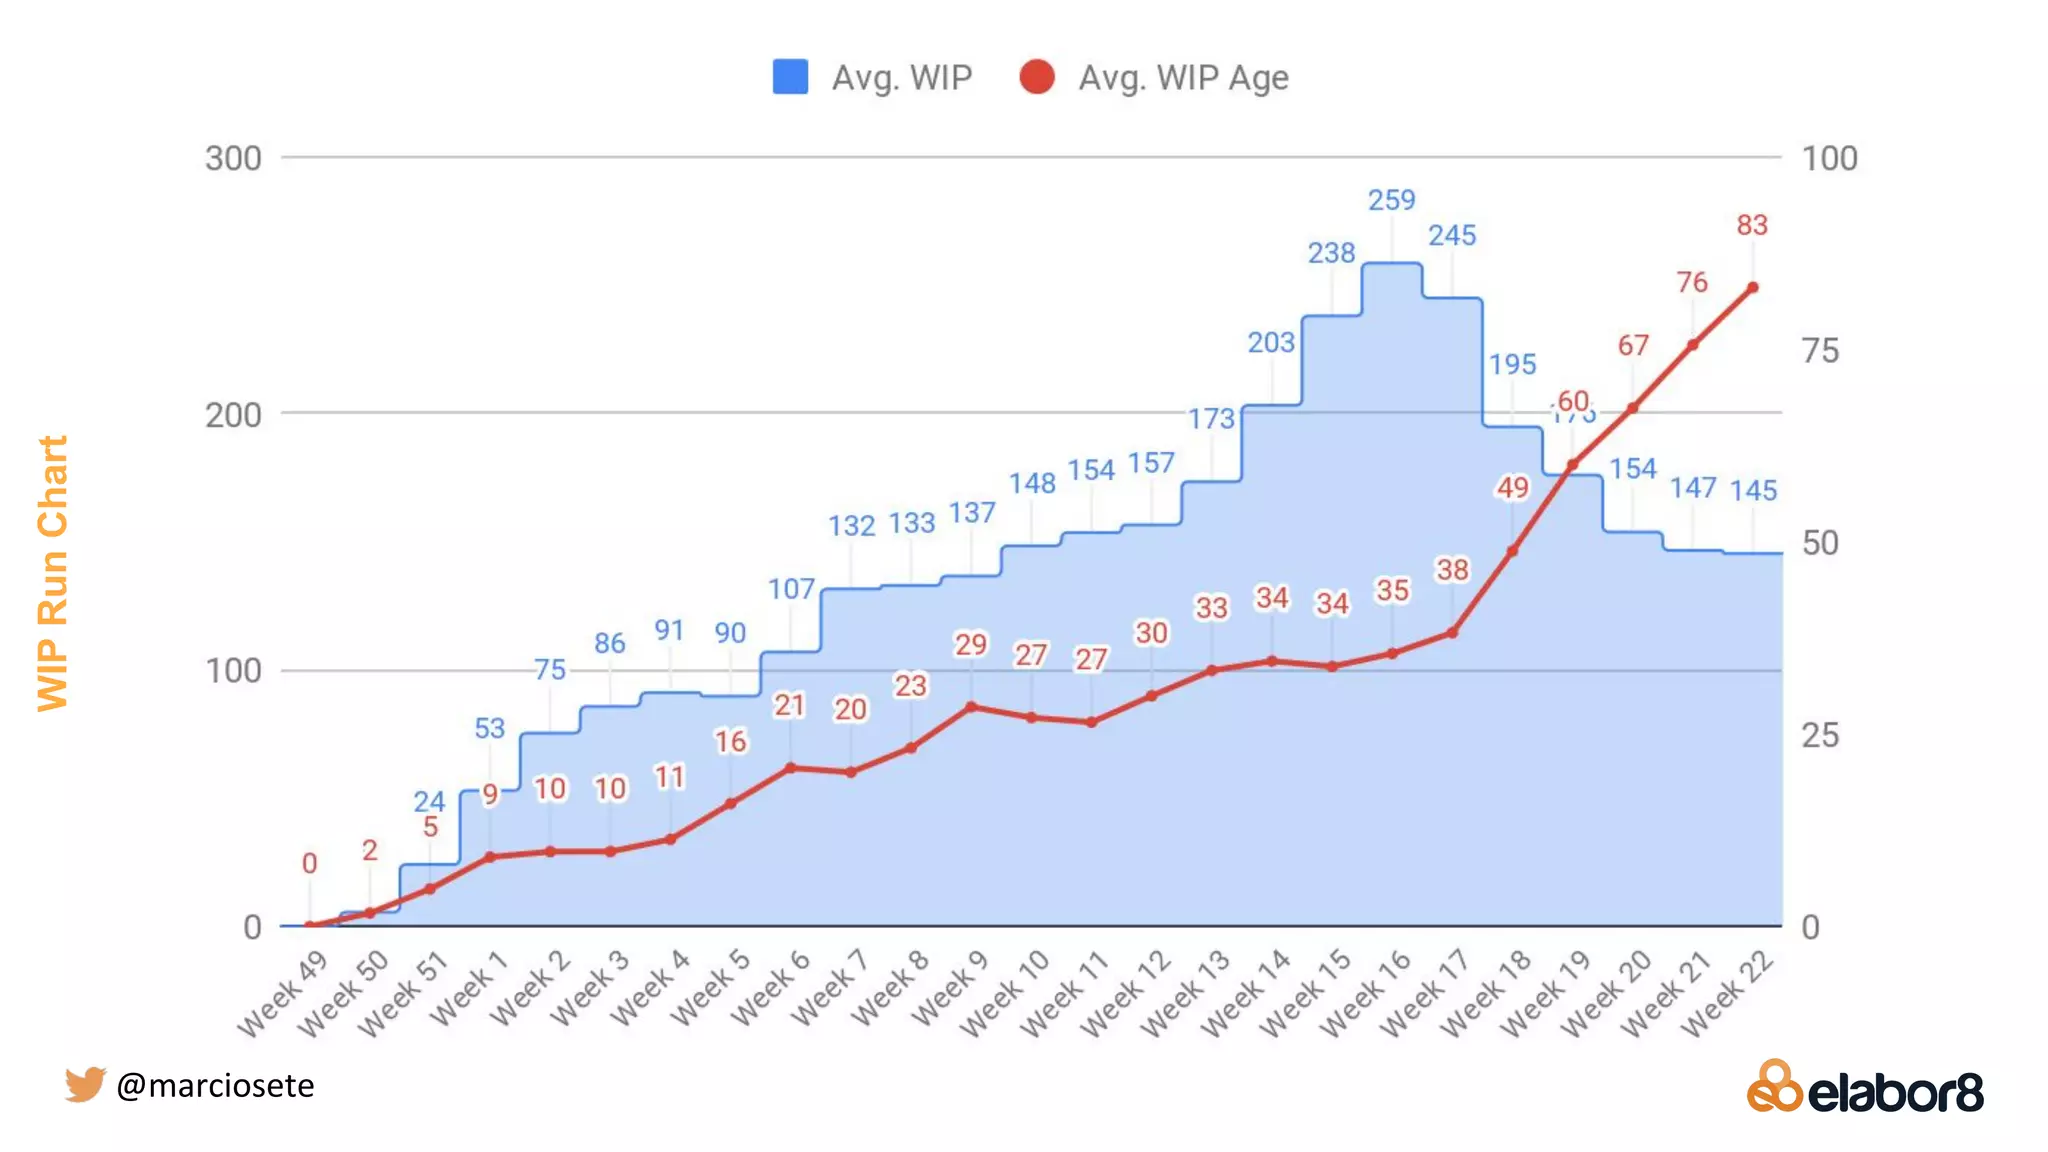
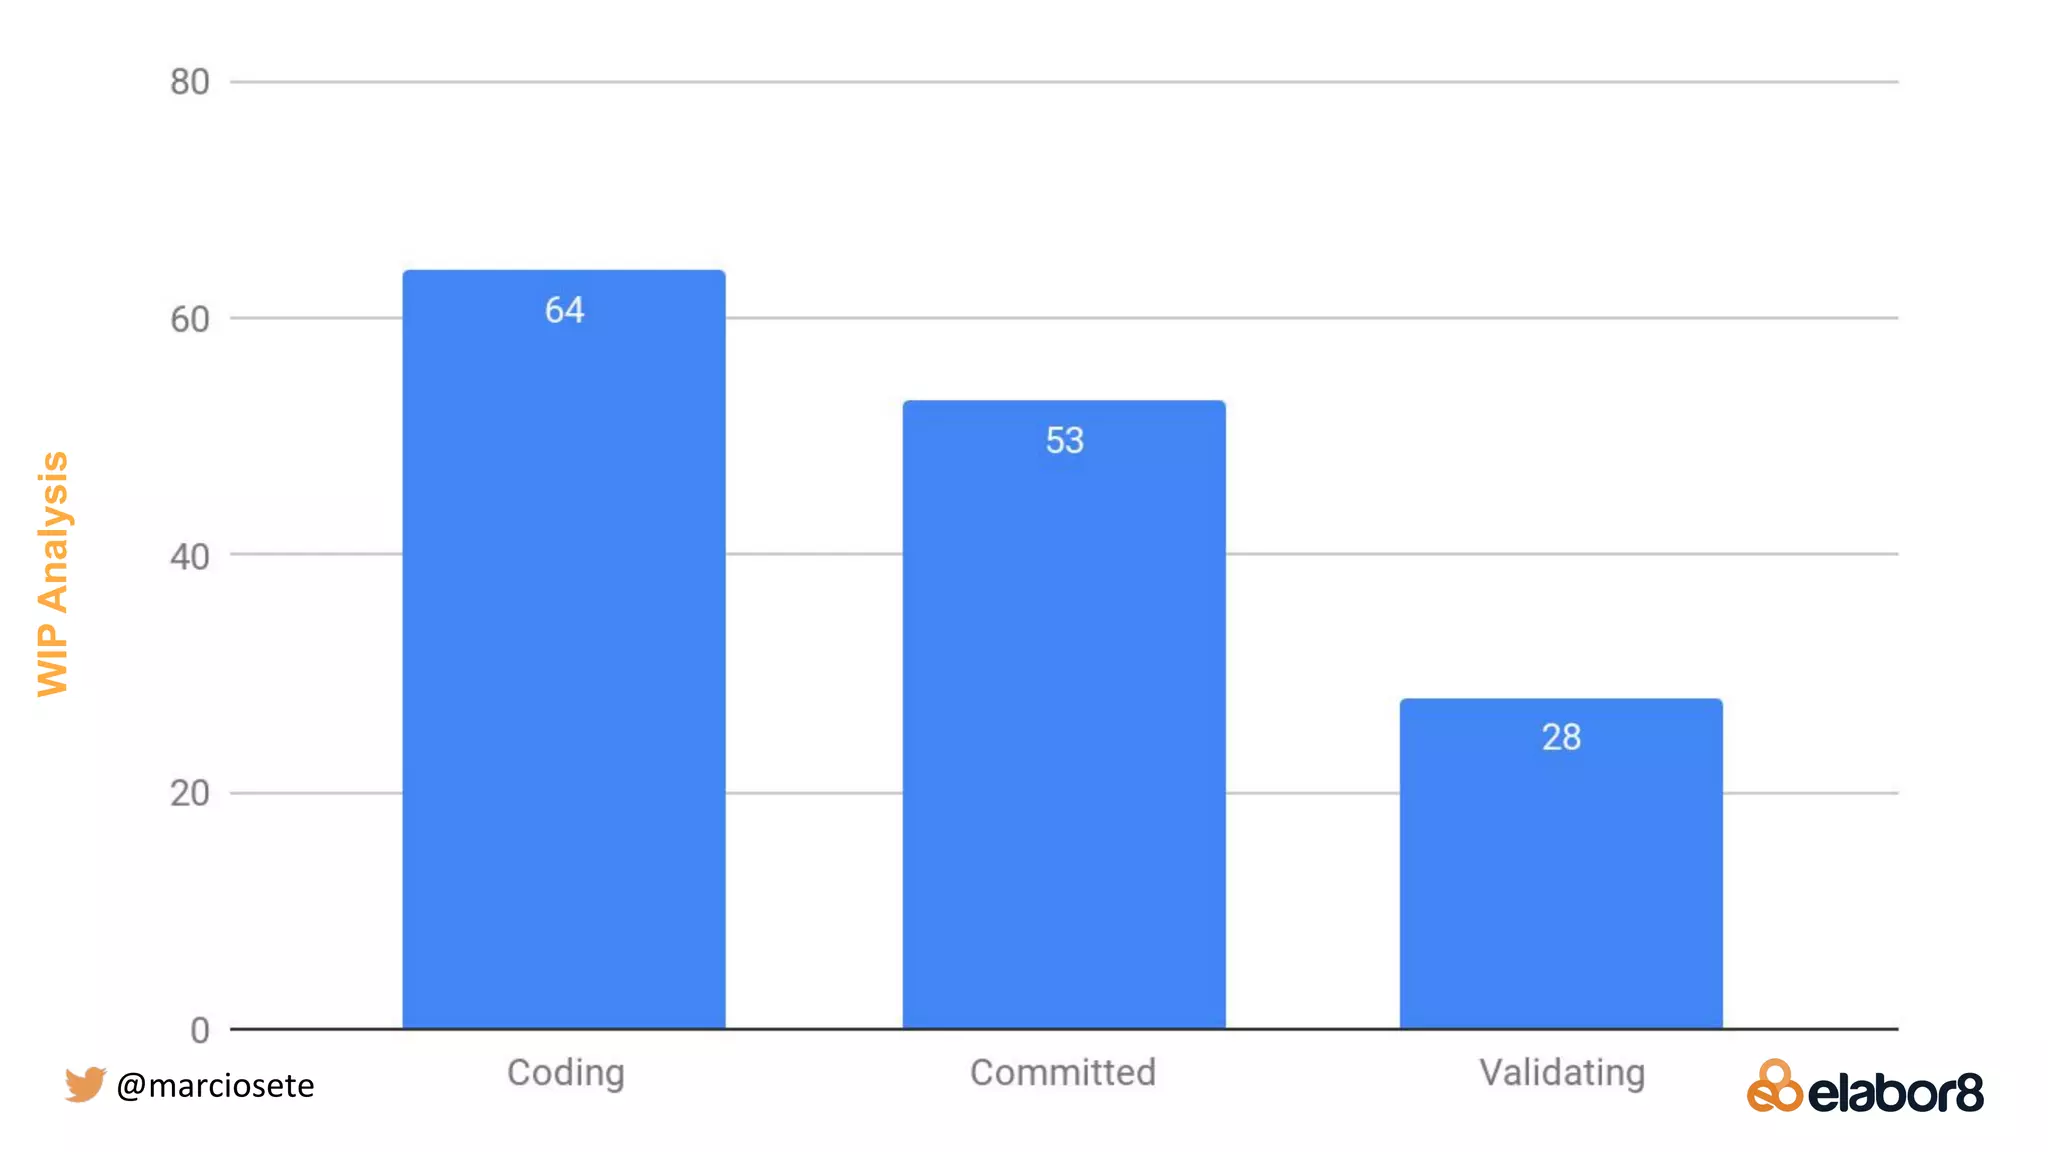

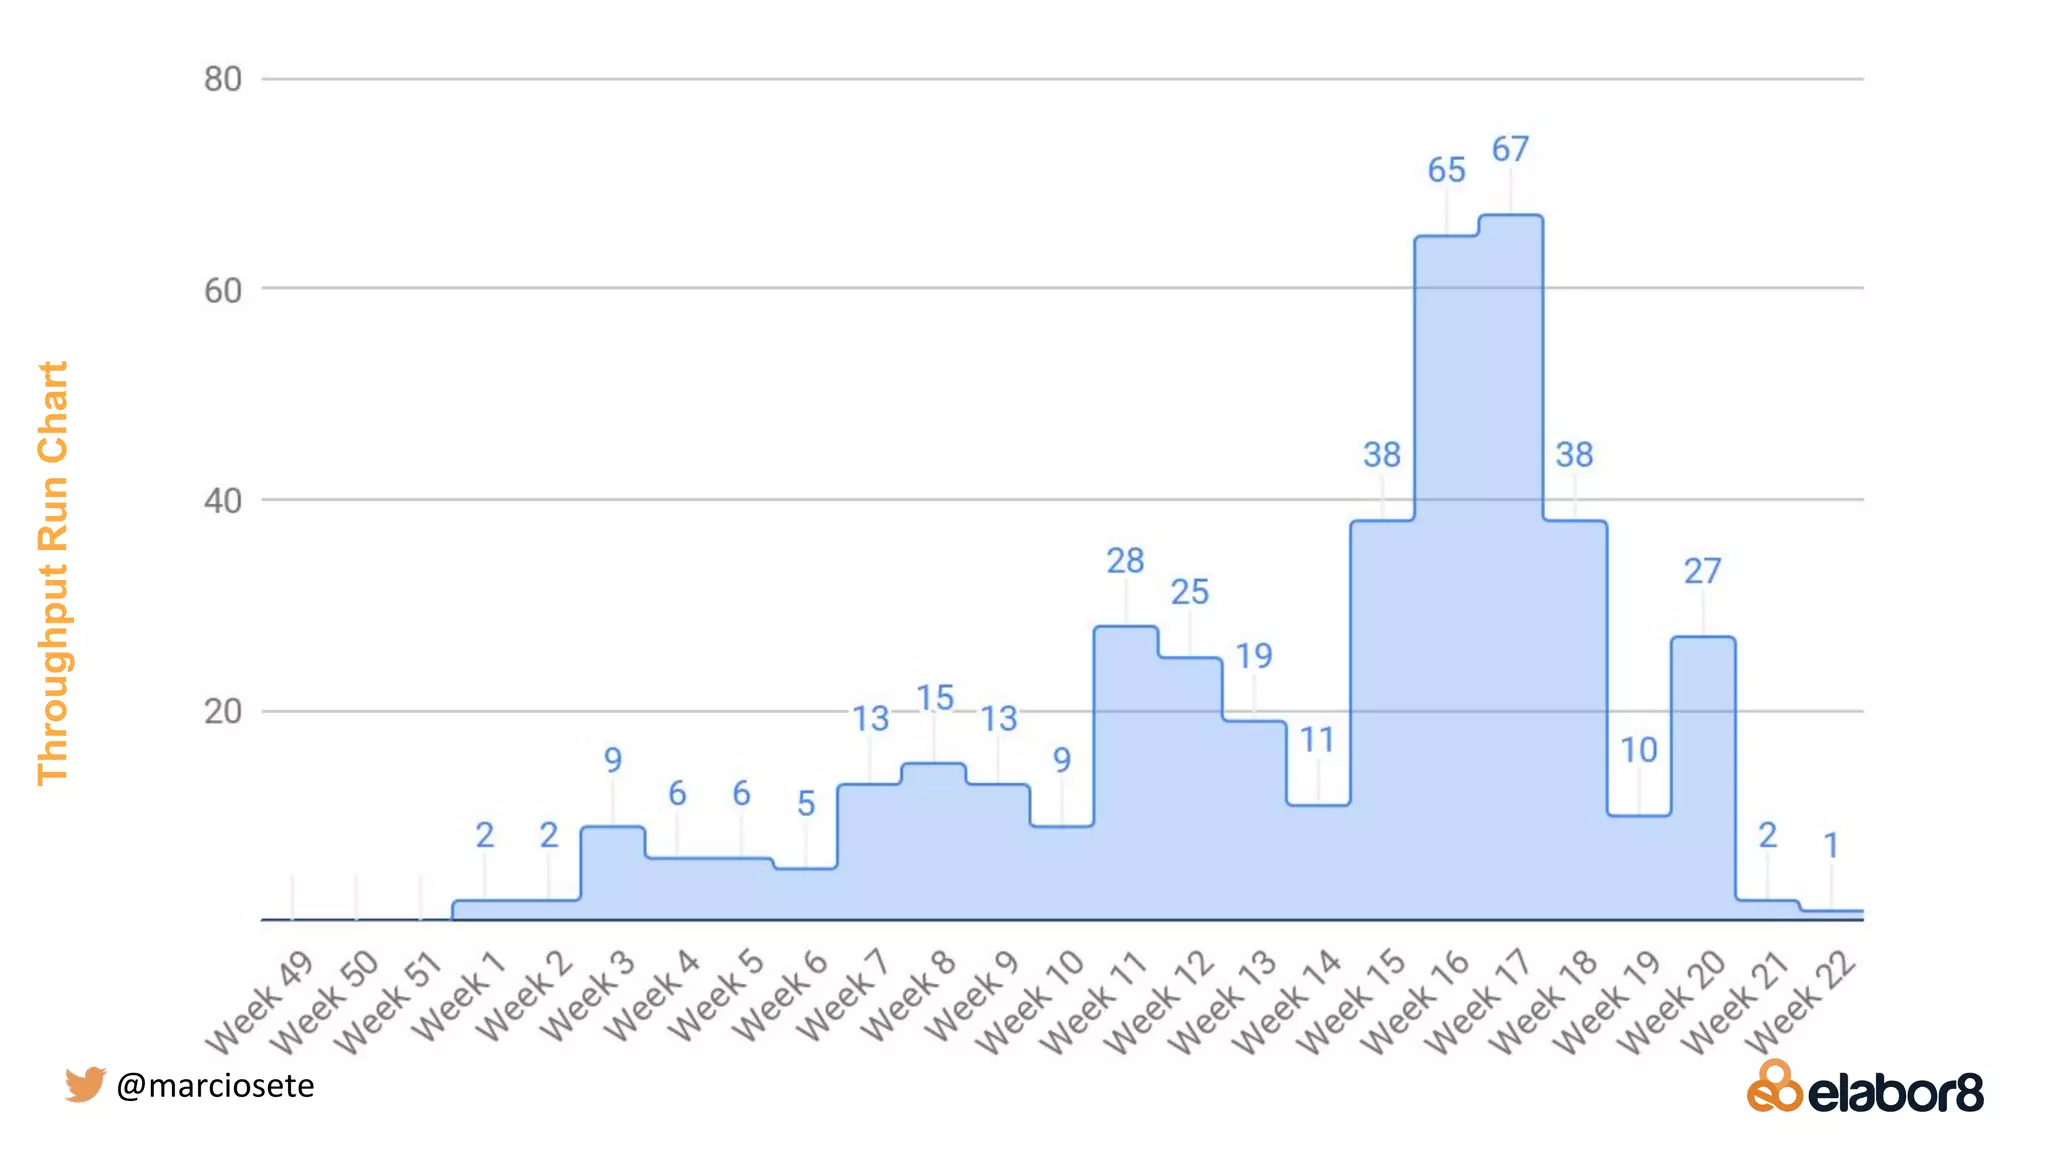
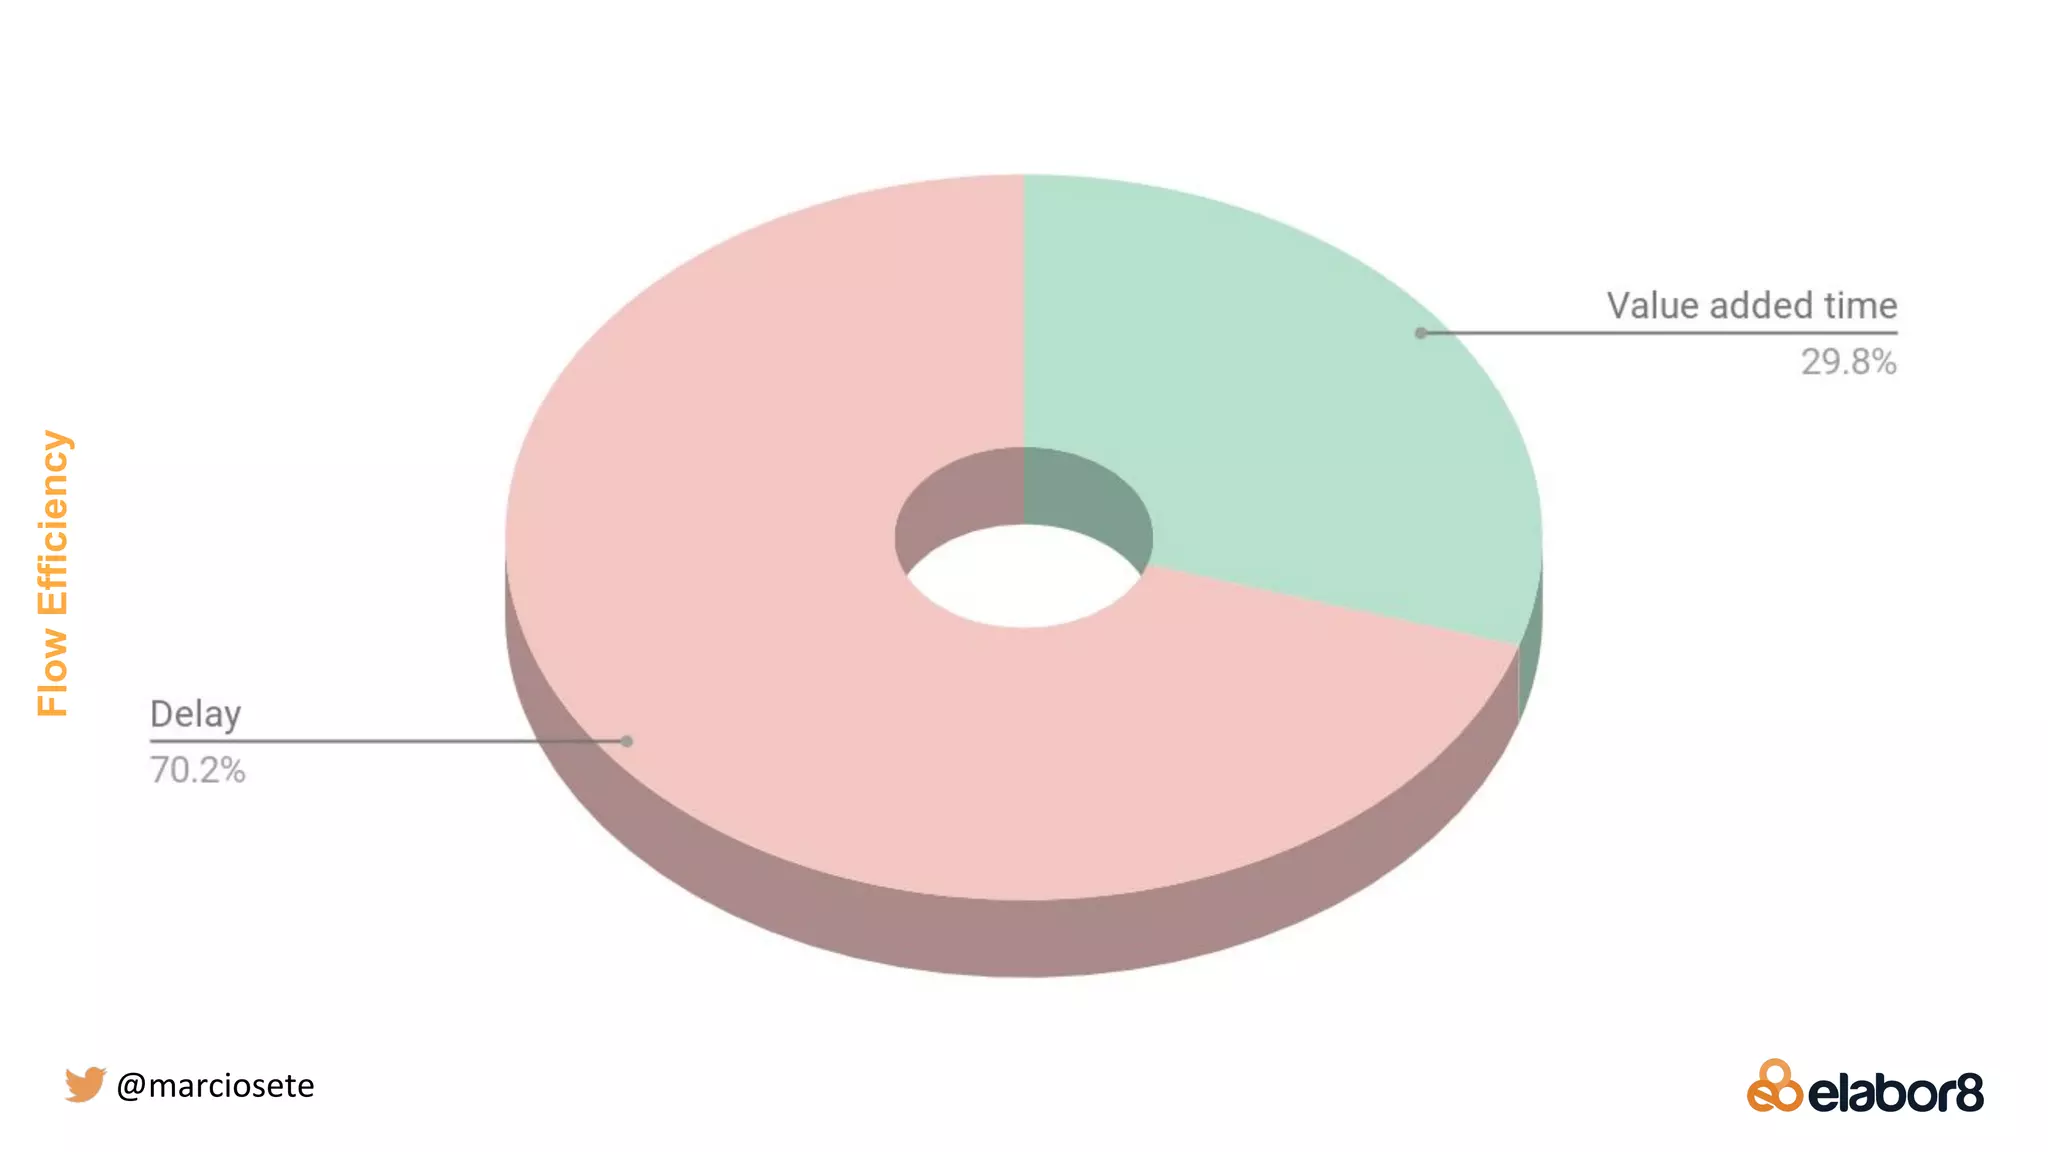
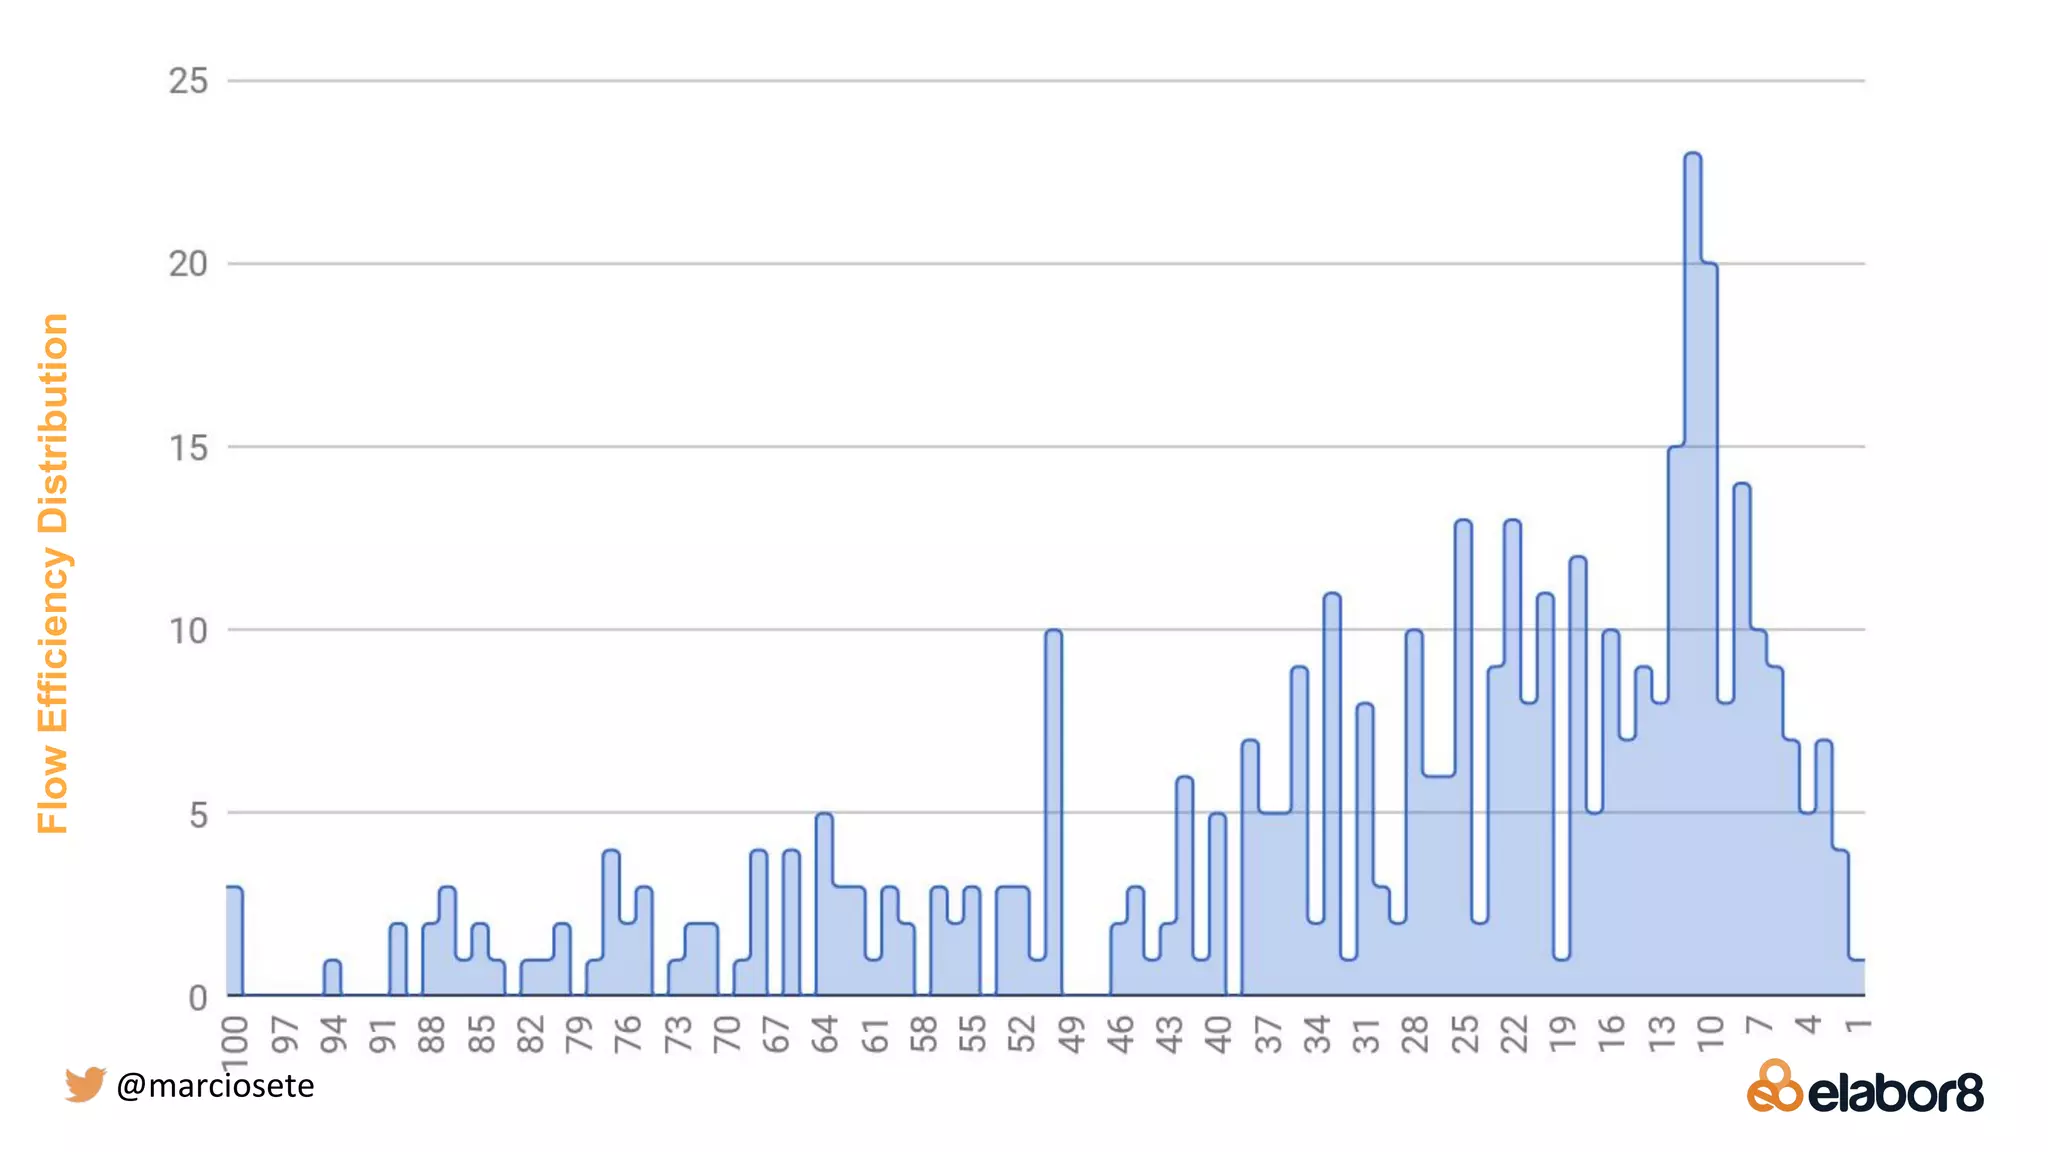
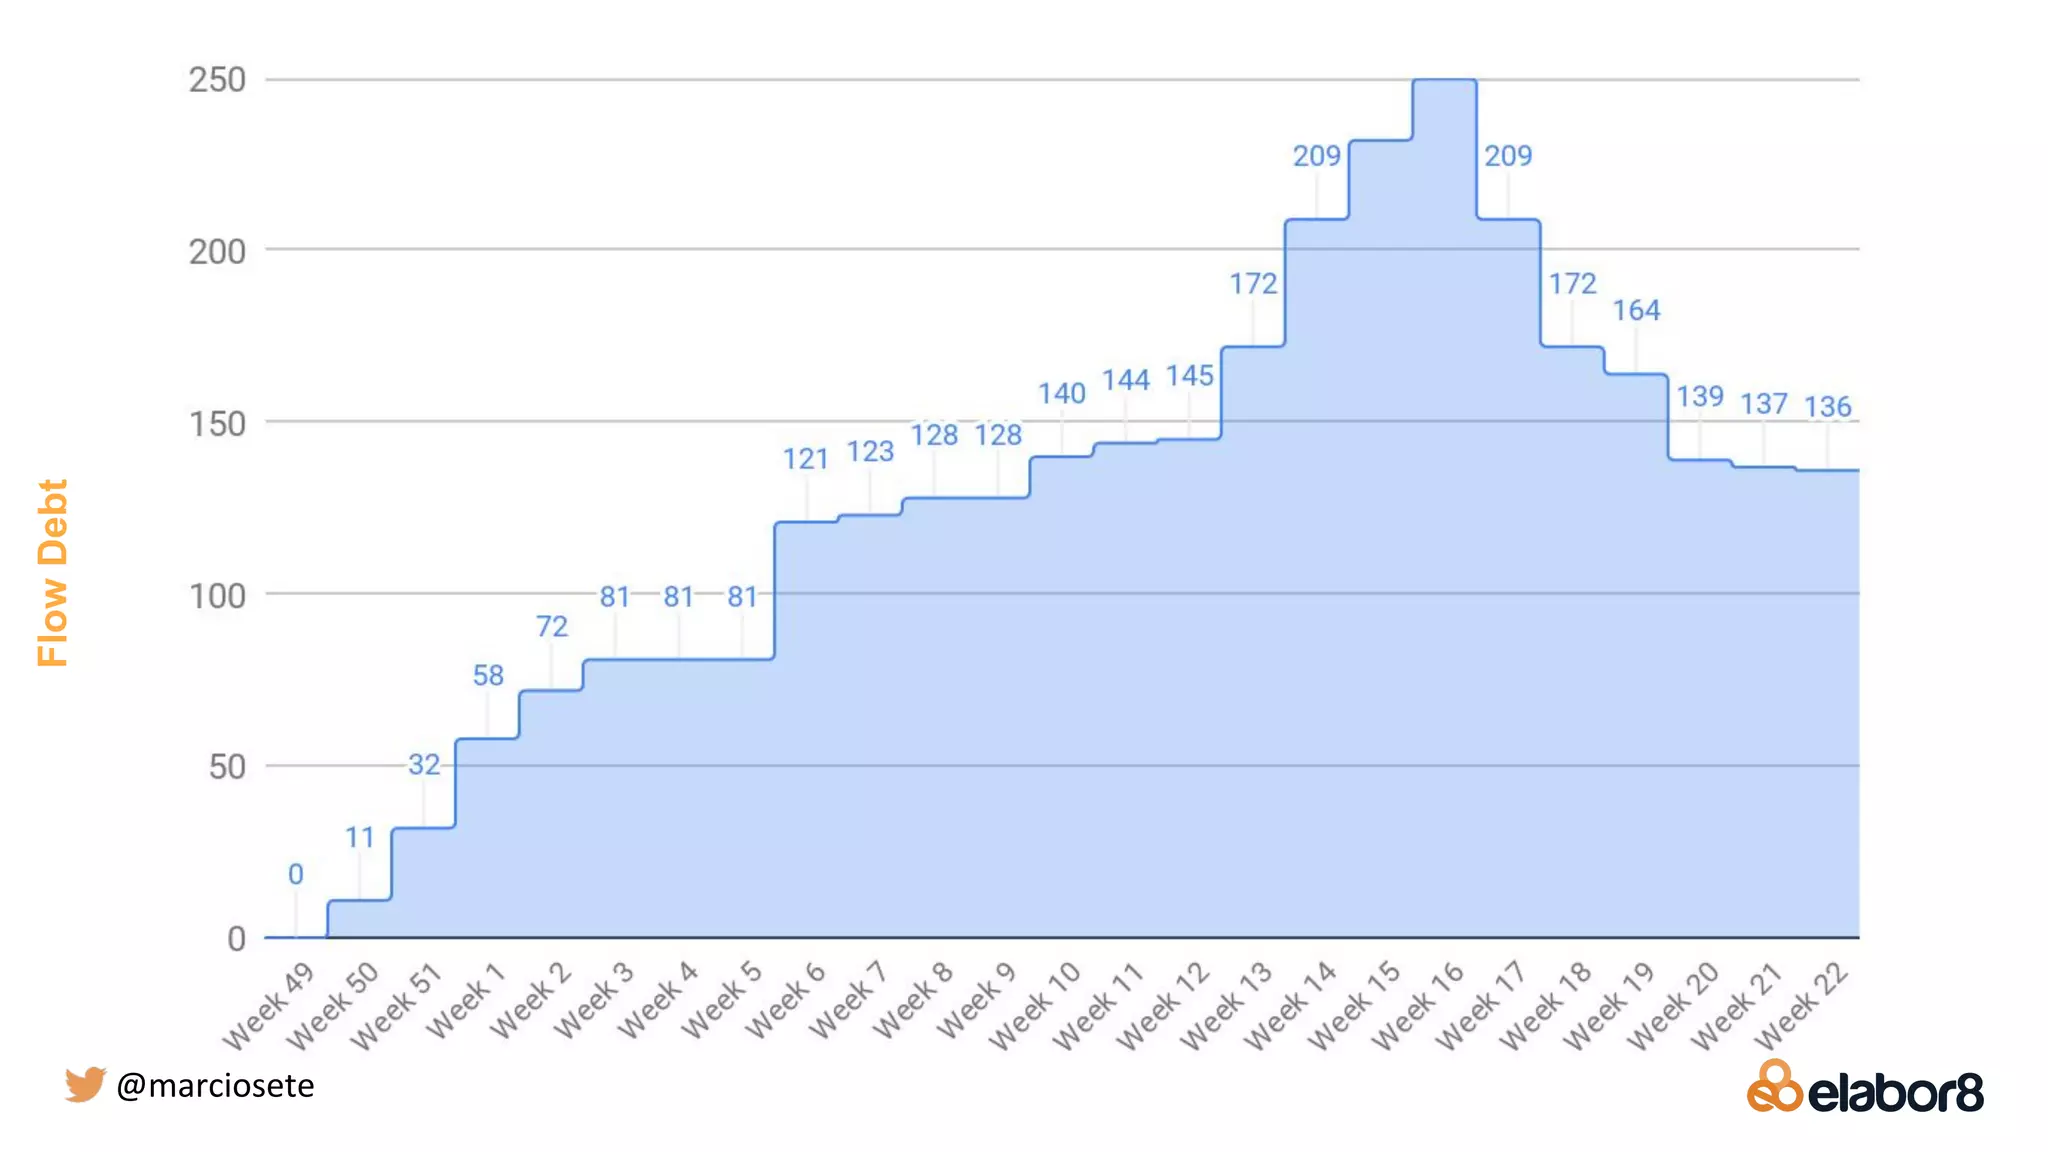

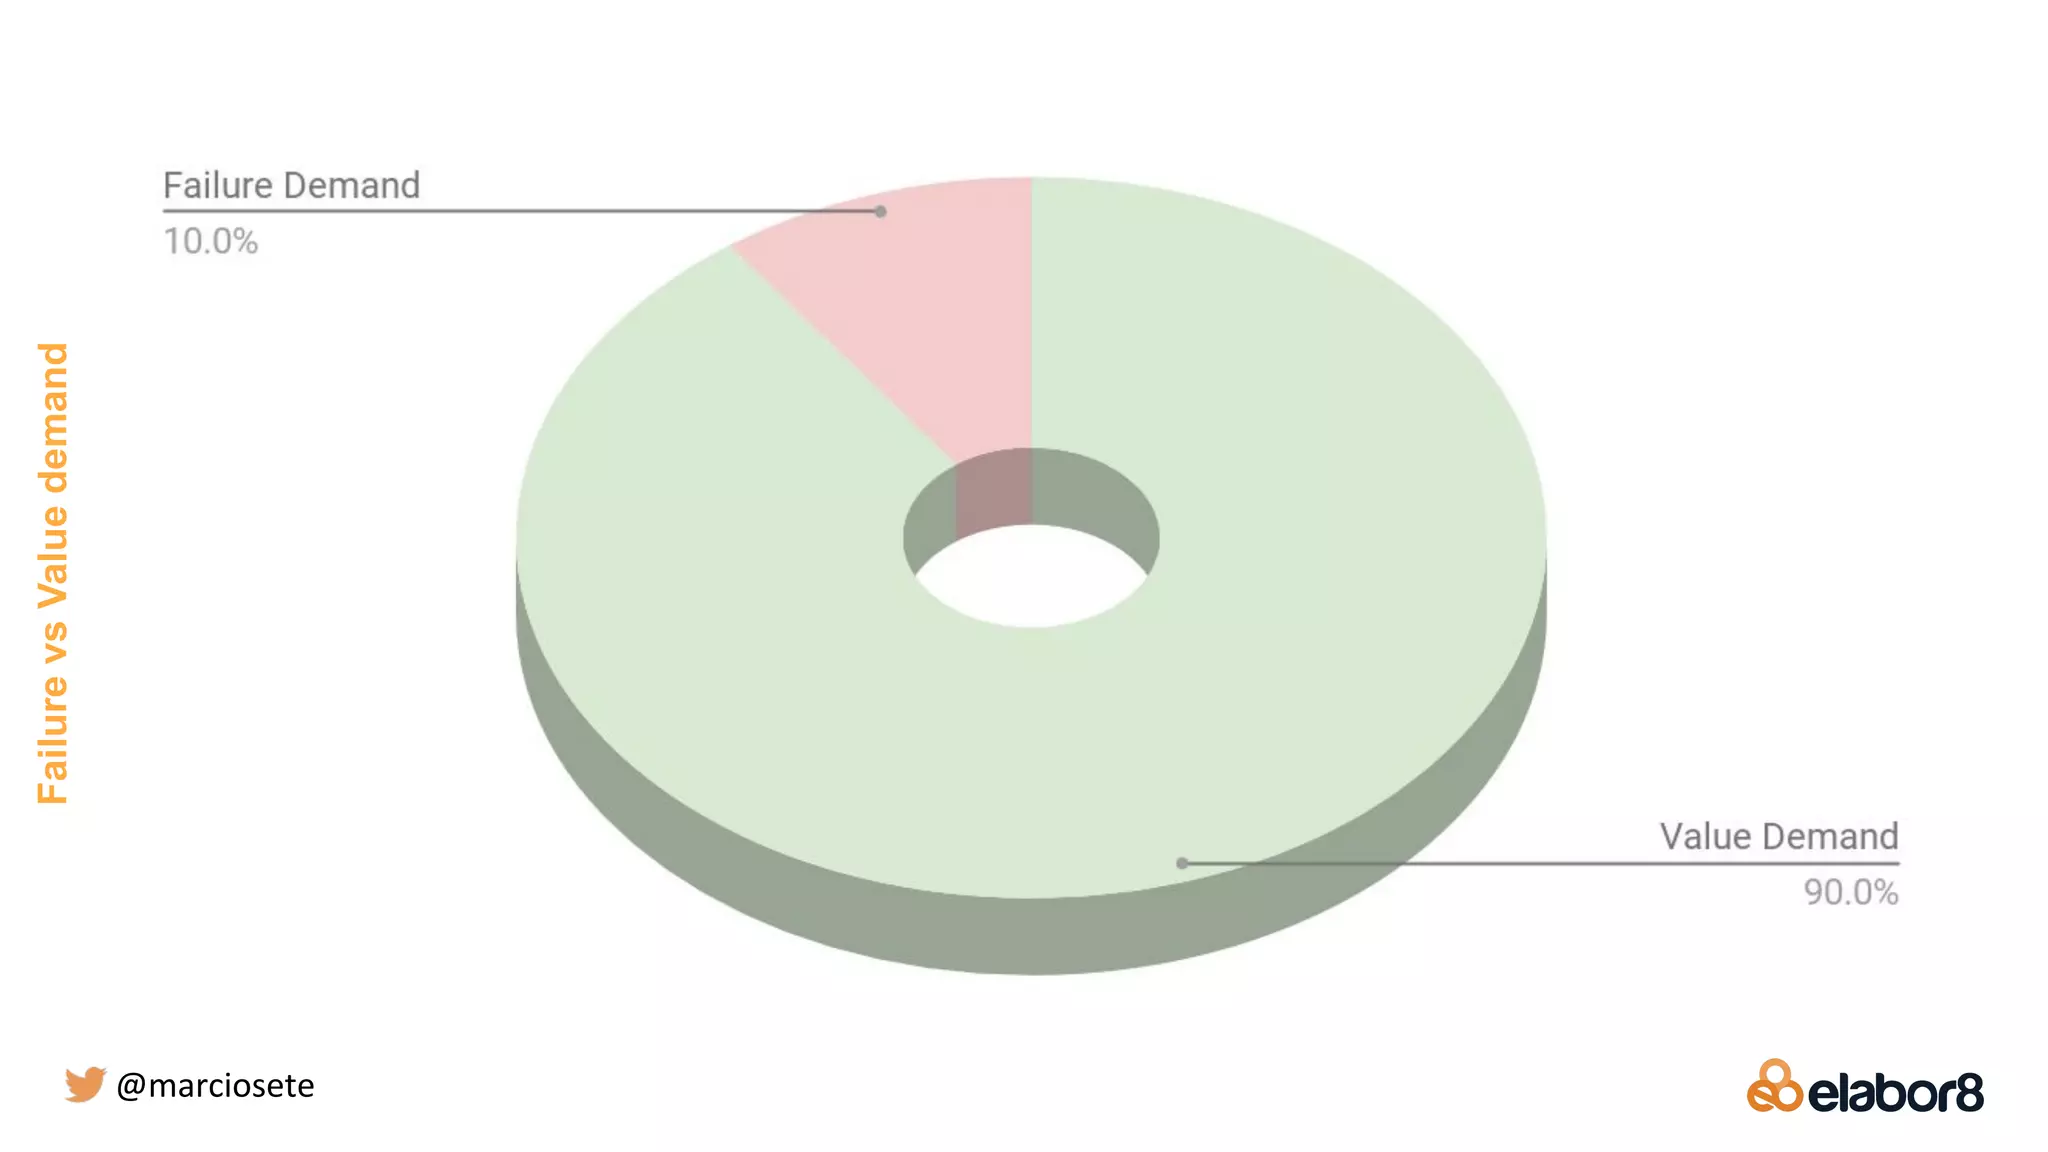
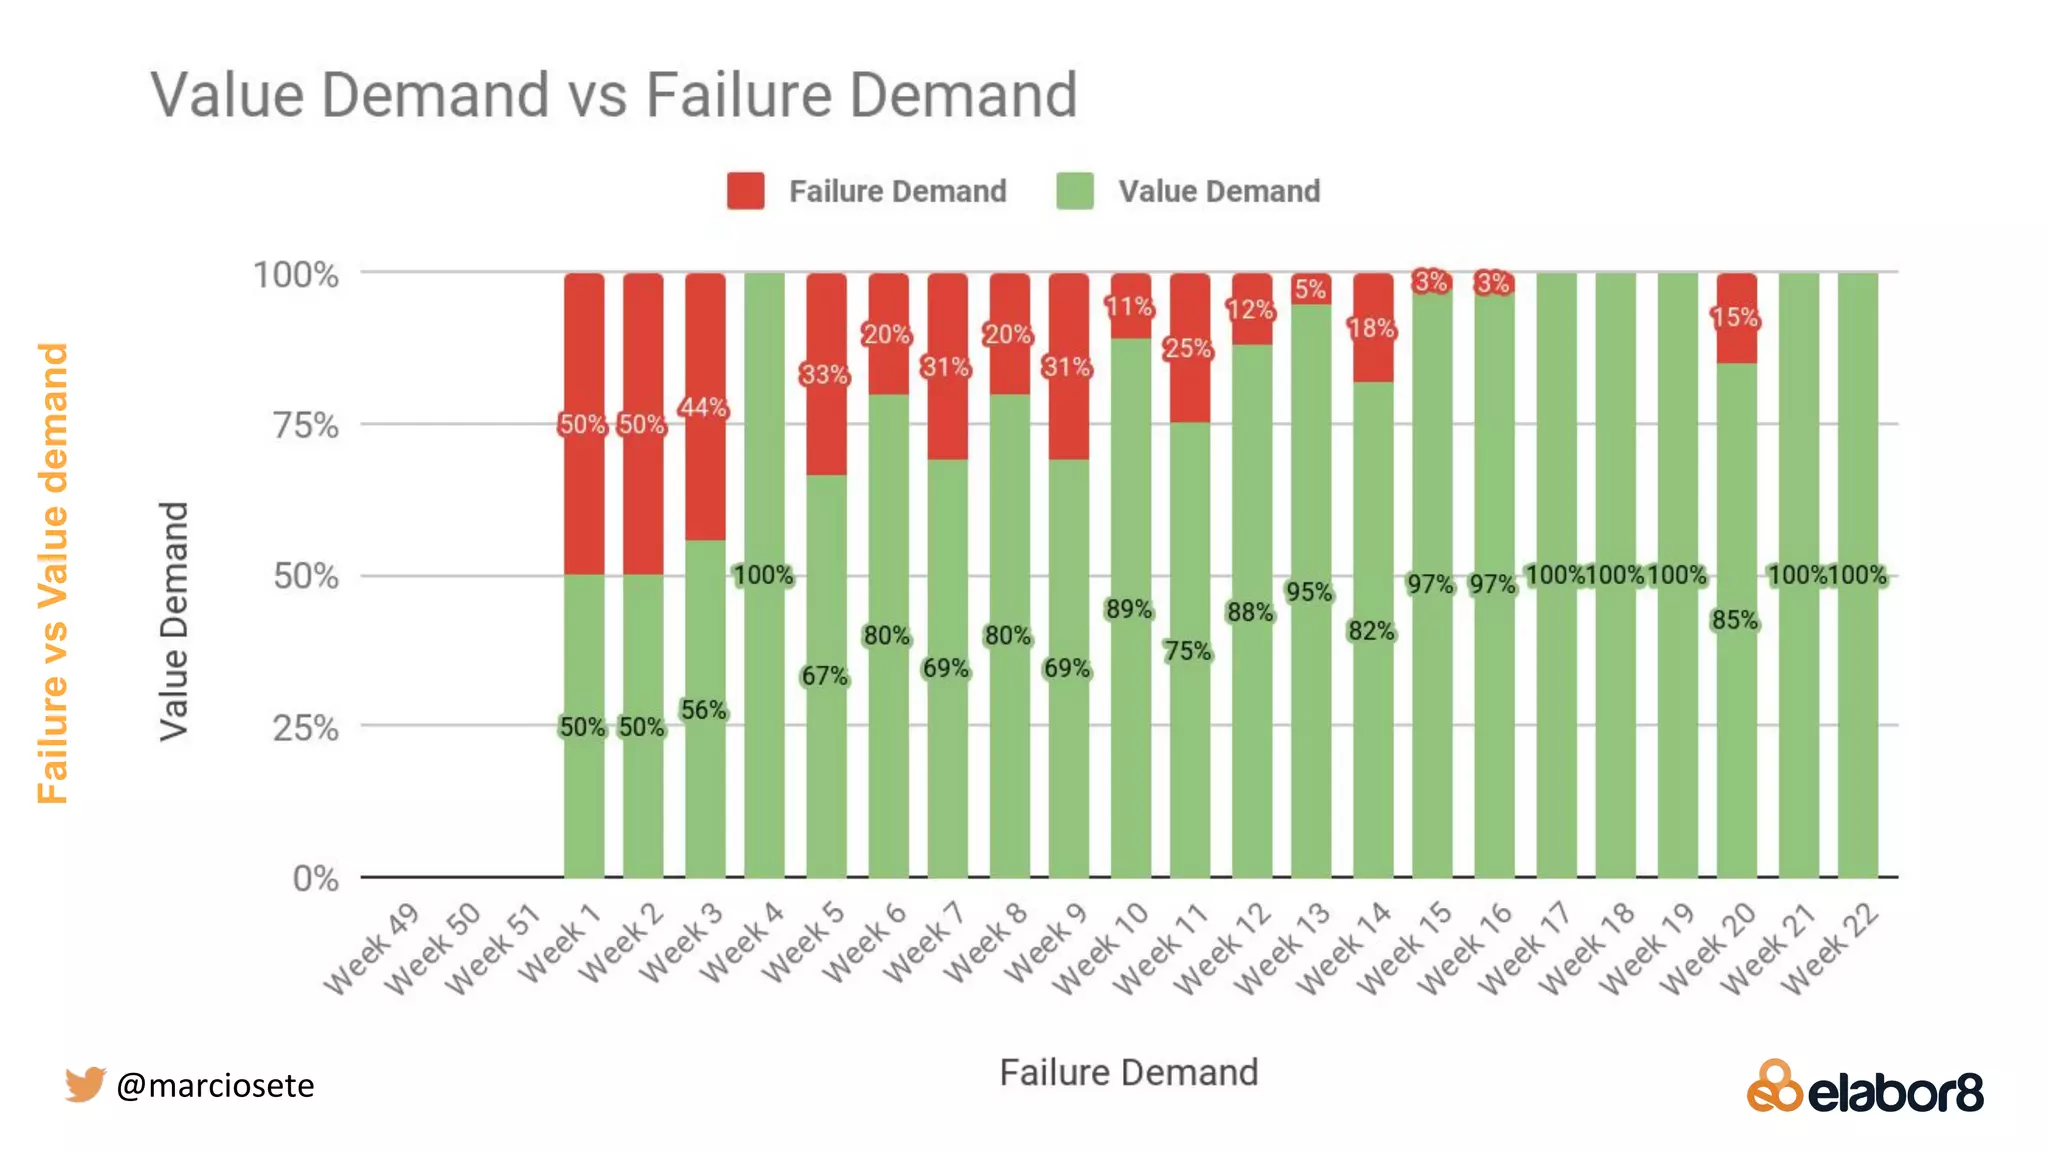
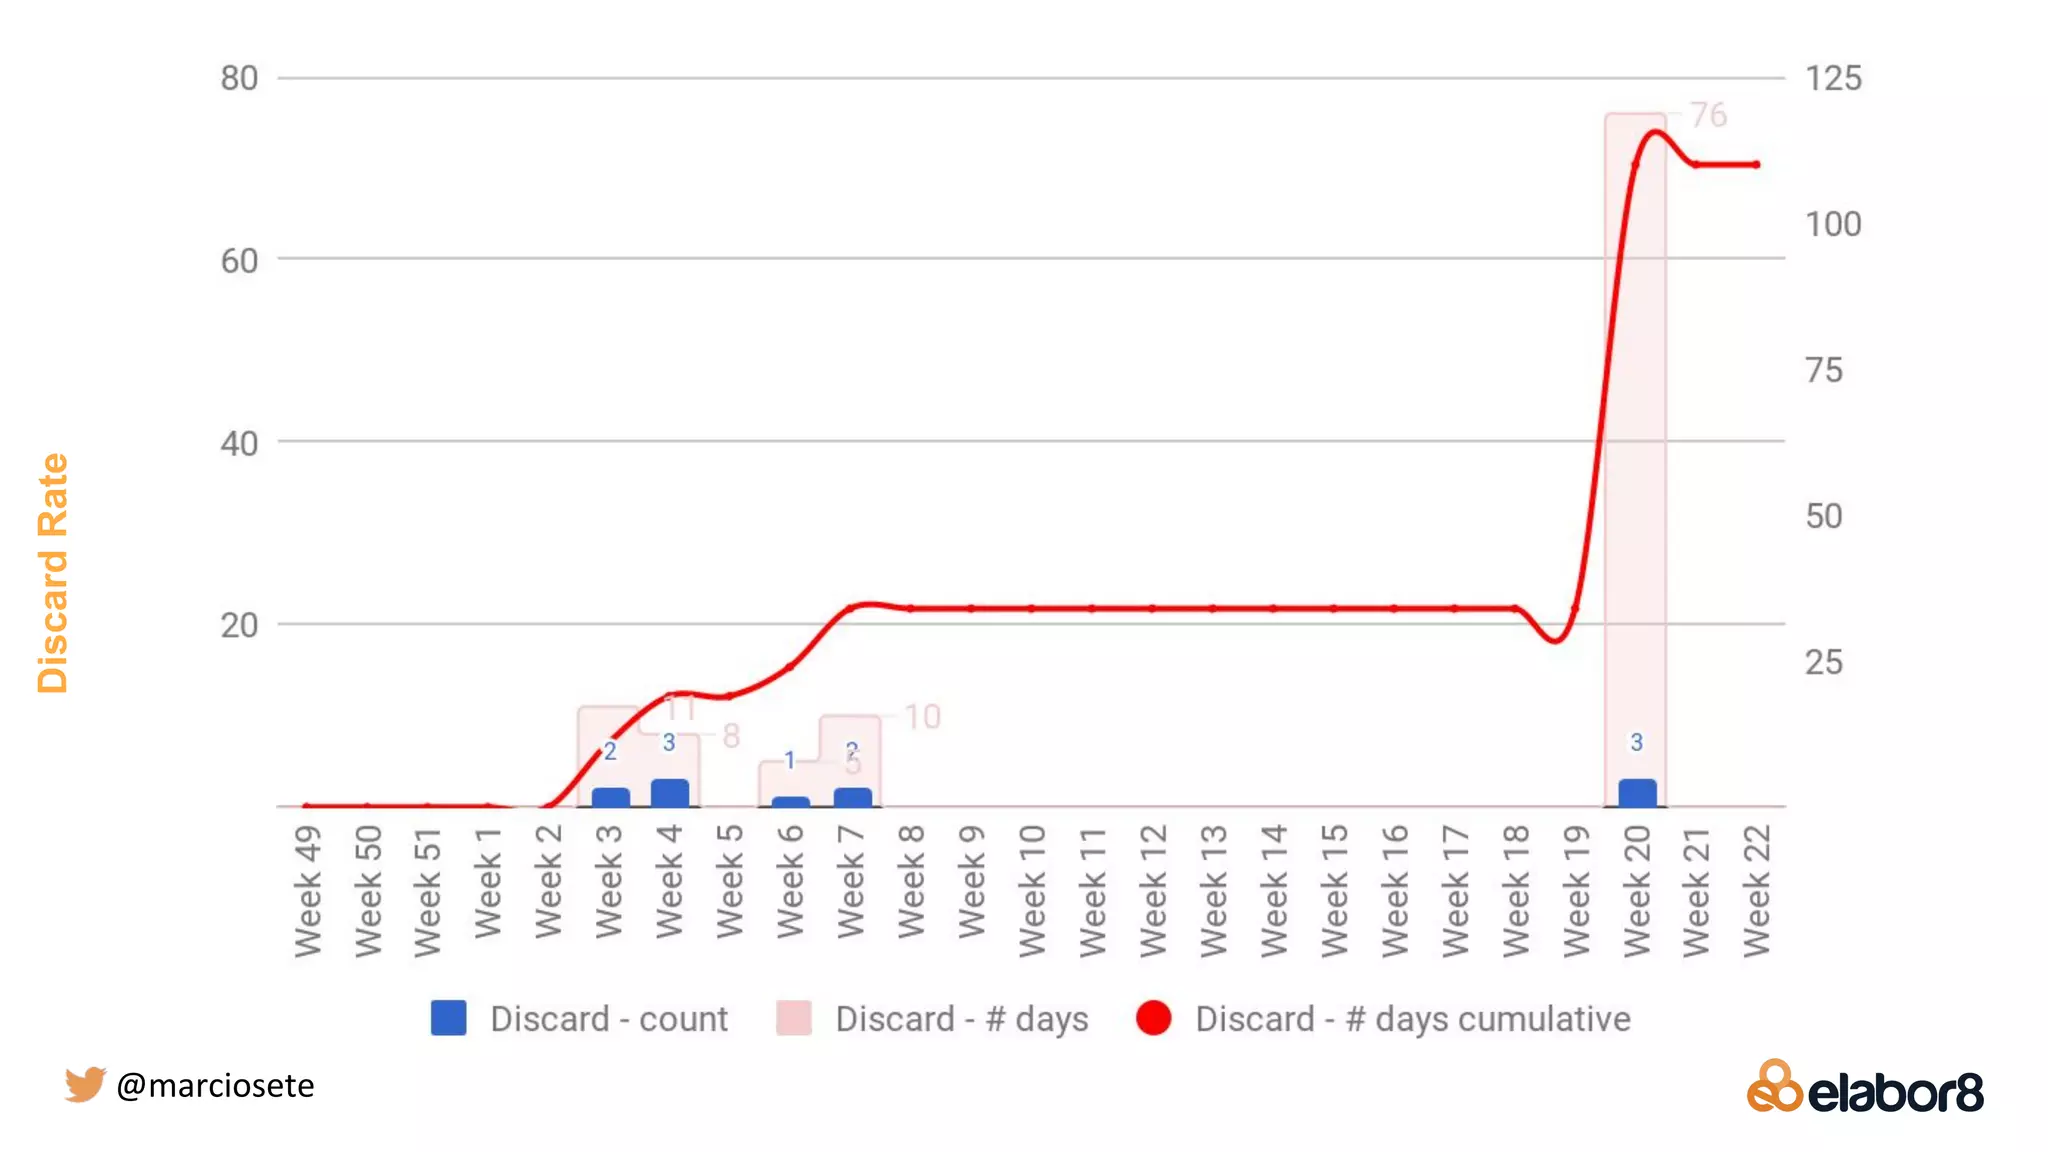

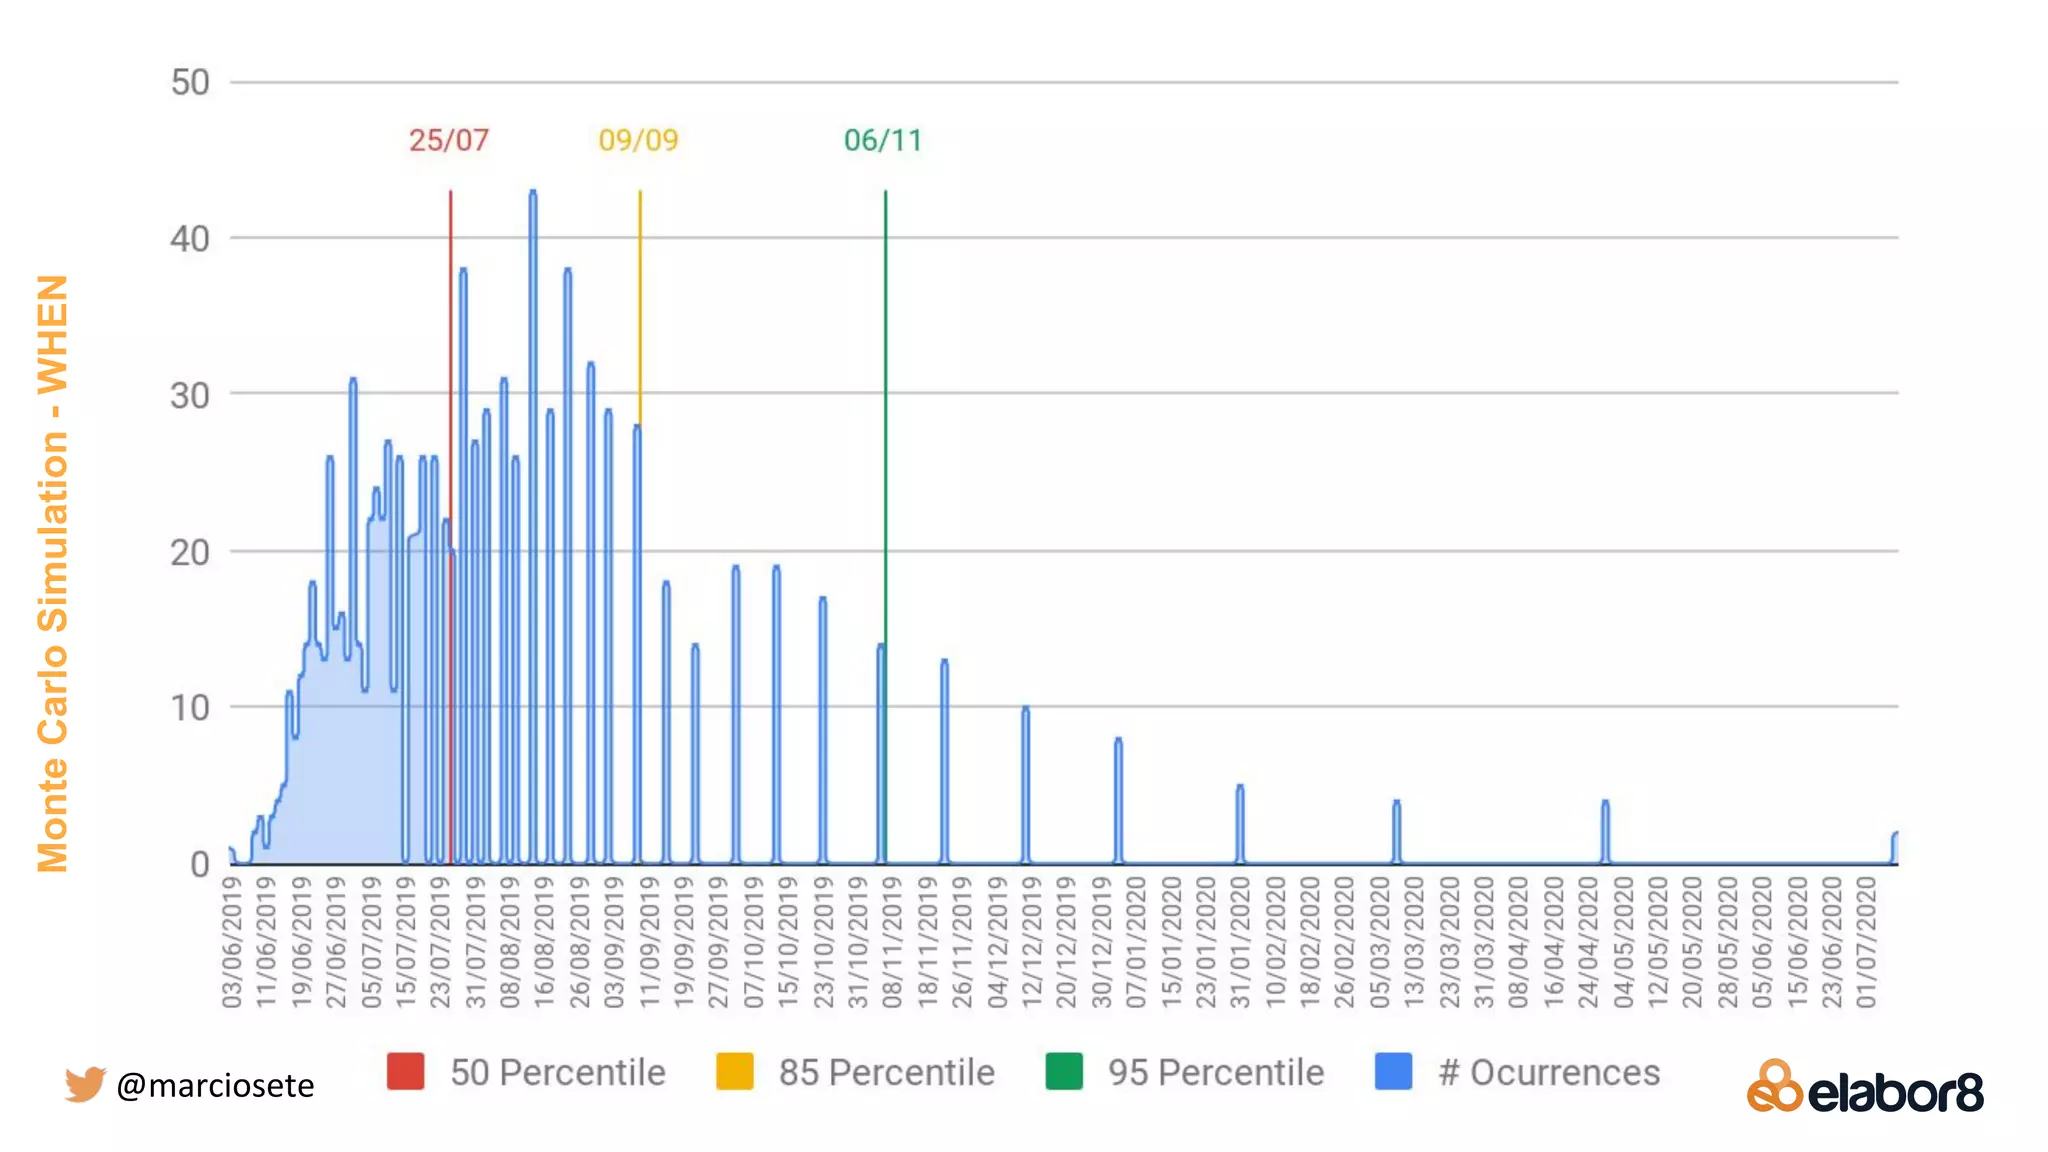
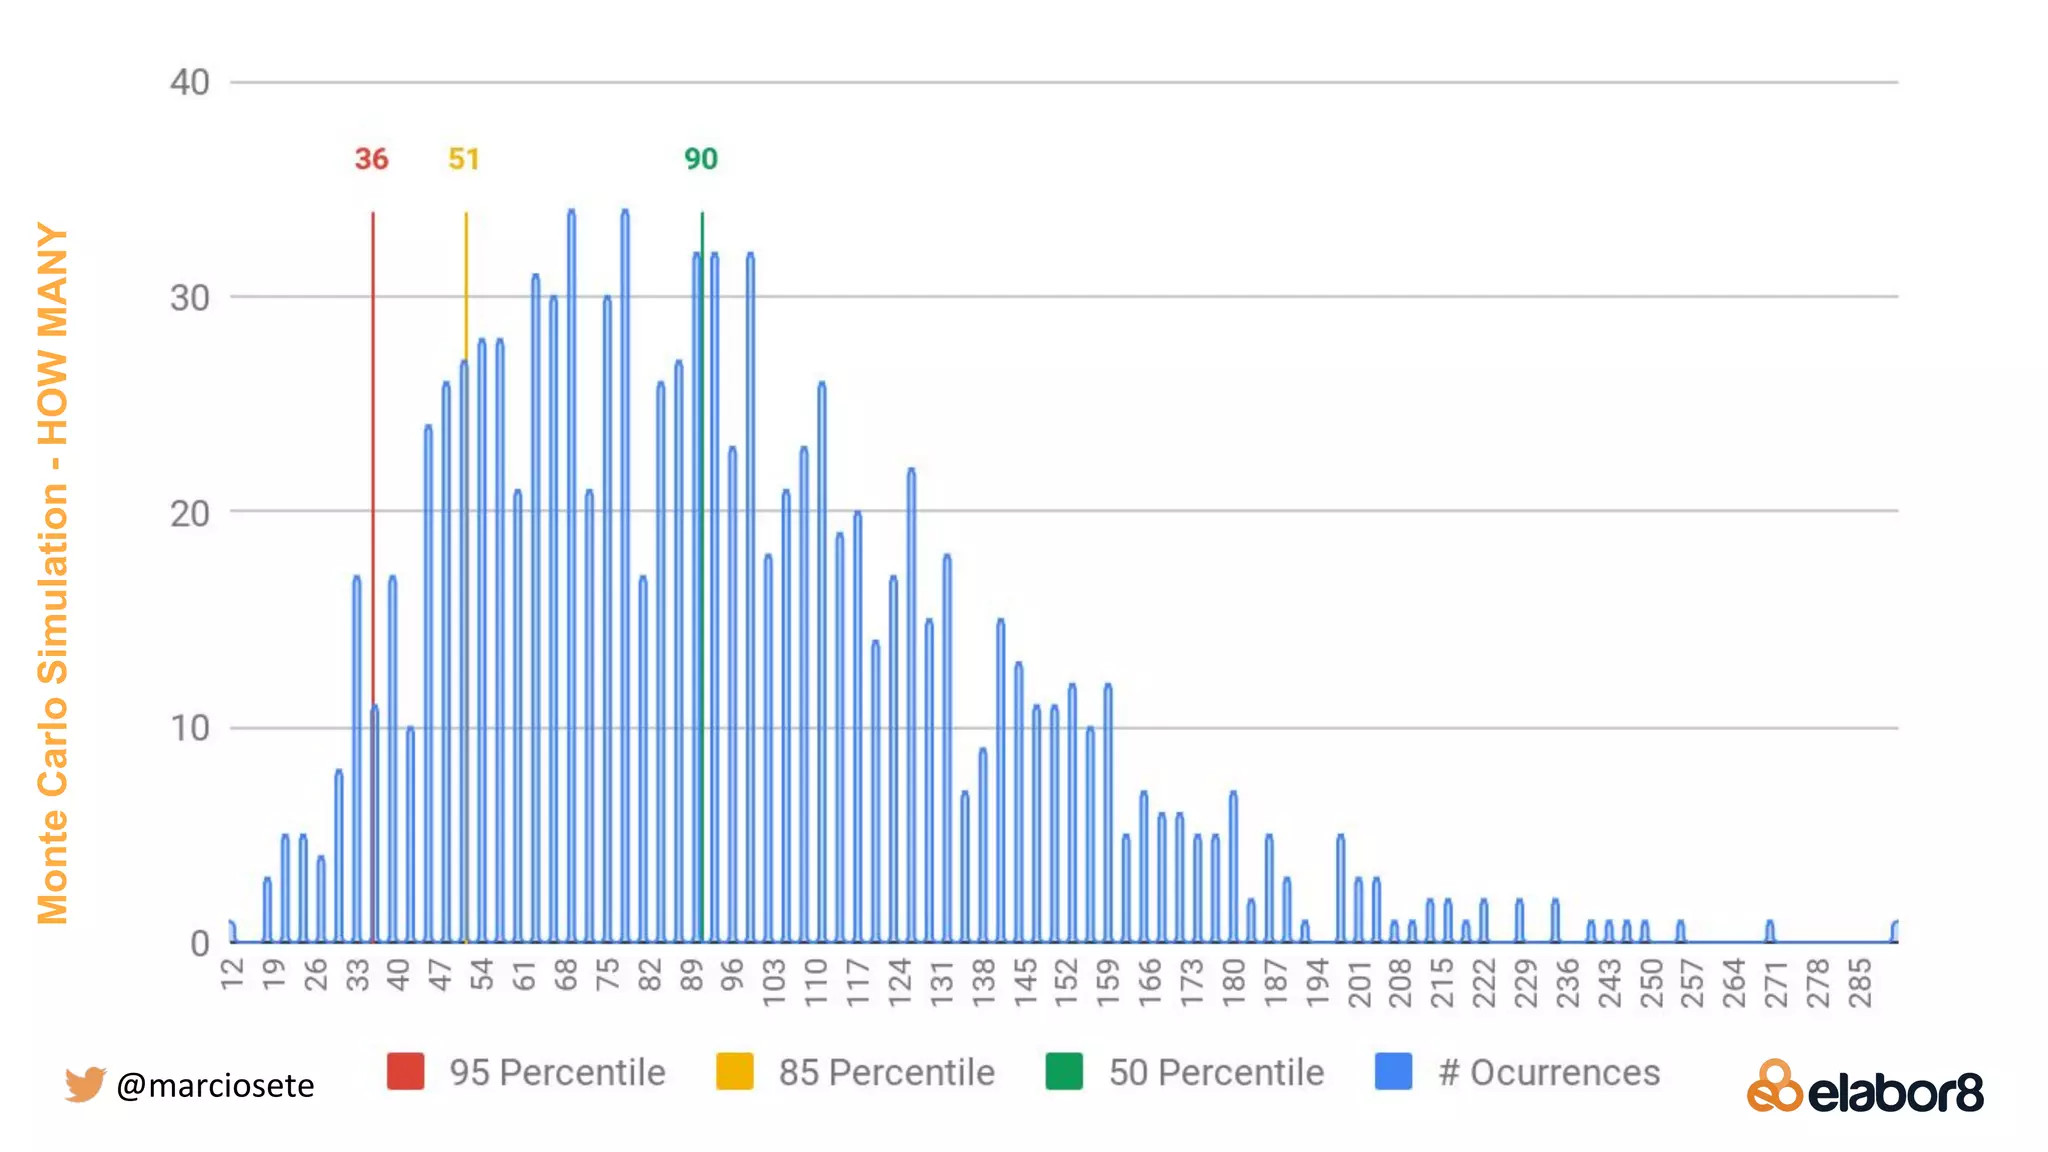
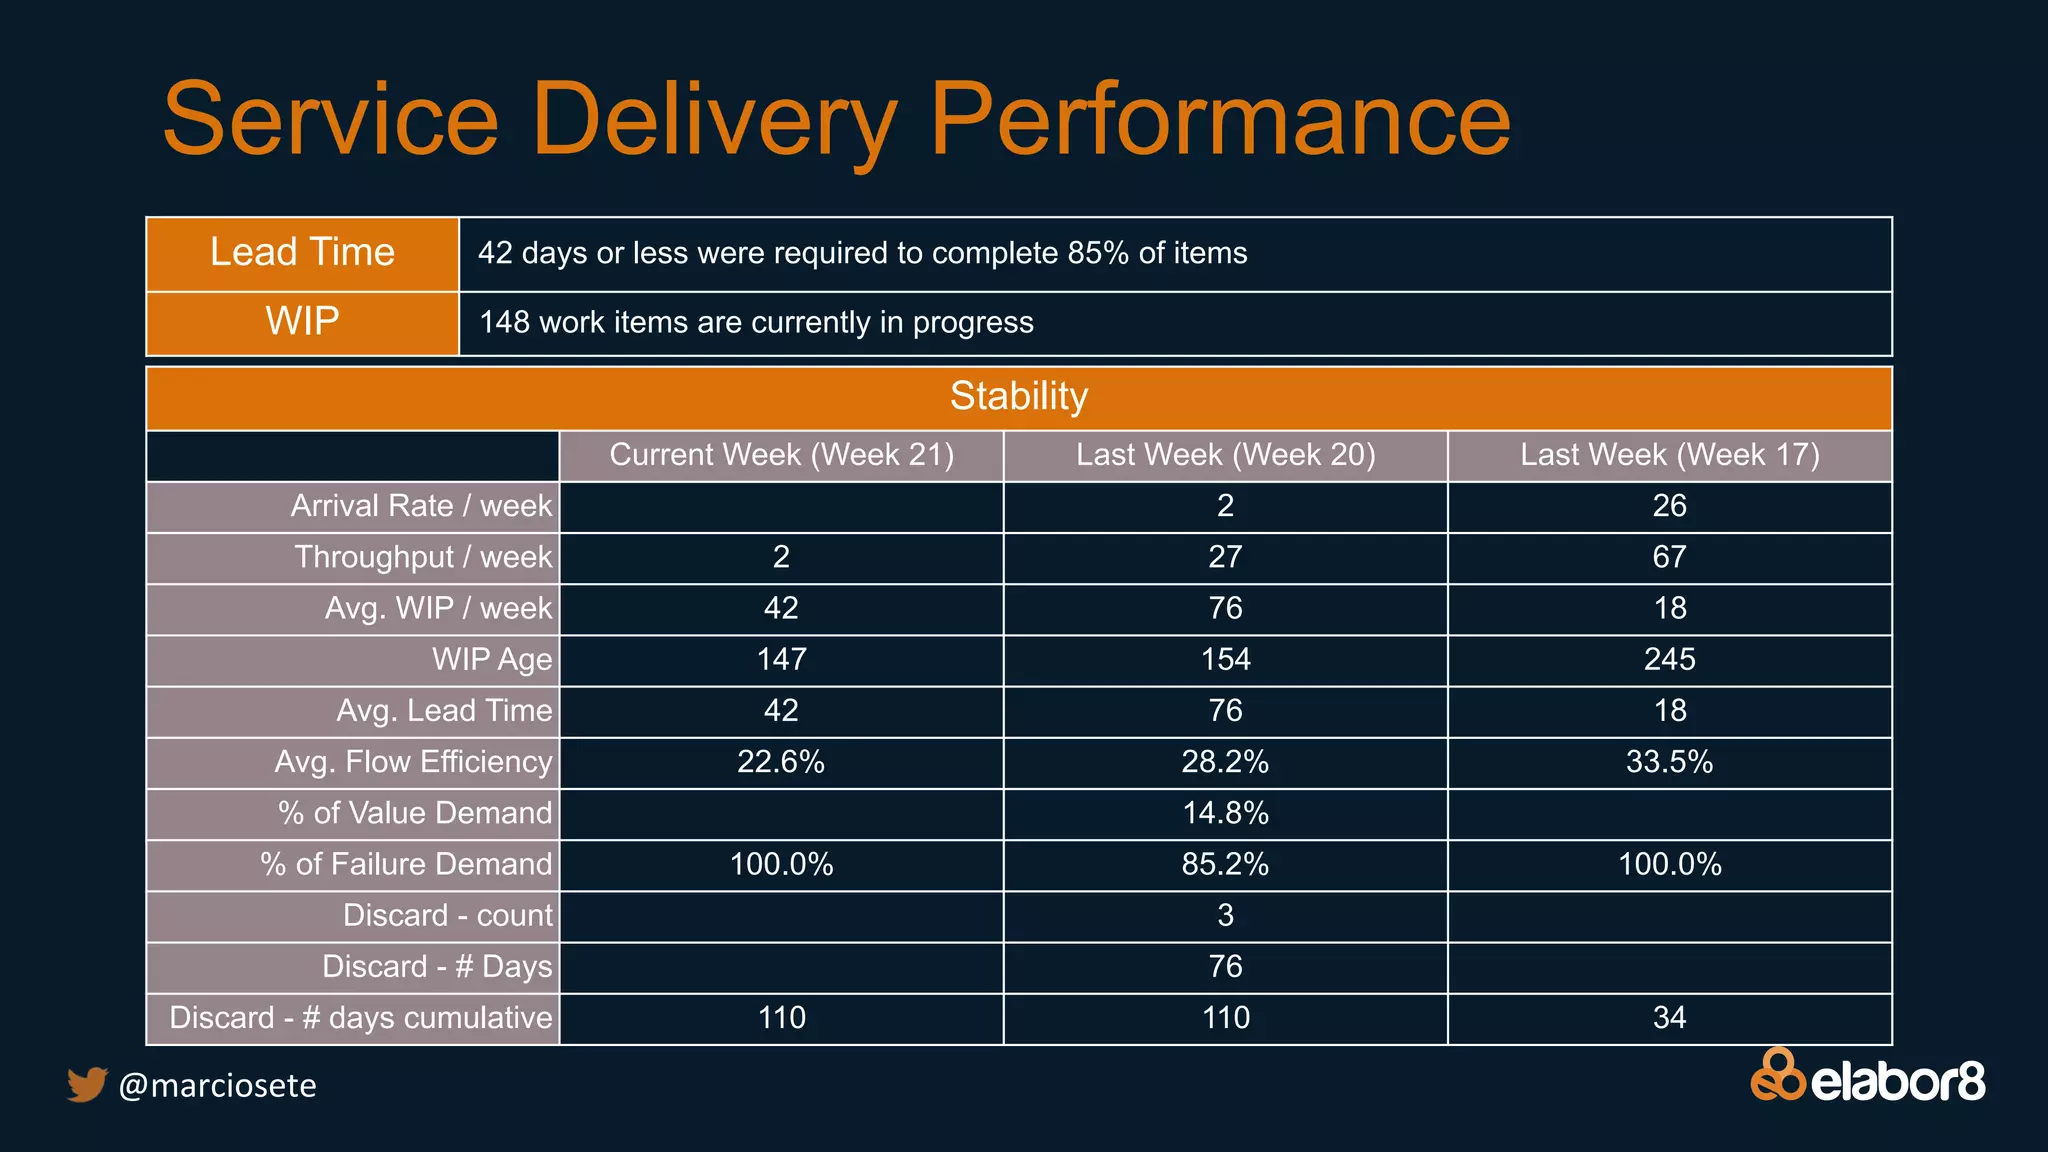

This document profiles Marcio Sete, a principal consultant who provides metrics and analytics to improve predictability and flow for organizations. It lists the types of flow metrics and analytics Marcio specializes in, such as lead time, work in progress (WIP), throughput, flow efficiency, and quality metrics. The document also includes a sample dashboard showing current and historical data on metrics like arrival/departure rates, average WIP, lead time, and flow efficiency for a client.


![[Talk] Manage flow - Metrics and Analytics for predictability and flow](https://cdn.slidesharecdn.com/ss_thumbnails/lkna-manageflow-metricsandanalyticsforpredictabilityandflow-190527041051-thumbnail.jpg?width=640&height=640&fit=bounds)


![Estimativa, planejamento e progresso [sob uma visão ágil]](https://cdn.slidesharecdn.com/ss_thumbnails/agileestimatingandplanning-110830082441-phpapp01-thumbnail.jpg?width=640&height=640&fit=bounds)


