3. 3
1.1iINTRODUCTION
Customeriareitheikingiandiwithoutisatisfactionicustomeriperceptioniitiisiaimarketingicon
ceptithatiencompassesiaicustomersiimpressioniawarenessiaboutiaicompanyioriitsioffering
icustomeriperceptioniisitypicallyiiaffectedibyiadvertising
,veviewes,public, relations, social media, personal experiences and other channels
Customer perception refers to the method by that a client choose organizes and interprets
info stimuli input to creat a meaningfullpiture of the perception.
Theimanneriofianalyzingiclientiperceptioniweiwilliclearlyiunderstoodiwhatiquantityiaifir
mitreatsiitsiclient.iwhat'sitheistandardiofitheiriproductiisiiticapableitoiserveitheidynamici
desiresi{oficlients|oficonsumers|ofishoppers}iwhat'sigoingitoibeitheirifutureiiniwhatiman
neritheyihaveitoipromotingichangesiwithinitheinewiproductioficustomeriperception.
TITALiOFiTHEiSTUDY
“AiStudyioniperceptionioficustomeriaboutinewiproductiofiMYMUL”i
1.2 OBJECTIVES OF THE STUDY .
Increaseitheistandardiofitheimerchandise.i
Toiofferihigheriservicesitoitheishoppers.
Producer’siqualitativeiandiqualitativeiproduct.
Toiapprehendicustomersiwouldilikeiandiwands.
ToirecommenditheiclientisatisfactioniachivedibyitheiMYMUL.
Toianalysesiandicompareitheivariousibrandsiofferediwithinitheimarket.
1.3 SCOPE OF THE STUDY
Theiaimi{ofipromoting|ofiselling|ofipromoting}imanageriisitoiformiperceptionitargeticlien
tidesiresiandineedsiprojectiaimiisitoiproduceitruthfuliinfoitoiMYMULiregardingitheiclienti
ofiperceptioniwithinitheinewproductithisistudyicanialteritheorporateitoiachieveiinsightonit
heiareasiwhereverit'sitoiformienhancementsithusibecauseiitiincreasetsisalesimarketingshar
eiandiclientiacceptance
Asitheistudyihelpsiiniknowingitheiextentiofiperceptioniclientiandisoiit'diusefuliforitheiman
agementiiniobtainingitheiclcusiforidevelopinginewiproductioptionsidynamiciratesipacking
etc………
4. 4
1.4 WOULD LIKE FOR THE STUDY
Managementihasitoiapprehendi{theiclients|theipurchasers|theishoppers}ipreferenceiinfoiisi
orderitoirequireisoundichoicesisurveysioniclientipreferenceiwilliofferifavorableioriunfavor
ableiresultihowevericonveyanceiainembersiofiadvantagesitoimanagementiaistudyioniclient
iperfectioniofitheiorganizationiandibehavioriofitheiclientitheistudyiofiperceptioniindicatesit
heiexpectationsiofitheicustomeri.customeriperceptionihelpsitoiknowitheiloyaltyiofitheiclie
ntitowardsitheimerchandisei.theimanagementifindsiaidoableithanksitoifulfillitheiexpectatio
nioficlientiandiattractsinewiproductinewiclienti.i
1.5 LITERATURE RESVIEW
• Aakeri-
2000iassesithaticompleteiawarenessiplaysianiimportantiroleiiniclientiperceptioniparticularl
yionceitheirishoppingiforipatterniisn'tioutlinedi.brandedithingsiprovidesitheisensationiofifa
miliarityiparticularlyiisilowiinvolvementiproductiexampleisoapsi
• NandagopalaiandiChinnaijan-
2003ieoncludeithatitheifabricatedifromipurchaseiofiproductiadditionallyieffectingishoppin
giforipatternitheniperceptionioficlient.
• VanniarajaniandiKubendran-
2005idescribeithaticlientiandiusageiofianyiproductimayibeimodifiediasiairesultiofiamendm
entiwithinitheiproportioniofifinancialigainispentioniconsumptionishutiini.theicrbaniclientila
rgelyilikeibrandediproductiasicompareditoiruraliclient.
1.6 ANALISYS METHODOLOGY
Theisuccessiofianalysisistudyidependsionitheimethodologyiadoptediforitheistudyimethodol
ogyimeansithatitheianalysisiofitheiprinciplesioriprocedureiofiinquiryiduringiaispecificiasiai
resultiofitheiscienceiofiwaysiemployedibyitheiresearchesitoigatherianalyzeiandigiftitheidat
a.Methodologyinotisolelyigroupingiinfoihoweveriadditionallyireinvigoratedithroughitheifi
rstiandisecondaryiinformationiinterviewingiclientiandidiscussioniwithitheipersonnelresear
chingipastirecordsi,filesiofitheiorganizationijournalsibook.
8. 8
2.2 STARTING PLACE OF THE ENTERPRISE
iiiiiiiiiiiiTheigroupi“marketimilk”irefersitoifluidientireimilkithatiisiboughtitoiindividuali
commonlyiforidirecticonsumptionsi,asiaimajoricompanyi,itheimarketplaceimilkiindustry
iisioficomparativelyilatestifoundationieveniinievolvedidiaryiinternationalilocationsisuchi
asialthoughihistoricaliwrittenireportirecordimilkiasianiimportantifood,iit’siprocessingian
didistributioniasiaiseparateiindustrialienterpriseididinotibroadeniinithoseinationsitillithei
awarenessiofipopulationiinitheicitiesireachediaihighileveliwithinitheimiddleiofithei19thi
century.
IniIndiaidairyingihasibeenipracticediasiiairuralicottageiindustryiforitheireasonithatifarifl
ungiibeyondi.Semiiindustrialidairyingicommencediwithiestablishmentiofiinavyidairyifar
msiandico-
operativeimilkiunionsiatisomeipointiofitheicountryitowardsitheiquitiofnineteenthicentur
yi,buti,marketplaceimilkigenerationicanibeiconsidereditoihaveistartedioutiini1965,iwithi
theifunctioningiofitheiprimaryidairyiofiAareyimilkicolonyiandimilkiproductiini1956iwit
hitheiestablishediorderiofiMYMUL.
Inievolvediiboldicountriesiwhichiincludesiamerica,itheiyri1850iisiseeniasitheidividingia
mongifromiandifactory-
scaleiproducti.numerousimanufacturingfacilityimakecontributiontoithisvariationiinithose
imatter
2.3 INTRODUCTION
Mysore Milk Union constrained (MYMUL) is a co-operative Milk Union completely
owned and controlled by means of milk production unit in Mysore and Chamrajanagar
districts of Karnataka kingdom. on the grounds in 1987, the union is constantly working
hard to further the dairy improvement and advertising and marketing activities in its milk
shed vicinity.
2.4 IMPORTANCE OF MILK:
Milkiisinature’sibestimealsiforiinfantsiandidevelopingiyoungsters.iTheiimportanceiofimi
lkiiniouriweightilossiprogramihasibeenidiagnosedionitheigroundsithatiVediciinstances,ia
ndiallicutting-edgeiresearchihasisimplestisupportediandireinforcedithisiview.iInitruth,ii
10. 10
assessment OF INDIAN DAIRY enterprise
Milk production is vital in India, as milk is one of the predominant resources of protein
and calcium for a large vegetarian populace. Dairying offers a livelihood for more than
72 million Indian farmers in addition to a further earnings for a massive variety of rural
families. it's also a way for girls to take part inside the economic activities within the
rural regions. In 1999 India became the largest manufacturer of milk by and large due to
the efforts of the co-operative movement initiated by means of the country wide Dairy
improvement Board (NDDB). presently, there are 70,000 villages’ co-operative societies
that is spread over 200 districts of 22 states. every nation has their separate co-operative
dairy federations and each district have their very own district milk producers union.
total farm animals populace in India stood 313 million on October 2000, which counts as
the most important populace of livestock in the world. maximum of the livestock here
are milk cows and milk buffaloes. The milk manufacturing in India bills for extra than
11. 11
Indian dairy enterprise is expanding in an wonderful pace with a variety of opportunities
beforehand. today India is one of the top maximum milk producing kingdom with least
cost. So, it has got an advantage of its low fee and excessive milk production inside the
us of a. besides that, the city marketplace for milk and milk products is rising at
whooping 33% per annum.
2.5iINDUSTRIALiBACKGROUND
Dairyingiprioritoioperationiflood:iTheiearliestiattemptsiofidairyidevelopmenticanibeitrac
edibackitoiBritishirule,iwhenitheiDefenceiDepartmentiestablishedimilitaryidairyifarmsito
iensureitheisupplyiofimilkiandibutteritoitheicolonialiarmy.iTheifirstiofitheseifarmsiwasis
etiupiiniAllahabadiini1913;isubsequentifacilitiesiwereiestablishediatiBangalore,iOotacam
undiandiKarnal.iTheseifarmsiwereiwellimaintained.iAsianimalsiwereirearediunderifarmic
onditions,isomeiherdiimprovementiwasimadeiusingiartificialiinsemination.iThisiapproach
ididinotihaveianyiimpactionitheisupplyiofimilkitoiurbaniconsumers,iwhichiwasiofimajori
concernitoicivilianiauthoritiesibutilessiimportantitoitheimilitary.iiWithitheigrowthiofithep
opulationiiniurbaniareas,iconsumersihaditoidependionimilkivendorsiwhoikepticattleiinith
eseiareasiandisoldimilk,ioftenidoor-to-
door.iAsiairesultiseveralicattleishedsicameiintoiexistenceiinidifferenticities.
Toisomeiextent,itheiSecondiWorldiWarigaveiimpetusitoiprivateidairiesiwithimodestlyim
odernizediprocessingifacilities.iInitheicitiesilikeiBombay,iCalcutta,iMadras,iandiDelhiian
diinisomeilargeitownships,iprocessedimilk,itableibutteriandiicecreamiwereiavailable.
iPolson’s,iKelventersianditheiExpressiDairyiwereisomeiofitheipioneeriurbaniprocessingi
dairies.iTheseidairiesiwereinoticoncernediwithiimprovingitheibreediofimilkianimalsibuti
wereicontentiwithicontractingimilkisuppliesithroughimiddlemenioritheiriownistaff.iMilki
producersiasiwelliasiconsumersiwereiexploiteditoiailargeiextent.iDespiteimodernizedipro
cessingifacilities,idairyingiremainediunorganized.i
WithitheiinitiationiofiIndia’sifirstifive-
yeariplaniini1951,modernisationiofitheidairyindustryibecameiapriorityiofitheigovernment
.iTheigoaliwasitoiprovideihygienicimilkitoitheicountry’sigrowingiurbanipopulation.iInitia
ligovernmentiactioniinithisiregardiconsistediofiorganizingi“milkischemes”iinilargeicities.
iToistimulateimilkiproduction,itheigovernmentiimplementeditheiIntegratediCattleiDevelo
27. 27
MYMUL has better infrastructural facilities which makes their production process and
Business process more easier, it consists of;
MILKiPROCUREMENT
iiiiii*Milkicollectionifromifarmers.
iiiiii*Dairyico-operativeisociety.
iiiiii*Bulkimilkiproducts.
iTRANSPORTATION
iiiii*Theyihaveiprocurementigroupicontractivehicles.
iiiii*MilkiTankers.
29. 29
ib.iDistributioniTransport
iiiiii*Trucks
iiiii*iGoodsiauto
iiiiii*Mobilei
2.18MILESTOME
1955: First Dairy in Karnataka at Kudagoo.
1965: Govt. Dairy, Mysore started with 10 TLPD capacities.
1974: Karnataka Dairy Development Corporation born.
1975: Primary Dairy Coop Societies commissioned.
1975: Govt. Dairies transferred to KDDC.
1976: Mysore Coop Milk Producers Societies Union started.
1980: Processing capacity of Mysore Dairy expanded to 60 TLPD.
1983: Corporate brand name ‘NANDINI’ came into effect.
1984: KDDC transformed to KMF.
1987: Bifurcation of MysoreUnion into Mysore &Mandya District Unions.
1988: Newly expanded 60 TLPD capacities CC at Chamrajanagar.
1988: Training centre, Mysore handed over to MYMUL.
1993: Cluster AI centres started in MYMUL and first time in Karnataka.
1993: IBP prepared at MYMUL for the first time in Karnataka.
1998: Kollegala Chilling Centre commissioned.
1998: 10 TL capacities Liquid Nitrogen Storage Tank erected.
1999: ‘NANDINI SALES DEPOT’ started at Chamrajanagar.
1999: Planted trees in 10 acres land under forestry.
1999: First place at national level in construction of Smokeless Ovens.
37. 37
the customers time to define consumption activity. Consumption is started from
production ,loyalty because two different customer are involved in the first case
consumption is by the primary individual in the second case on producers might make
something that he would hot consume himself. Therefore afferents motivations and
abilitiesiareiinvolved.iPerceptioniisiaiprocessibyiwhichiindividualsiorganizeiandiinterpret
itheirisensoryiimpressionsitoigiveimeaningitoitheiriinvolvement.theirisensoryiimpression
sitoigiveimeaningitoitheiriinvolvement.
3.5iFACTORSiINFLUENCINGiNOTION
factorsinsideitheperceiver
• mindset
• motives
• interest
• experience
• Expectationi
factorswithinthescenario
• time
• paintingsiplacing
• socialisetting
elementsiinitheigoal
• Noveltyi
• Sound
• size
• heritage
• Similarity
choice
• Selectiveiperceptionientailsiipsychologicaliprinciples
• discernifloorifundamental
41. 41
The study is about the “A study on the perception of customer of new product with
MYMUL” in Mysurucity.It is based on data collection from both the primary and
secondary source. Primary data has been collected with the help of the structured
questionnaires. The sample size of the respondent selected was 50. Questionnaires was
used to collect the response of the respondent interview were also conducted with the
respondents and observation method was also used to have the better idea of the attitude
of the respondents. This survey revealed the following aspects. Gender, age, education
qualification has been tabulated below.
GENDER
Table no : 4.1
GENDER RESPONDENT PERCENTAGE
MALE 36 72
FEMALE 14 28
TOTAL 50 100
The above table shows that 72% are belongs to male respondents and 28% are female
respondents
Chart no: 4.1
From the above chart we can interpret that majority of respondents belongs to the male
category
MALE
72%
FEMALE
28%
42. 42
AGE
The age information is being collected to know which age group people uses and have
interest in MYMUL products. This information is collected in part A of the questionnaire.
Table no: 4.2
Sl no Age group Respondents Percentage
1 20-30 35 70
2 31-40 11 22
3 41-50 03 06
4 50 and above 01 02
Total 50 100
The above chart shows that clearly 20-30 years age group respondents are 70%, 31-40
age group respondents are 22%, 41-50 age group respondents are 6% and 50 and above
respondents are 2%.
Chart no:4. 2
Here we can interpret that majority of the respondents belongs to the age group of 20-31
years.
20-30
70%
31-40
22%
41-50
6%
50 and above
2%
43. 43
EDUCATIONAL QUALIFICATION
The educational qualification information is being collected to the qualification of
respondents. This information is collected in part A of the questionnaire.
Table no: 4.3
The above table shows that 14%,respondents education is up to sslc, 12% respondents
education is up to puc/diploma, 28% respondents are graduate, 46% respondents are post
graduate
Chart no: 4.3
On the basis of above analysis we can interpret that majority of respondents educational
qualification is post graduate
SSLC
14% PUC/diploma
12%
Graduate
28%
Post graduate
46%
44. 44
Occupation
The information is collected to know the occupation of the customer.
Table no: 4.4
Sl no Particular Respondents Percentage
1 Agriculture 6 12
2 Self employed 18 36
3 Professional 10 20
4 Others 16 32
Total 50 100
The above table shows that 12% of respondents are agriculture, 36% of respondents are
self employed, 20% of respondents are professional and 32% of respondents are others
factors.
Chart no:4. 4
From the above table we can interpret that majority of respondents are self employed.
Agriculture
12%
Self employed
36%
Professional
20%
Others
32%
45. 45
Monthly income
This information is collected to know monthly income of the customer.
Table no: 4.5
Sl no Particular Respondents Percentage
1 Up to 5000 11 22
2 5000-10000 8 16
3 10000-20000 17 34
4 20000-30000 4 8
5 30000-50000 4 8
6 50000 and above 6 12
Total 50 100
The above table shows that 22% of respondents up to 5000, 16% of respondents are 5000-
10000,34% of respondents 10000-20000, 8% of respondents are 10000-20000, 8% of
respondents are 20000-30000, 8% of respondents are 30000-50000, 12% are respondents
are 50000 and above.
Chart no: 4.5
.
The above chart shows that majority of respondents are earning 10000-20000 per month.
Up to 5000
22%
5000-10000
16%
10000-20000
34%
20000-
30000
8%
30000-50000
8%
50000 and
above
12%
46. 46
Do youuse nandini product?
This information is collected to know the users of nandini product.
Table no:4. 6
Sl no Option Respondents Percentage
1 Yes 49 98
2 No 1 2
Total 50 100
From the above table it is clear that 98% respondents are using nandini products. 2% of
respondents are using nandini products.
Chart no: 4.6
The above chart reveals that 98% of respondents are using nandini products.
Yes
98%
No
2%
47. 47
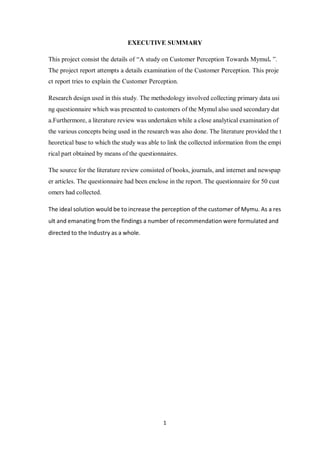
Which product of nandini do you use more ?
This information is collected to know the customer of nandini products they use.
Table 4.7
Sl.no Particular Respondents Percentage
1 Milk 45 90
2 Ice cream 03 6
3 Ghee 02 4
4 Others 00 00
Total 50 100
From the above table it is clear that 90% of respondent are using milk. 6% of respondents
are using ice cream.4% of respondents are using ghee and 0% of respondents are using
other products.
Chart no:4. 7
The above chart shows that the 90% of customers are using milk.
Milk
90%
Ice cream
6%
Ghee
4%
Others
0%
48. 48
Do you satisfied with the product of nandini?
This information is collected to know the satisfied with the nandini product.
Table no:4.8
Sl.no particular Respondents Percentage
1 Yes 48 96
2 No 2 4
Total 50 100
From the above table it is clear that 90% of respondents are agreed with the nandini
products. and 4% of respondents are disagreed with the nandini products.
Chart no: 4.8
From the above pie chart customers are satisfied with the nandini products.
Yes
96%
No
4%0%0% 0%0%
49. 49
What about the taste of the product?
This information is collected to know taste of the product.
Table no:4. 9
Sl.no Particulars Respondents Percentage
1 Good 22 44
2 Very good 26 52
3 Bad 02 4
4 Very bad 00 0
Total 50 100
The above table shows that 44% of respondents are like the taste of product is good. 52%
of respondents are like the taste of product is very good, 4% of respondents are dislike the
product. 0% of respondents are very bad opinion of product.
Chart no: 4.9
Here we can interpret that maximum respondent are like the product has very good.
Good
44%
Very good
52%
Bad
4%
Very bad
0%
50. 50
How many times you will use the product?
This information is collected to know the uses of nandini product from the customer.
Table no:4.10
Sl.no particulars Respondents Percentage
1 Daily 36 72
2 Two or three days once 09 18
3 Weekly once 03 6
4 Monthly 02 4
Total 50 100
From the above table shows that 72% of respondents are uses daily.18% of respondents
are uses two or three days once. 6% of respondents are uses weekly once and 4% of
respondents are uses monthly once.
Chat no: 4.10
From the above chart we can interpret that maximum respondents are using products
daily.
Daily
72%
Two or three
days once
18%
Weekly once
6%
Monthly
4%
51. 51
Ranking the following product?
4.11(A) MILK
This information is collected to know the ranking of the nandini products.
Table no: 4.11(A)
Sl.no Particulars respondents Percentage
1 Rank 1 41 82
2 Rank 2 03 6
3 Rank 3 02 4
4 Rank 4 02 4
5 Rank 5 02 4
Total 50 100
From the above table shows that 82% of respondents feel milk will be the first rank, 6%
of respondents feel milk will be the second rank, 4% of respondents feel milk will be the
third rank and 4% of respondents feel milk will be the fourth rank and 4% of respondents
feel milk will be the fifth rank.
Chat no:4.11
From the above chart we can interpret that maximum respondents are giving the rank of
first to the milk
Rank 1 Rank 2 Rank 3 Rank 4 Rank 5
82
6 4 4 4
Series1
52. 52
Ranking the following product?
4.11(B) CURD
This information is collected to know the ranking of the nandini products.
Table no:4.11(B)
Sl.no Particulars respondents Percentage
1 Rank 1 01 2
2 Rank 2 37 74
3 Rank 3 04 8
4 Rank 4 04 8
5 Rank 5 04 8
Total 50 100
From the above table shows that 2% of respondents feel curd will be the first rank, 74%
of respondents feel curd will be the second rank, 8% of respondents feel curd will be the
third rank and 8% of respondents feel curd will be the fourth rank and 8% of respondents
feel curd will be the fifth rank.
Chat no:4.11(B)
From the above chart we can interpret that maximum respondents are giving the rank of
second to the curd.
Rank 1 Rank 2 Rank 3 Rank 4 Rank 5
2
74
8 8 8
Series1
53. 53
the following Ranking product?
4.11(C) PEDA
This information is collected to know the ranking of the nandini products.
Table no: 4.11(C)
Sl.no particulars respondents Percentage
1 Rank 1 04 8
2 Rank 2 04 8
3 Rank 3 26 52
4 Rank 4 11 22
5 Rank 5 05 10
Total 50 100
From the above table shows that 8% of respondents feel peda will be the first rank, 8% of
respondents feel peda will be the second rank, 52% of respondents feel peda will be the
third rank and 22% of respondents feel peda will be the fourth rank and 10% of
respondents feel peda will be the fifth rank.
Chat no:4.11(C)
From the above chart we can interpret that maximum respondents are giving the rank of
three to the peda.
Rank 1 Rank 2 Rank 3 Rank 4 Rank 5
8 8
52
22
10
Series1
54. 54
Ranking the following product?
4.11(D) BADAM POWDER
This information is collected to know the ranking of the nandini products.
Table no: 4.11(D)
Sl.no particulars respondents Percentage
1 Rank 1 00 0
2 Rank 2 05 10
3 Rank 3 25 50
4 Rank 4 27 54
5 Rank 5 13 26
Total 50 100
From the above table shows that 0% of respondents feel badam powder will be the first
rank, 10% of respondents feel badam powder will be the second rank, 50% of
respondents feel badam powder will be the third rank and 50% of respondents feel badam
powder will be the fourth rank and 26% of respondents feel badam powder will be the
fifth rank.
Chat no:4.11(D)
From the above chart we can interpret that maximum respondents are giving the rank of
three to the badam powder.
Rank 1 Rank 2 Rank 3 Rank 4 Rank 5
0
10
50
54
26
Series1
55. 55
Ranking the following product?
4.11(E) LASSI
This information is collected to know the ranking of the nandini products.
Table no: 4.11(E)
Sl.no particulars respondents Percentage
1 Rank 1 04 8
2 Rank 2 03 6
3 Rank 3 11 22
4 Rank 4 06 12
5 Rank 5 26 52
Total 50 100
From the above table shows that 8% of respondents feel lassi will be the first rank, 6% of
respondents feel lassi will be the second rank, 22% of respondents feel lassi will be the
third rank and 12% of respondents feel lassi will be the fourth rank and 52% of
respondents feel lassi will be the fifth rank.
Chat no:11(E)
From the above chart we can interpret that maximum respondents are giving the rank of
fifth to the lassie.
Rank 1 Rank 2 Rank 3 Rank 4 Rank 5
8 6
22
12
52
Series1
56. 56
Nandini product are famous for what?
This information is collected to know the famous product of the nandini.
Table no : 4.12
SL no Particular Respondents Percentage
1 Milk 45 90
2 Ghee 01 2
3 Sweets 03 6
4 Others 01 2
Total 50 100
From the table above 90% of respendentsis agreed milks is the famous product.2% of
respondents are agreed ghee is the famous product. 6% of respondents are agreed sweets
is the famous product and 2% of respondents are agreed others.
Chart no: 4.12
From the above chart we can interpret that maximum respondents are agreed the milk is
famous product.
Milk
90%
Ghee
2%
Sweets
6%
Others
2%
57. 57
Which brands of milk product do you always buy?
This information is collected to know the which brand is customer going to buys.
Table no: 4.13
Sl
no:
particular Respondents Percentage
1 Nandini 48 96
2 Arogya 00 00
3 Jersy 00 00
4 Others 02 4
Total 50 100
From the above table 96% of respondents are agreed brand of nandini. 00% of
respondents are agreed brand of arogya . 00% of respondents are agreed brand of jersy
and 4% of respondents are agreed brand of others.
Chart no: 4.13
From the above chart we can interpret that maximum respondents are going to buy
nandini products.
Nandini
96%
Arogya
0%
Jersy
0%
Others
4%
58. 58
On average how much do you spend on buying milk product per month?
This information is collected to know how customer spends money per month to buy
nandini product.
Table no: 4.14
Sl no. Particular Respondents Percentage
1 10-500 16 32
2 500-1000 29 58
3 1000-2000 03 6
4 2000 above 02 4
Total 50 100
From the above table 32% of respondents are spend 10-500 rupees for buying milk
product. 58% of respondents are spend 500-1000 rupees for buying milk product .6% of
respondents are spend 1000-2000 rupees for buying milk product and 4% of respondents
are spend 2000 above for buying milk product.
Chart no: 4.14
From the above chart we can interpret that maximum respondents are spend money up to
500-1000 rupees.
10-500
32%
500-1000
58%
1000-2000
6%
2000 above
4%
59. 59
Where do you usually buy the product?
This information is collected to know the usually buy the nandini product.
Table no: 4.15
Sl no. Particular Respondents Percentage
1 Super market 6 12%
2 Retail store 18 36%
3 Provisional store 15 30%
4 Others 11 22%
Total 50 100
Fromitheiaboveitablei12%iofirespondentsiareibuyingimilkiproductiinisuperimarket.i36%
of respondents are buying milk product in retail store .30% of respondents are buying
milk product in provisional store and 22% of respondents are buying milk product in
other stores.
Chart no: 4.15
From the above chart we can interpret that maximum respondents are going to buy in
retail store.
Super market
12%
Retail store
36%Provisional
store
30%
Others
22%
61. 61
FINDING
A study on the perception or customer of new product with MYMUL.
The graph 1- it was found that of respond it’s are male.(it is 36% of male and 14%
female out of 100%).
It is find that graph 2-among the respondent majority of customer are under are
20-30 years.(source :-survey data .)
THE GRAPH 4- the most respondent of customer qualification is post graduation
and graduation.
The graphs 5- in among the respondent majority of customers are working to self-
employees.
the graph 6- the respondents more customer are used milk product.(45% of
milk,3% of ice cream,2% of ghee and 0% of others)
In the graph 7-revels of more customer are used nandini products only.
In the graph 8- the more customer are agree to nandini products is very good taste
compare to other products.
If the graph 9-revels that most of customers satisfaction nandini products 48% and
only 2% in not satisfaction this products.
If the graph11-relovence more customer use to this product only.
If the graph 15-revals more customer are buying nandini products (48% of nandini
0%of arogya,0% jersey ,2% of others.)
The graph 16- most customers buying the milk products every month spend 500 to
1000 rupees.
If it in that customer are purchased to nandini products to provisional stores.
That suggestion to improve as nandini products are clean that expect quality
remain contributes need improvement.
62. 62
SUGGESTON
Customer are using MYMUL products have distributed income and the products
must perception each of them.
Most of them using MYMUL products from 17-16 years, they are loyal and
company must build and improve the quality to retain them.
30 percentage of the respondent say that the quality of the MYMUL milk and its
products is an average; the company should convert them into level of dis-
perception and more perception.
form the survey it shows that 55 percent and 45 percent of the respondent are
become awareness of the MYMUL products through advertisements and
company switch on to other suitable channel of communicated to reach the
customer.
AsiperisurveyibeingimadeipopularizediofiMYMULiproductsiisimoreithanicompa
reditoiotheriexistingiiniorderitoisurviveiiinitheimarketiaggressiveiadvertisingihasi
toibeiundertaken.
must not be a change in price in a short period.
Regular supply is also one of the important problems, so more distribution
centers and parlors can be opened wherever is necessary to ensures regular
supply.
Respondents are more dis- perception with leaked so company comes to know the
reason for it and avoid that leakage problem.
Regular customer can be provided with special offers and discount on the basis of
daily purchase of MYMUL products in order to build brand image.
Specialiofferimayibeiprovideditoidealeriandiretaileriiniorderitoimotivateitoithemi
saleimore,iAndimoreiproducts.
Company can open special counter inside supermarket like –mal of Mysore,
bigbajore, loyal world and more.
63. 63
CONCLUSION
The report was an endeavor to find the customer perception towards MYMUL
and its products the study was tried not only know the customer perception towards
MYMUL and its products but also towards the next preference of the customers as
substitute of MYMUL.
The study was successful in identifying and classifying the customers from
different start in the society and their perception level it was also found out the different
demand and the constraints regarding quality, reach worth packaging etc. Statistical to
and marketing research tools were implemented to find out the customer perception
The study also gives insight about the perceived performance and expectation
which creates an emotional bond with the brand also result in high customer loyalty
MYMULicompleteiincorporatesiaisensibleiimage.
WithinitheimarketimajorityiofitheipatronisquareimeasureivictimisationiMYMUL.iMYM
Ulimerchandiseioutithereionitimeitoitheiclientiforitheidailyiuseiwithinitheimarketihighest
iqualityimilkiiniMYMUL.iMYMULicompleteihasisensibleipositioniwithinitheimarket.iC
ustomersihaveisensibleigapiregardingitheiMYMUL.iMilkimerchandiseiholdisensibleimos
tiofiallirespondentsihaveiseeniMYMULimilkiadvertiinitv.iadvertiplaysiaiVitoliroleiinima
kingicompleteiimageiandiitihelpsiiniincreasingitheisale.
“CUSTOMER PERCEPTION “is an extraordinary factor to full fill the customer’s
requirement.