SlideShare a Scribd company logo
1 of 126
Download to read offline
The European Club Footballing Landscape
Club Licensing Benchmarking Report
Financial Year 2016
2
Club Licensing Benchmarking Report: Financial Year 2016
Foreword
Welcome to the ninth edition of the UEFA Club Licensing Benchmarking Report, which once again focuses on financial and other off-the-pitch developments
in European club football.
In this latest edition of our report, the success story of European football stands out once more. It shows that UEFA’s regulatory role in financial fair play
continues to steady the ship of European football finances and provide a basis for unprecedented growth, investment and profitability. It also
demonstrates that while the game remains essentially the same on the pitch, it continues to change significantly off the pitch, making it essential that
we at UEFA and our other stakeholders continue to remain vigilant and true to our values.
This detailed report shows that the positive revenue, investment and profitability trends identified in last year’s report are continuing. The underlying
health of European club football is highlighted, with the 700 top-division clubs together generating the highest operating profits before transfers in history
and year-on-year revenue growth of almost 10%. Clubs are generating revenue but they are also investing in assets and infrastructure, thanks in part to
UEFA’s financial fair play regulations. For the first time, club investments in stadiums and other long-term fixed assets exceeded €1bn in 2016. It is
therefore perhaps not surprising that an increasing number of national associations and leagues, both inside and outside Europe, are starting to implement
their own versions of financial fair play.
The data from this report and other research from our new intelligence centre helps inform our decision-making. Once more, we cannot help but note that
the polarisation of commercial and sponsorship revenues between the top tier of clubs and the rest is accelerating. The top 12 ‘global’ clubs generated a
dramatic increase in commercial and sponsorship revenues of €1.58bn in six years – more than double the increase of all other European top-division clubs
combined. As the guardians of the game, UEFA must ensure that football remains competitive even as financial gaps are augmented by globalisation and
technological change.
Reflecting the objective of financial fair play to bring ever greater transparency to European football, this report once again provides fascinating, forensic
details on clubs from all 55 UEFA member associations. It also provides some food for thought, analysing the record transfer activity that we saw in the
summer 2017 transfer window, highlighting the significant level of agent commissions and agent concentration, looking at multi-club ownership, and
comparing the major clubs’ social media reach with that of their star players.
We would like to thank all the national associations, leagues and clubs that contributed their financial information and the whole club licensing network
for their invaluable assistance.
Aleksander Čeferin
UEFA President
3
4
Introduction
For other industries changes in the landscape are accepted as an inevitable fact of life. However for
European football, with its unique, stable model of more than a thousand professional football
clubs, a direct connection from the grassroots to the professional game and the importance of
mutual cooperation and competition between clubs, changes to the landscape can bring
challenges.
This report includes the traditional analysis of attendance trends, domestic league structures and
club finances based on data provided directly to UEFA and more than 500 follow-up clarifications.
In addition, highly topical new subjects are discussed, such as a comparison of clubs’ and players’
social media footprints, an analysis of football agent commission rates and agent concentration
across leagues, the overlap between the 2017/18 league start and transfer window end, and the
increase in both cross-border and multi-club ownership.
Club sponsorship is presented from various angles, with revenues divided into sponsor types, shirt
prices compared, the different types of shirt sponsorship analysed and the ultimate sources of shirt
sponsorship researched by industry.
Within the last year, the UEFA Executive Committee has approved the creation of a new strategic
research unit – a UEFA intelligence centre – which is made up of data scientist, an econometricist, a
statistician and a rights advisor, who together combine specific technical expertise with in-depth
knowledge of the football landscape. The primary objective of the intelligence centre, which is part
of the Financial Sustainability and Research division and reports to the UEFA General Secretary, is
to provide balanced strategic research insights to inform the policy-making and decision-taking of
football’s key stakeholders. The production of this report now falls within the competence of the
UEFA intelligence centre and continues to contribute to one of the existing objectives of club
licensing and financial fair play, namely to increase transparency in the off-pitch workings of
European.
This report would not have been possible without the considerable input and support of a great
many national licensing managers and clubs and numerous colleagues to whom we extend our
thanks.
Sefton Perry
Head of the UEFA Intelligence Centre Analytics
The European Club Footballing Landscape continues to be the authoritative review of European
club football, on the one hand providing a granular guide to club football across all 55 UEFA
member associations and on the other hand identifying and documenting many of the important
trends of our time.
Since the first report published in 2007 we have tried to document and present the landscape of
European club football without excessive editorial control. We present the facts – some positive
and some less so. This has been acknowledged by all the major football stakeholders who rely on
the publication as a definitive guide to off-pitch developments in club football.
The success story that is European club football is apparent from the facts contained over the next
120 or so pages. Few, if any, activities come close to matching the continuous 10% year-on-year
growth in revenues that European club football has generated since the turn of the century. This is
a testament to the underlying strength and depth of existing supporter loyalty and the ability of
clubs to reach out to new supporters. Everything depends on this: the continuing growth in TV
revenues and the accelerating growth in sponsorship and commercial partnerships are all business
arrangements predicated on accessing the end ‘customer’, namely the huge pool of football
supporters.
While the ultimate source of club revenue remains essentially the same, the twin forces of
technology and globalisation are leading to an unprecedented reshaping of the club football
landscape. Only a limited number of clubs are able to fully exploit the enormous commercial
opportunities offered by the global market. These clubs are opening offices across the world,
introducing new categories and tiers to their commercial partnerships and using technology to
offer tailored access to their supporters and expand the brand of both the clubs and their partners.
This report covers the financial developments of 681 top-division clubs across more than 50
leagues and documents the growing financial polarisation between clubs and their diverging
business models. While uplifted TV contracts have generated 86% of revenue growth this decade
for all but the largest clubs in the top six leagues, and UEFA club competition prize money and
solidarity payments have provided 50% of all revenue growth for clubs outside the top six leagues,
it is sponsorship and commercial revenues that have driven the revenue growth of the top dozen
European clubs, contributing 55% of all their new revenue since 2010.
Club Licensing Benchmarking Report: Financial Year 2016
5
Competitions
and supporters
Ownership Sponsorship
AgentsTransfers
Wages Profitability Balance sheets
Revenues
Operating costs
7
Domestic competition and supporter highlights
League formats and recent changes across Europe
UEFA coefficients over the decade
European attendance levels
Social media profiles
European club websites
Contents
Domestic competitions and supporters
Sponsorship
Foreword
Ownership
Ownership highlights
European club ownership
Foreign ownership
Multi-club ownership
3
9
10
12
13
16
18
20
21
22
24
8
27
19
1
3
4
2
Transfer highlights
Transfer spending
Transfer windows
Transfers
5
36
37
38
42
Agents
Agent highlights
Agents’ commissions
Agent representation
45
46
51
44
Club revenue highlights
European club revenue growth
European club revenue levels
Broadcasting revenue
Revenue from UEFA
Gate receipts revenue
Sponsorship and commercial revenue
Revenue mix
Club revenues 54
55
56
59
64
68
70
73
77
6
Wage and squad cost highlights
Wage growth
Wage levels
Breakdown of wages
Wage and squad costs 80
81
82
84
87
Sponsorship highlights
Kit manufacturers
Principal sponsors
Sleeve sponsors and stadium naming rights
28
29
32
35
7
OVERVIEW
Introduction 4
Operating and transfer cost highlights
Transfer costs and income
European club operating costs
Operating and transfer costs 90
91
92
95
8
Profitability highlights
Profitability trends
Underlying operating profitability
Bottom-line profitability
Underlying and bottom-line profitability 99
100
101
105
108
9
Balance sheet highlights
European club assets
European stadium ownership and investment
Player assets
Net debts
Appendix
Balance sheets 112
113
114
115
119
121
125
10
Club Licensing Benchmarking Report: Financial Year 2016
7
Domestic competitions and supporters
1
8
9
Club Licensing Benchmarking Report: Financial Year 2016
Domestic competition and supporter highlights
22 European clubs’ websites now receive over a million monthly visitors, with the
percentage of foreign visitors ranging from 91% (FC Barcelona) to 5% (Galatasaray SK)
Four leagues (in Georgia, Greece, Kazakhstan and Moldova)
have changed their competition structures for 2017/18
CONTENTS OVERVIEW
League attendances decreased in 2016/17 in 62% of leagues,
reversing some of the 2015/16 attendance increases
CONTENTS OVERVIEW
Number of clubs in top division
20
18
16
15
14
12
10
8
6
ENG, ESP, FRA, ITA
GER, NED, POR, TUR
BEL, BLR, CZE, GRE, NOR,
POL, RUS, SRB, SWE
SMR
BUL, CYP, DEN, ISR, LUX,
MLT, ROU
BIH, FIN, HUN, IRL, ISL, KAZ,
KOS, MDA, NIR, SCO, SVK,
UKR, WAL
ALB, AUT, CRO, EST, FRO, GEO,
GIB, MKD, MNE, SUI, SVN
AND, AZE, LTU, LVA
ARM
Changes in number of clubs participating in top
division (2015/16 to 2017/18)
Compared with 2015/16, the total number of top-division clubs in Europe has
fallen by five, continuing the long-term downward trend. Malta increased its top
division from 12 to 14 clubs, with Ukraine doing the opposite. Moldova increased
from 11 to 12, while Montenegro reduced from 12 to 10. Georgia introduced the
most radical change, reducing its top division from 14 to 10 clubs. This brings the
total number of clubs in all 55 European top-division leagues to 713 clubs.
UKR
MDA
MLT
MNE
18
16
14
12
10
8
6
AZE
BIH
ARM
LTU
LVA
GEO
BLR
BUL
DEN
League formats and recent changes across Europe
10
CHAPTER 1: Domestic competitions and supporters
Changes in the scheduling of championships are rare but
Moldova, much like Georgia in 2015/16, is running a spring to
autumn season to transition from a winter to summer format,
making it the 12th country to introduce a summer
championship. Kosovo, this year’s newcomer to the European
club footballing landscape, is among the 43 countries
following the winter model.
Summer championship
Winter championship 43x
12x
TWO rounds (17)
BLR
CZE
ENG
ESP
FRA
GER
GRE
ISL
ITA
LUX
MDA
NED
NOR
POR
RUS
SWE
TUR
FOUR rounds (10)
ALB
AUT
AZE
CRO
EST
GEO
LVA
MKD
SUI
SVN
BEL
BIH
BUL
CYP
DEN
ROU
UKR
WAL
THREE rounds (10)
FIN
FRO
GIB
HUN
IRL
KAZ
KOS
MLT
MNE
SVK
NIR
SCO
SMR
POL
SRB
ISR
Split TWO
& TWO (8)
Split TWO &
ONE (2)
SIX rounds (1)
ARM
No league,
only cup (1)
Basic format of domestic top-tier leagues
(summer 2017 and winter 2017/18 seasons)
Four leagues have made significant adjustments to their competition formats. Georgia
has moved from a transitional format of two groups of clubs each playing 12 matches
to a league in which 10 teams play four rounds. Similarly to Georgia, Moldova
introduced a transitional season in 2017 in which 10 teams play each other twice.
Kazakhstan has moved to a traditional format with three rounds instead of a split-
season format. Lithuania is now the only country to play four rounds before going to a
final championship round, while Greece has kept its same basic format but removed
the post-season play-off for European competitions.
A total of 38 leagues (69%), including the most well-known leagues with global
audiences, can be described as traditional, with each team playing each of the other
teams twice (17), three times (10), four times (10) or six times (Armenia).
The other 17 leagues adopt a different approach, splitting their teams into groups
based on their rankings at a specific point in the season. The country trigrams of these
leagues can be found overlapping two or more circles, indicating how many rounds are
played before and after the leagues split.
Split THREE
& TWO (1)
Split THREE
& ONE (2)
COMPLEX (2)
LIE
AND
Split FOUR
& ONE (1)
LTU
11
Club Licensing Benchmarking Report: Financial Year 2016
CONTENTS OVERVIEW
Four leagues changed domestic league structure for 2017/18
Trends over the last decade
The trends in the top 10 tend to be more stable than lower down the
table, where one good series of results by a club can make a significant
difference to the country’s average coefficient. Nonetheless, the
reversal of France and Germany in 3rd and 4th place was highly
significant at the time, as a fourth spot in the UEFA Champions League
changed hands as a result. The most dramatic fluctuation in the top
half of the rankings is Romania’s rise to 7th place in 2008, its
subsequent fall from from 8th in 2010 to 22nd just two seasons later,
and its recovery to 15th place.
UEFA club and country rankings reflect the average results of clubs over
the last five seasons and can therefore provide a good indication of
trends and the relative success of clubs from each country in UEFA club
competitions over time.
Lithuania is the country that has lost the most ground over the last
decade, dropping 15 places from 33rd in 2007 to 48th in 2017. The
other big decliners are Scotland, who have dropped 13 places to 23rd
place, and Romania, Bulgaria and Latvia, who have all fallen 10 places
to 17th, 27th and 41st place respectively.
The three biggest climbers over the past decade are Belarus, who have
moved up 21 places to 19th place, and Azerbaijan and Kazakhstan, who
have both moved up 16 places to 26th and 29th place respectively.
The rise and fall in UEFA
coefficients over the decade
Change
ESP
GER
ENG
ITA
FRA
RUS
POR
UKR
BEL
TUR
CZE
SUI
NED
GRE
AUT
CRO
ROU
DEN
BLR
POL
SWE
ISR
SCO
CYP
NOR
AZE
BUL
SRB
KAZ
SVN
SVK
LIE
HUN
MDA
ISL
FIN
ALB
IRL
BIH
GEO
LVA
MKD
EST
MNE
ARM
LUX
NIR
LTU
MLT
WAL
FRO
GIB
AND
SMR
KOS
ENG
ESP
ITA
FRA
GER
RUS
ROU
POR
NED
SCO
TUR
UKR
BEL
GRE
CZE
SUI
BUL
NOR
DEN
AUT
SRB
ISR
SWE
SVK
POL
HUN
CRO
CYP
SVN
FIN
LVA
BIH
LTU
MDA
IRL
MKD
ISL
GEO
LIE
BLR
EST
AZE
ALB
ARM
KAZ
NIR
WAL
FRO
LUX
MLT
AND
MNE
SMR
GIB
KOS
12
CHAPTER 1: Domestic competitions and supporters
CONTENTS OVERVIEW
European attendance levels broadly stable
The 2016/17 attendance figures of top domestic leagues totalled just under a
hundred million. Compared with 2015/16, total attendances were down 1%,
primarily due to the mix of clubs promoted/relegated in England and
Germany. Attendances were generally stable across Europe, with 18
countries reporting a year-on-year change of less then 5%. While five leagues
reported a significant increase of more than 15%, there were eight leagues,
all in eastern Europe, that reported a notable decrease of more than 15%.
Attendance figures will continue to be monitored carefully by the UEFA
Intelligence Centre, since the number of people attending matches is a
simple but significant indicator of the health of club football.
5xIncrease of 15%+
8xIncrease of 5% to 15%
18xStable (<5% increase/decrease)
Decrease of 5% to 15%
8xDecrease of 15%+
5xUnknown
11x
Aggregate match attendance trends
(2015/16 to 2016/17)
13
Club Licensing Benchmarking Report: Financial Year 2016
CONTENTS OVERVIEW
Eleven clubs enjoyed over one million league spectators
For the first time in European football, 11 clubs have reported
aggregate league attendances of over a million. New in this category
since last year are West Ham United FC, Celtic FC and Liverpool FC.
West Ham United FC, who completed a move to London Stadium,
and Rangers FC jumped into this season’s top 20, replacing
Newcastle United FC and VFB Stuttgart, who were both relegated at
the end of 2015/16.
Top 20 European clubs by
aggregate attendances (2016/17)
Top 20 clubs based on aggregate
attendances (2016/17)
Club with 2015/16 European rank by total
season home LEAGUE attendances
Average Total
1. FC Barcelona (ESP) 78,034 1,482,646
2. Manchester United FC (ENG) 75,290 1,430,510
3. Borussia Dortmund (GER) 79,653 1,354,101
4. Real Madrid CF (ESP) 69,426 1,319,094
5. FC Bayern München (GER) 75,000 1,275,000
6. Arsenal FC (ENG) 59,957 1,139,183
7. West Ham United FC (ENG) 56,972 1,082,468
8. Celtic FC (SCO) 54,726 1,039,794
9. FC Schalke 04 (GER) 60,703 1,031,951
10. Manchester City FC (ENG) 54,019 1,026,361
11. Liverpool FC (ENG) 53,016 1,007,304
12. SL Benfica (POR) 55,952 951,184
13. Rangers FC (SCO) 49,156 933,964
14. Hamburger SV (GER) 52,341 889,797
15. FC Internazionale Milano (ITA) 46,622 885,818
16. VfL Borussia Mönchengladbach (GER) 51,494 875,398
17. Paris Saint-Germain FC (FRA) 45,160 858,040
18. Hertha BSC Berlin (GER) 50,267 854,539
19. Club Atlético de Madrid (ESP) 44,710 849,490
20. AFC Ajax (NED) 49,620 843,540
14
CHAPTER 1: Domestic competitions and supporters
CONTENTS OVERVIEW
Biggest increases in average club
attendance (5,000+)
Seven clubs added 5,000 or more to their average season match
attendances between 2015/16 and 2016/17. At the top of the list is
West Ham United FC, who benefitted from their move to London
Stadium. FC Krasnodar also moved to a new venue with increased
capacity in 2016/17, with Liverpool FC also boosted by the addition of
a new tier in the main stand at Anfield.
Germany and England provide five of top ten most attended leagues
Top 10 European leagues by total
attendance (2016/17)
The Portuguese Primeira Liga is this year’s newcomer in the top 10 for
aggregate attendances, replacing the Spanish Segunda División. SL
Benfica, Sporting Lisbon and FC Porto are the main drivers of
Portugal’s average attendances, each averaging crowds of 37,000 to
56,000, compared with 2,000 to 19,000 for all other Portuguese teams.
Once again, the German Bundesliga reported the highest average
attendance of all European leagues. The Premier League ranks higher
for aggregate attendance due to its higher number of teams and
therefore matches.
The English Championship joined the English
Premier League, German Bundesliga and
Spanish La Liga in reporting aggregate
attendances of over 10 million in 2016/17.
15
Club Licensing Benchmarking Report: Financial Year 2016
CONTENTS OVERVIEW
Top 20 most followed European clubs all from ‘big6’ TV markets
Number of followers on
Last year’s report analysed the most successful official club
websites; this year we look at the most successful social media
profiles among European clubs.
Numberoflikeson
A total of 14 European clubs currently* have more than
ten million likes on Facebook. Five of these fourteen clubs
also have more than ten million followers on Twitter.
The chart on the right includes the top 20 clubs by Twitter
followers. If the top 20 had been based on Facebook likes,
Leicester City FC and Inter Milan would have replaced AS
Monaco and Olympique Marseille.
Top 20 clubs and players by Twitter
and Facebook popularity
FC Bayern have a higher
following on Facebook
than on Twitter.
* The social media figures presented in this section were collected in November 2017.
Cristiano
Ronaldo
** Both Lionel Messi (no official Twitter account) and Zlatan Ibrahimović have been included to the chart due to the high number of fans they have on Facebook.
In many cases, top players have just as large a social
media following as the clubs they play for. This is
particularly the case on Twitter. Cristiano Ronaldo, the
most popular player, has more Twitter followers than Real
Madrid CF and FC Barcelona combined (65.3 million) and
more fans on Facebook than any of Europe’s top-division
clubs (122 million).
Real Madrid CF and FC Barcelona are
much more popular on social media
than the other top European clubs.
Lionel Messi**
Neymar
Mesut Özil
Andres Iniesta
James Rodriguez
Gareth Bale
Wayne Rooney
Gerard Piqué
Radamel Falcao
Zlatan
Ibrahimović**
Sergio Ramos
Luis Suarez
Sergio Aguero
Cesc Fàbregas
David De Gea
Robin van Persie
Marcelo
David Luiz
Twelve active football players
currently list over 10 million
followers on Twitter, whereas
only five clubs have reached
this milestone to date.
Daniel Alves
16
CHAPTER 1: Domestic competitions and supporters
CONTENTS OVERVIEW
Players more popular on Twitter and clubs more popular on Facebook
17
Club Licensing Benchmarking Report: Financial Year 2016
In contrast to Twitter followings, the Facebook followings of clubs are
generally higher than that of their most followed player (15 out of 20
clubs). Whereas Neymar (Paris Saint-Germain) and Radamel Falcao
(AS Monaco), the main outliers, were more than five times more
popular on Twitter, the difference on Facebook is considerably
smaller. In aggregate terms the 20 clubs total 642 million Facebook
followers and the 20 players of those clubs total only 485 million
Twitter followers.
The Twitter following of the top player exceeds the following of
his club in the majority of cases (11 out of 20 clubs) and is
significantly higher in aggregate terms with the 20 clubs totalling
161million Twitter followers and the 20 players of those clubs
totalling 244million Twitter followers.
0.2x Same 5x 0.1x Same 2x0.5x 1.5x2.5x
The relative social media followings of clubs and their top players is further explored below. The bar charts indicate the Twitter and Facebook followings of the top 20 clubs, alongside those of the most-
followed player from each club. The line charts above, featuring the club logos, pinpoint the social media profile of each club relative to that of their most popular player.
 Club more popular  Club more popular Player more popular Player more popular 
Total Clubs: 161 million
Total Players: 244 million
Total Clubs: 642 million
Total Players: 485 million
CONTENTS OVERVIEW
Global profile of largest clubs clear from online traffic
Top 25 most popular club websites in September (in millions)
Distribution of website visitors
The clubs that generate the most visitors to their websites tend to have a broad reach that encompasses
their domestic market and other global markets. Further down the top 25, interest is clearly more
concentrated in home markets. Remarkably, FC Barcelona is the only club in the top 25 that was not
visited most by people in the country in which it plays its domestic matches, with 8.9% of visitors in
Spain and 9.5% in the USA. On the contrary, Turkish giants Fenerbahçe SK and Galatasaray SK attracted
only 4 to 5% of their website visitors from foreign markets.
In total, 22 European club websites attracted more than one million visitors in the month September. In line
with their social media popularity, Real Madrid CF had the highest number of visitors, just ahead of
Manchester United FC.
In the previous report, the success of official club websites was measured by the peak month’s visitor tally and
the average number of minutes spent on the website. This year’s report focusses on the number of visitors
recorded in September, where these visitors accessed the websites from and how.
18
The access ratios (whether visitors used desktop or mobile devices) appear to be more balanced across
the 25 club websites. Celtic FC had the lowest percentage of desktop access (24%) and Spartak Moskva
the highest (66%), its website having been accessed more by desktop devices than mobile). In general
the trend is towards increasing access from mobile devices.
CHAPTER 1: Domestic competitions and supporters
CONTENTS OVERVIEW
Ownership
2
19
Ownership highlights
Foreign owners have invested in 40 European clubs since the introduction of financial fair
play, and the percentage of foreign-owned clubs in major leagues has increased to 19%
Club ownership in major leagues is relatively stable, with only
5% of clubs changing hands in the last 12 months
More than 20 clubs in the top 15 major European leagues
are linked to multi-club ownership structures
20
CHAPTER 2: Ownership
CONTENTS OVERVIEW
European club ownership profile
European club ownership
As initiated in last year’s edition of the European Club Footballing
Landscape, the next few pages of the report will provide a high-level
summary of club ownership, ownership profiles and trends in 15 of Europe's
major leagues* (now including the Austrian Bundesliga and Greek Super
League). The analysis on this page identifies whether clubs have controlling
parties (owning more than 50% of shares) and whether the majority owners
are domestic or foreign nationals. The two following pages offer a timeline of
foreign ownership and the section ends with some examples and a timeline
of multi-club ownership in global club football.
Type of ownership
* Information sourced from a combination of club representations submitted as part of the club licensing process (March-July 2017) and UEFA desktop research (up to September 2017). ** ‘No controlling party’ in this analysis refers to no single or group of owners working in concert with more than a
50% holding in the voting share capital.
Foreign club ownership No controlling party**
ENG
ENG-2
ITA
The English Premier League (65%) and
Championship (58%) continue to top
the list in terms of foreign club
ownership.
One of the newcomers in this study, Austria, is the only country in which
no top-division clubs currently have an ultimate controlling party. This
structure is also common in Portugal, Germany, the Netherlands and
Turkey, where more than 75% of clubs have no controlling party
(predominantly associations).
The majority of the 256 clubs in this analysis have a controlling
party, although a sizeable minority do not (37%). Of the 63% that
have a controlling party, the majority have a domestic owner. A
domestic owner is the most-common form of ownership in 6 of the
15 leagues analysed (RUS, UKR, GRE, ITA, FRA and BEL).
TUR
AUTFRA
UKR
RUS
GER
SUI
BEL
POR
ESP
GRE
Club Licensing Benchmarking Report: Financial Year 2016
21
CONTENTS OVERVIEW
Ten clubs changed ownership in the 12-month period from September
2016 to September 2017. Although some were high-profile changes (for
instance in the cases of AC Milan, Southampton FC, Olympique de
Marseille and FC Basel), club ownership remains relatively stable,
affecting only 5% of the total club population in the 15 selected leagues.
NED
Nationality of foreign club
owners changing over time
22
CHAPTER 2: Ownership
* Note that this timeline only contains the milestones of current owners. If a club has been taken over multiple times in the period covered, only the latest acquisition is illustrated.
** ‘Other’ leagues in the timeline include foreign ownership in Belgium, Germany, Greece, the Netherlands, Portugal and Switzerland. Austria, Russia, Turkey and Ukraine do not appear as there is currently no foreign ownership as shown on the map on the previous page.
The club acquisitions highlighted across these
two pages are quite revealing, not least in
illustrating how the nationality profile of new
club owners has changed over the last decade.*
The most steady flow of
new foreign owners has
come from the USA, with US
owners taking over clubs in
most of the years reviewed.
By contrast, the number
of high-profile Russian
and Middle Eastern
investors has noticeably
fallen since 2008 to 2012.
CONTENTS OVERVIEW
Other**
Serie A
La Liga
Ligue 1
Championship
Premier League
23
Club Licensing Benchmarking Report: Financial Year 2016
More than 70% of all foreign takeovers in the top 15 leagues
since 2016 have involved Chinese investors. In this period
Chinese owners have taken over clubs in the Premier League,
Championship, Serie A, Ligue 1, La Liga and Eredivisie.
With Aston Villa, Wolverhampton Wanderers, West
Bromwich Albion and Birmingham City, all Birmingham-
based football clubs in the top two English divisions
have been taken over by Chinese nationals.
CONTENTS OVERVIEW
Origin of current foreign owners
The timeline also highlights the intensity of new foreign ownership
activity. After the record number of foreign acquisitions reported in 2016,
when nine clubs acquired foreign owners, five new foreign owners were
reported in 2017, which is back in line with the trend of previous years.
At least 12 private owners with interests in more than one club
24
CHAPTER 2: Ownership
The previous pages in this section focused largely on private owners acquiring a controlling stake in a football
club. The next three pages aim to give an introduction to multi-club ownership across the same 15 leagues.
The examples are split into three groups: private persons having control and/or a decisive influence over more
than one football club, entities (“related entities”) having control and/or a decisive influence over more than
one football club, and clubs having control and/or a decisive influence over other football clubs.
Several private owners of foreign origin have control or a
decisive influence over more than one football club. The
map on the right illustrates five such examples involving at
least one of the 15 leagues analysed.
Besides the listed owners and private persons with a decisive influence over more than one
football club, there are several agents reported to have an influence at more than one
football club. One such example could be the reported involvement of an agent at a Cypriot
club, in which he is listed as an investor, and Belgian club, where his relatives are listed as
the current owner and a member of the board of directors respectively.
CONTENTS OVERVIEW
Type of owner with multi-club ownership Twelve ultimate owning parties currently own one club in
the major European leagues and also have participation in
one or more other football clubs.
The second form of cross ownership involves ‘corporate
entities’. City Football Group is probably the most well-
known entity with ownership in five different continents.
Other active examples that are illustrated on the map on
the right are Red Bull, Traffic Sports, the Suning Group and
Aspire Academy.
The ‘club’ category is a relative new form of cross
ownership in which a club has control and/or a decisive
influence over another football club. The most recent
high-profile examples are Atletico Madrid and AS Monaco
acquiring stakes in the second-division RC Lens (France)
and Cercle Brugge (Belgium).
25
Club Licensing Benchmarking Report: Financial Year 2016
CONTENTS OVERVIEW
Ownership mix includes club groups and multi club arrangements
Timeline of multi-club ownership
The previous page gave some active examples of cross-ownership linked to the 15 selected
leagues. This second timeline presents an overview of multi-club ownership over time.
With the exception of Ajax Amsterdam, most
examples of cross-club ownership have emerged
in the last three years.
The selected five corporation examples on the
previous page have been involved in 26
football clubs worldwide since 1997. In
addition, this timeline includes ENIC
International Limited, who are no longer active
across different clubs. Traffic Sports and Red
Bull bought their shares more than seven years
ago, while the activities of City Football Group,
the Suning Group and Aspire Academy are
more recent.
26
CHAPTER 2: Ownership
CONTENTS OVERVIEW
The increase in foreign ownership and the basic cross-ownership models referenced in this section are some
of the numerous club ownership developments for regulators and governing bodies to consider. Following
the era of third-party player ownership, the growing influence of agents at some clubs and the acquisition of
lower-league clubs purely to facilitate transfer activity are further developments that could potentially
threaten competition integrity.
It is important for governing bodies to do at least the following three things in relation to potential club
acquisitions: identify the direct and indirect source of investment, establish whether the investors have the
means to fund both the club takeover and necessary further investment, and understand the underlying
business case and motivation(s) for the acquisition.
Sponsorship
3
27
Sponsorship highlights
The top three clubs generate more than 100 times the kit manufacturing revenue
and 25 times the shirt sponsorship revenue of smaller clubs in their league
Club kit manufacturers are surprisingly diverse, with 41 different
brands and adidas and Nike’s combined market share just 40%
Apart from most Premier League clubs and some top clubs in other leagues,
most remain local brands, with just 24% sporting international shirt sponsors
A number of kit manufacturer deals cover ten or more
years with only one in eight clubs switching in 2017
28
CHAPTER 3: Sponsorship
CONTENTS OVERVIEW
Strong competition for club kit manufacturer deals
Kit manufacturers’ share of the club market
Changes in kit manufacturer
Two kit manufacturers, Nike and adidas, are the most prevalent brands in the
club kit manufacturing landscape. However, unlike many other sports, in which
centralised kit deals are common, there is significant diversity within European
kit manufacturing. The combined market share of the two market leaders is only
40% and there are 41 different kit manufacturers featuring in just the 16 leagues
analysed for this report.
In four of the 16 leagues no club changed their kit manufacturer for
2017/18. At the other end of the scale, just 63% of Belgian top-division
clubs retained the same kit manufacturer, with six clubs changing for
2017/18.
There is no local market dominance, with no individual kit manufacturer
sponsoring more than half of the clubs in any of the selected leagues.
adidas sponsors seven Russian top-division teams and Nike sponsors eight
Turkish top-division teams, giving them a market share of 44% in those
leagues. This is the highest percentage across any of the 16 leagues.
* The ‘Other’ category includes all kit manufacturers that sponsor fewer than 10 clubs, including Jako (9), Kappa (8), Lotto, New Balance (both 7), Hummel and Legea (both 6).
Across the 268 clubs analysed in the 16 leagues, there is relative
stability in the kit manufacturing landscape. Just 13% of the clubs
changed their kit manufacturer for the 2017/18 season.
Of the six kit manufacturers that provide the kits of at least ten
clubs within this 16-league sample, the shirts manufactured by
Nike have the highest average selling price at €71, compared
with an average of €54 for Joma kits. This is clearly impacted by
each brand’s specific club and league mix.
The significant value and long contract length of kit
manufacturer deals for the largest clubs is highlighted by the
one-off contract termination payment of £67m which Chelsea FC
incurred when switching kit manufacturers and cancelling their
existing contract six years early.
29
Club Licensing Benchmarking Report: Financial Year 2016
CONTENTS OVERVIEW
Large range in kit manufacturer values between different clubs
30
CHAPTER 3: Sponsorship
This page provides a high-level overview of the kit manufacturer landscape, presenting a cross-section of 30 clubs with indicative value ranges for their
latest announced kit manufacturing deals*, some of which have not yet come into force. The same analysis is provided for shirt sponsors later in this
section and a more detailed analysis of trends and levels of sponsorship and commercial values based on audited FY2016 values, analysed right across
the top 20 leagues, is presented later in the revenue section of this report.
* Transforming long term kit manufacturing deals into an annual sum is not an exact science, with payment structures (even weighted, front or back loaded) and bonus structures (signing bonuses, performance related bonuses, penalty clauses, extension options or other commercial clauses) adding a
degree of subjectivity to the annual valuation. In addition care should be taken when comparing deals or compiling lists (hence the use of indicative value ranges in this analysis) since there can be considerable variation in the kit manufacturing contract arrangements (pure kit supply/merchandising
deal or additional sponsorship) and deal structures (merchandising profit or income share and/or fixed sum payment). Value ranges and contract lengths based on TVSM data with UEFA sanity checks applied.
€75m
€25m
Kit manufacturer annual deal value ranges*
€75m
€25m
€10m
€10m€3m
€150m
In common with other sponsorships and commercial
partnerships, the value of a club’s kit manufacturer deal is
influenced by the profile of the club, both the potential reach
of the club/league and also the level of success associated
with the club ‘brand’.
However the kit manufacturer deal involves a product rather
than just an association and so the value to the kit
manufacturer is also heavily influenced by the supporter base
and potential revenue from merchandising.
The latest kit manufacturing contracts across the sample of
30 major clubs average 8 years, a relatively long period in
club football terms, given that both TV contract cycles and
main shirt sponsors tend to be across 3 to 5 years. Indeed 12
of the 30 clubs analysed have long term kit manufacturing
deals of at least ten years with others having shorter
contracts but renewing new deals with the same kit supplier.
The spread of clubs across value ranges clearly illustrates the
wide difference in deal value between the very largest clubs
and other big clubs. The top three clubs receive kit
manufacturing income more than 10 times many domestic
rivals and more than 100 times the majority of smaller clubs
in their domestic league.
Majority of clubs < €1m
Kit manufacturer duration
latest contract
Average:
7.9 years
CONTENTS OVERVIEW
Wide range of club shirt prices within each league
Average shirt price in selected leagues**
This section focusses on two of the most high-profile types of club sponsorship: kit manufacturers and main shirt sponsors*. A similar sample size is used as in the previous chapter on ownership, with the sponsorship section focusing
on a selection of 16 major European leagues representing 268 clubs. The section starts with an analysis of the prices of new 2017/18 replica shirts according to the official club websites. This is followed by a market concentration and
stability analysis of the main kit manufacturers and a geographical and industry concentration and stability analysis of the main shirt sponsors. This section ends with an analysis on the use and size of different sponsoring types.
High to low:
In the German Bundesliga, the difference between the most expensive shirts
(FC Bayern and Schalke) and the least expensive (Hamburger SV, Freiburg and
Werder Bremen) is the lowest of all leagues, with a range of only €20. The
Russian Premier League has the highest range from high to low, with an FC
Zenit shirt costing almost four times as much as an FC Arsenal Tula shirt**.
At €87 the Swiss Super League clubs have the highest average shirt price of for
the 2017/18 season, placing them comfortably ahead of the German
Bundesliga, the Italian Serie A and the French Ligue 1. The average shirt price
in Ukraine is the lowest of the selected 16 leagues, at an average of €43.
Club football shirt
Official replica of the 2017/18 club shirt that is offered for
sale on the official club website
Kit manufacturer
Brand that produces the first-team kit
Shirt sponsor
The sponsor named on the front of the home match shirt,
typically also the main club sponsor
31
Club Licensing Benchmarking Report: Financial Year 2016
CONTENTS OVERVIEW
* All shirt prices are presented in euros using the exchange rates applicable at the time of writing.
**This study has collected shirt sale prices as of October 2017 offered on the various official club websites. Some clubs did not provide an option to buy the shirt via the website and have therefore been excluded in this study.
Two out of three clubs still have a domestic shirt sponsor
Origins of main sponsors
Turnover of shirt sponsors
In the top two English leagues and the Swiss top division around
40% of clubs changed their main sponsor for the 2017/18 season. In
contrast, all the ten clubs in the Austrian top division retained the
same shirt sponsor as in 2016/17 for the 2017/18 season.
Despite the increasing global attractiveness of European club football, the
majority of clubs in the 16 major leagues analysed remain local not global
brands.* This is reflected in the primary shirt sponsorship deals, with 64% of
shirt sponsors based in the same country as the club they sponsor. With 12%
of clubs not having a shirt sponsor, this means only 24% of clubs have
international shirt sponsors. Clubs in Austria, Greece, the Netherlands and
Russia have only brands of domestic origin as shirt sponsors.
The region providing the highest number of non-domestic shirt
sponsors is Asia, with Asian companies appearing on 11% of
European club shirts (31 different clubs).
The English Premier League is the only league that features a
majority of international shirt sponsors, with foreign companies
appearing on 16 of the 20 club shirts. The Championship (English
second tier) has foreign shirt sponsors on 12 of the 24 clubs’ shirts,
reflecting both the international appeal and foreign ownership of
English football clubs.
One month into the 2017/18 season, 12% of clubs were still without
a shirt sponsor, most commonly in Greece, where 7 of the 16 clubs
still did not have a shirt sponsor.
The origin and nature of shirt sponsorship deals in Europe differs
widely. This study focuses on the main shirt sponsor a club selects
for the full season. In some cases, however, clubs may decide to
appoint different sponsors for their home, away or European
matches or even on a match-to-match basis. In those cases, this
study takes account only of the official shirt sponsor for the home
kit contracted for the full season.
In comparison with the stable relationship between clubs and kit
manufacturers, the turnover of main shirt sponsors from year to
year is considerably higher, with 22% changing between 2016/17
and 2017/18. In fact, if the 12% of clubs with no shirt sponsor are
excluded, then exactly one in four clubs with a sponsor changed
sponsor in 2017/18.
* The separation of a company or brand into domestic and international can be a subjective exercise in certain cases. Where a shirt sponsor is headquartered domestically but the brand is international, it has been considered a domestic sponsor for this analysis.
32
CHAPTER 3: Sponsorship
CONTENTS OVERVIEW
Ratio of more than 25 to 1 in shirt sponsor values within leagues
€75m
€55m
€25m
Shirt sponsorship* annual deal value ranges
€55m
€25m
€10m
€10m€3m
* Transforming long term shirt sponsorship deals into an annual sponsorship sum is not an exact science, as assumptions are needed for payment structures (even weighted, front or back loaded) and bonus structures (signing bonuses, performance related bonuses, penalty clauses, extension options
or other commercial clauses). In addition care should be taken when comparing deals or compiling lists (hence the use of indicative value ranges in this analysis) since there can be considerable variation in the shirt sponsorship contract type (single or multiple shirt sponsorship deals) and in the
packaged/bundled rights covered by the sponsorship deal (naming, signage, designation, hospitality IP rights etc) adding a degree of complexity and subjectivity to value comparisons. Value ranges and contract lengths based on TVSM data with UEFA sanity checks applied.
In common with the kit manufacturer deal and other sponsoring
and commercial partnerships, the value of a club’s principal shirt
sponsorship deal is influenced by the profile of the club, both the
potential reach of the club/league and also the level of success
associated with the club ‘brand’.
In most cases the principal shirt sponsor is considered the main
club sponsor with the shirt sponsorship deal the largest individual
club commercial contract. It is relatively common for the principal
shirt sponsor to be associated with the main club
investor/benefactor, especially in Eastern Europe and further
down the football pyramid.
The latest principal shirt sponsorship contracts across the sample
of 30 major clubs average 4.4 years, with a tendency for higher
value deals to also be longer term deals. As already indicated on
the previous page, 12% of clubs across the largest 16 leagues
didn’t have any principal shirt sponsor at the start of this season
and one year deals, sometimes rolled-over, are not uncommon.
Although the shirt sponsorship ratio is smaller than the kit
manufacturing deals, the top three clubs nonetheless receive shirt
sponsorship income more than 5 times many domestic rivals and
more than 25 times the majority of smaller clubs in their domestic
league.
Majority of clubs < €3m
Shirt sponsorship duration
latest contract
Average:
4.4 years
33
Club Licensing Benchmarking Report: Financial Year 2016
CONTENTS OVERVIEW
The diverse appeal of club football reflected in shirt sponsor brands
Branch of main sponsors
The broad appeal of European club football is reflected in the diverse range of business
sectors that sponsor club football, as the main shirt sponsor and not just a commercial
partner. Even after grouping all the different company activities into just eight industry
sectors, there is no dominant sector, with the list featuring both B2B and B2C companies.
Gambling and sports betting companies are the most prevalent shirt sponsors in European
football, with 45 active deals with such companies in place. Shirt sponsorship by gambling
companies is widespread in the top two English divisions and the Greek top division,
approximately 50% of the clubs in all three having gambling companies as their shirt sponsors.
This level of concentration is equalled in two other leagues – the Swiss and Scottish top
divisions – with financial service companies (banks and insurances) in Switzerland and
construction and industrial goods companies in Scotland sponsoring half the clubs.
Only 5 of the 212 different companies appear as shirt sponsors in more than one different
league. The airline Fly Emirates is the most common shirt sponsor across the leagues, with six
major shirt sponsorship deals in six different countries. Drinks manufacturer Red Bull, energy
provider Gazprom and betting companies Dafabet and Marathonbet are the only other
companies that appear in more than one league, albeit in just two countries each, underlining
again the domestic nature of most shirt sponsors and the diversity in foreign shirt sponsorship.
* The ‘Other’ category includes governmental organisations, charity institutions, academies and individual philanthropists.
34
CHAPTER 3: Sponsorship
CONTENTS OVERVIEW
Use of sleeve sponsorship and stadium naming rights varies
Sleeve sponsor
Shirt sponsor
Kit
manufacturer
Stadium naming
rights
88%
100%
26%
Whereas kit manufacturers and shirt sponsors (main sponsors) have been a part of the sponsorship landscape for a long time in
European club football, stadium naming rights and sleeve sponsors are less prevalent. Although sleeve sponsorship is common
practice in 12 of the 16 analysed leagues, it is only used by just over half of the analysed clubs, as a number of leagues
currently have no sleeve sponsorship. Stadium naming rights are even more concentrated. For the 2017/18 season only three
leagues (Germany, Netherlands and Austria) had a majority of club stadiums with naming rights.
Additional kit sponsorship is becoming more common in the European club sponsorship landscape and the examples are
diverse, from training kit deals in England, to sponsors on shorts in Belgium, multiple sponsors on the front of shirts in France
and sponsors on the back of shirts in Austria. Shirt sleeve sponsorship is another example that can be added to the list. In
England and Germany, which are considered the two biggest commercial European football markets, 58% of clubs signed new
agreements with a shirt sleeve sponsors before the start of the 2017/18 season. This type of sponsorship was previously
centralised in the Bundesliga (single deal) and was introduced in the Premier League for the 2017/18 season.
56%
This page of the report illustrates the use of different types of sponsorship across the 16 selected leagues. In addition to the previous pages (shirt sponsorship and kit manufacturers), it considers two
other categories: sponsors that are displayed on the sleeve of football shirts (sleeve sponsors) and sponsors that acquire the naming rights of club football stadiums (stadium naming rights). The
prevalence of such deals is illustrated as a percentage of clubs across the 16 leagues as well as in the flags of the countries in which the different types of sponsorship are common (over 50% of clubs).
Stadium naming rights and shirt sleeve sponsors per league
Percentage of clubs:
35
Club Licensing Benchmarking Report: Financial Year 2016
CONTENTS OVERVIEW
Transfers
4
36
Transfer highlights
Transfer spending reached record levels of almost
€5.6bn in summer 2017
80% of global transfer spending during the summer window was in the big five
European leagues (ENG, ITA, FRA, ESP and GER)
Summer 2017 featured 6 of the top 20 transfer fees of all
time and ten reported transfers of €50m+
Of the 96 major transfers of €15m+ in summer 2017, only 4 players went
to clubs in leagues outside the big five (3x Zenit and 1x Porto)
Club Licensing Benchmarking Report: Financial Year 2016
37
CONTENTS OVERVIEW
Record summer transfer spending fuelled by ‘big 5’ leagues
Summer window spending
(€billions)
Summer window spending
relative to club revenue (%)
The summer window spending was equivalent to 28% of the projected total club revenue for the
2017 financial year, setting another new benchmark as this is 6% higher than the highest value in
the last ten years.
The total European spending during the summer 2017 transfer window reached a record high of
€5.6bn. Clubs spent almost €1bn in the January transfer window, which suggests a total 2017/18
spend of €6bn to €7bn.
The Premier League’s 29% share is 3% lower than last year. Most of that difference has
been absorbed by the French Ligue 1’s increase from 5% to 15% of overall spending in
summer 2017. Of the non-big five leagues, which account for 20% of the total, the
English Championship has the largest share, at 4%.
Share of overall summer transfer spending by
clubs in the ‘big five’ European leagues
Transfer spending by leagueEuropean transfer spending over the past decade
This section reviews the most recent transfer activity (summer 2017) and sets it in context. The data
is indicative only, since known values are supplemented with reported estimates. Detailed audited
historic transfer data is analysed in the operating costs section of this report.
38
CHAPTER 4: Transfers
CONTENTS OVERVIEW
Almost 100 high value transfers (€15m plus) reported in summer
The most significant jump in high-value
transfers is visible in the €50m+ category,
where the number of transfers is twice as high
as in the 2016 summer transfer window.
The number of high-value summer
transfers has increased over time,
as could be expected given the
increase in club revenues.
Of the 96 high-value transfers that occurred in the 2017 summer transfer window,
French players appear to have been most in demand. Those 11 French players are
followed by 8 Spanish and 7 Argentinian, English and Italian players. A total of 19
other transfers that do not appear in this list involved players of 19 different
nationalities, demonstrating the international nature of playing talent.
Nationalities involved in high-value transfers in summer 2017
39
Club Licensing Benchmarking Report: Financial Year 2016
Number of high-value transfers per category
CONTENTS OVERVIEW
Premier League most active in summer 2017 transfer market
Net spend Transfer earningsTransfer spend
+€231m
+€56m
+€13m
+€8m
-€10m
-€15m
-€78m
-€111m
-€118m
-€772m
The Premier League was both the biggest spender as well as the biggest
earner of this summers transfer window. Despite being the biggest earner,
the net spend of the Premier League is the lowest with -€772million. On
the other side of the spectrum is Portugal who had a positive net result of
+231m.
Notable changes
Outside the top 10 markets
The Netherlands just missed the top by a margin after upping their
spending from 40million to 67million this summer. Ukraine, Sweden and
Norway are the countries that saw the biggest proportional growth in
comparison to previous year.
If the top 10 was listed by transfer earnings, the Netherlands and Romania
would’ve made it on to the ranking instead of Turkey and Russia. Greece
recorded the best net result of all non-top 10 countries with a plus of just
under €20million.
The French Ligue 1 reported a growth of 331% in comparison to last
summers spending on the transfer market. This is by far the highest
growth of the top 10 markets (comfortably above the Turkish Superlig
who went up 92%). Although summer transfer spending of the English
Championships decreased by 3% compared to last summer, the second
divisions of the big nations continue to make up ground on mid-level
nations in terms of transfer spending.
The top 10 markets
The top 10 leagues by transfer spend
POR
BEL
ENG L2
ESP
GER
TUR
RUS
FRA
ITA
ENG
40
CHAPTER 4: Transfers
CONTENTS OVERVIEW
Four clubs dominated summer 2017 reported net transfer spending
Net spend Transfer earningsTransfer spend
+€256m
-€71m
-€24m
-€51m
-€153m
+€34m
-€3m
-€203m
-€153m
-€353m
Only two clubs (AS Monaco and FC Barcelona) out of the top 10
were able to balance their transfer activity. In contrast, four clubs
(Paris Saint-Germain, AC Milan, Manchester City FC and
Manchester United FC) had a considerably higher net spend than
the other big spenders.
Notable changes
Outside the top 10 markets
Inter Milan, Arsenal FC and Borussia Dortmund dropped out of
the top 10 after having reported transfer spending of over €100m
in the 2016 summer window, while the winner of the previous
two editions of the UEFA Champions League, Real Madrid CF, has
not featured in the top 10 in either of the previous two years.
In a five-year ranking, three English clubs (Manchester City (1st),
Manchester United (3rd) and Chelsea (4th)) make the top five in
terms of transfer spending. These three English teams are
accompanied by Paris Saint-Germain (2nd) and FC Barcelona
(5th). In terms of transfer earnings over the same period, AS
Monaco, Chelsea, SL Benfica, AS Roma and Juventus make up the
top five.
The top 10 markets
The top 10 clubs by transfer spend
41
Club Licensing Benchmarking Report: Financial Year 2016
AS Monaco
Bayern Munich
Juventus
Everton
Manchester
United
FC Barcelona
Chelsea
AC Milan
Manchester
City
Paris Saint-
Germain
CONTENTS OVERVIEW
Considerable timing differences in summer transfer windows
30x> 80 days
12x71 – 80 days
7x61 - 70 days
< 60 days 6x
A total of 22 countries opened their summer transfer window (i.e. the window
opened after the end of the previous season) for 83 days, which is the longest in
Europe. The longest overall player registration period (winter and summer
transfer windows combined) was 113 days, as seen in 11 countries ahead of the
2017/18 season.
The timing in which transfers can be made differs considerably between UEFA’s
55 member associations. In 2017 Luxembourg was the first to open its summer
transfer window, on 25 May, and Portugal was the last, on 3 July.*
Bosnia-Herzegovina and Estonia are the countries with the shortest summer
transfer windows, at 50 and 52 days respectively. Over the entire season, Latvia is
the country with the shortest player registration period, at just 73 days.
Summer 2017 transfer
windows around Europe
* Transfer window information was retrieved on 9 October from the FIFA TMS website, on which all associations enter their transfer window data directly.
42
CHAPTER 4: Transfers
CONTENTS OVERVIEW
A quarter of transfer spending after season opener
* As domestic seasons usually kick off at the weekend, the exact overlap between the start of the season and end of the window may vary slightly. Some leagues also start earlier in the summer preceding a major tournament (e.g. August 2017, ahead of the 2018 World Cup). Therefore the summer
2018 overlap could potentially be a week shorter that shown here for 2017 in France, Germany, Portugal, Russia and Turkey.
Overlap between start of season and transfer deadline
Whereas the previous page looked at the length of the 55 UEFA member associations’ player
registration periods, this page illustrates the overlap between those registration periods and the start
of the season for the top 10 leagues by transfer spend (see p22).
A total of €1.5bn was spent in the top 10 leagues between the start of the season and the
day the various transfer windows closed. The Premier League accounted for almost one-
third of this (€552m).
Portugal has the longest period between the start of the season and the day the transfer
window closes (47 days). By contrast, Serie A clubs had just 12 days’ overlap in 2017/18.
Season starts Overlap Transfer window closes Transfer spend during overlap (€millions)
Clubs spent 25% of their overall summer 2017 transfer
spending after their domestic season started
€16m
€19m
€31m
€61m
€89m
€306m
€122m
€236m
€79m
€552m
POR
BEL
TUR
RUS
ENG L2
GER
ESP
ITA
ENG
FRA
43
Club Licensing Benchmarking Report: Financial Year 2016
CONTENTS OVERVIEW
Agents
5
44
Agent highlights
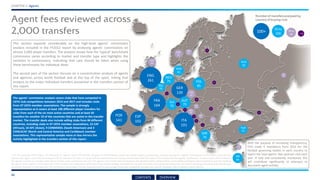
Across some 2,000 transfers reviewed between 2014 and 2017, agents’ fees
averaged 12.6% of the transfer fee – a significant cost for clubs
There is no ‘typical’ agent commission – 769 deals involved agents’ fees of less
than 10%, 576 involved fees of 10 to 20% and 646 involved fees of more than 20%
In general, agents’ commissions are higher on smaller deals – averaging less
than 10% on deals of €5m+ but 20% on transfers of less than €1m
The agent business is relatively open, with the largest agency
responsible for only 6 of the 96 major transfers of summer 2017
Club Licensing Benchmarking Report: Financial Year 2016
45
CONTENTS OVERVIEW
ENG
261
The agents’ commission analysis covers clubs that have competed in
UEFA club competitions between 2014 and 2017 and includes clubs
from 37 UEFA member associations. The sample is strongly
representative as it covers at least 100 different player transfers for
clubs from each of the six most active countries and at least 50
transfers for another 10 of the countries that are active in the transfer
market. The transfer deals also include selling clubs from 84 different
countries, including clubs in 47 UEFA member associations, 15 CAF
(African), 10 AFC (Asian), 9 CONMEBOL (South American) and 3
CONCACAF (North and Central America and Caribbean) member
associations. This representative sample more or less mirrors the
activity highlighted in the transfers section of this report.
100+
50 to
100
10 to
50 < 10
Number of transfers analysed by
country of buying clubAgent fees reviewed across
2,000 transfers
ESP
102
GER
139
POR
141 ITA
191
FRA
164
CZE
45
POL
85
9
This section expands considerably on the high-level agents’ commission
analysis included in the FY2012 report by analysing agents’ commissions on
almost 2,000 player transfers. The analysis shows how the ‘typical’ benchmark
commission varies according to market and transfer type and highlights the
variation in commissions, indicating that care should be taken when using
these benchmarks for individual deals.
The second part of the section focuses on a concentration analysis of agents
and agencies across world football and at the top of the sport, linking that
analysis to the major individual transfers presented in the transfers section of
this report.
AUT
79
GRE
76
SUI
76
NED
75
RUS
65
ISR
64
DEN
63
BEL
55
TUR
51
SCO
44
NOR
41
BUL
25
SWE
21
CRO
19
HUN
16
SRB
13
CYP
10
KAZ
10
8
8
4
3
3
2
2
1
1
1
* For the purposes of this report, all references to ‘agents’ covers the broader category of intermediaries, which can include lawyers, accountants, advisors and agents. Agents’ commissions in this report cover just the
buying club’s agent costs and are analysed only for transfers (no loans or out-of-contract deals) where the buying club discloses both the value of the transfer and the agents’ commission. In some cases, where relevant,
the agents’ commission includes other direct transfer costs reported by the club. The agents’ and transfer fees are based on the agreed transfer compensation not including contingent add-on payments and not including
the agents’ costs. Agents’ commissions for 1,973 transfers are analysed by commission value and percentage of transfer fee, by year of transfer, by buying and selling club, by country of buying and selling clubs and by type
of transfer (national or international). The commission percentage is further analysed based on percentage thresholds, (weighted) averages and ‘typical’ (median) rates to obtain a clearer picture.
With the purpose of increasing transparency,
FIFA made it mandatory from 2016 for the
football governing bodies in each country to
report the total agents’ fees paid per club each
year. If fully and consistently monitored, this
will contribute significantly to attempts to
document agent activity.
46
CHAPTER 5: Agents
CONTENTS OVERVIEW
* The ‘weighted average’ agents’ commission is the total agents’ fee as a percentage of the total transfer fee and is the best measure to estimate total European agent costs. The weighted average cost of 12.6% has been adjusted to exclude the disproportionate effect of two outlier transfers, where
disproportionately high agent costs were recorded due to the impact of third-party ownership, the average would increase to 13.4% if these two transfers were included. The rest of the analysis in the section focuses on presenting the mid commission rate which is the value halfway down the list
from highest to lowest (median) and gives a better representative benchmark for agents’ commission rates, albeit this report clearly highlights that there is no such thing as a ‘typical’ commission due to the enormous variation in rates. The other common use of the term average, calculated from
the average of average rates, is avoided in this report, as it is skewed heavily by some outlier deals with commission percentages of 100%+ that have a disproportionately large impact on the results.
Lower-value transfers of less than €100,000 are subject to the highest agents’
commissions, with a mid rate of 40%. If the threshold is increased to between
€1 and €1 million, then the mid rate agent commission is still 20%.
The mid agents’ fee as a percentage of the
transfer fee falls as the transfer deal
increases, with the benchmark at 9.2% for
transfers of more than €5m.
Number
transfers
reviewed
1,973 268 439 221 226 338 481
Agents’ commissions significantly higher on lower-value transfers
The mid rate is relatively consistent over the
years, fluctuating between 13% and 14% in
each of the periods analysed.
An eye watering €1,270m of agent commissions were reported by clubs on the
2,000 transfers reviewed, which covered about 40% of overall European club
transfer spending during the period 2013-2017. In total these commissions were
equivalent to 12.6% of the transfer fees with the mid commission rate at 13.3%.
Benchmark commission rate: Total, weighted
average and mid agents’ commissions:*
Mid agents’ commission rate by size
of transfer deal
47
Club Licensing Benchmarking Report: Financial Year 2016
CONTENTS OVERVIEW
* Commission rates by country are presented for the 16 leagues with a strong representative sample of at least 50 transfers. The total measures cover all transfers from these 16 leagues and all the other leagues where a smaller number of transfers were analysed.
Agents’ commission rates vary country by country
Mid commission rate by country* of recipient
club: Agent costs as percentage of transfer fees
French, Israeli and Spanish clubs reported the lowest agent commission rates of 8% to 9% between 2013
and 2016, with Danish, Polish and Swiss clubs reporting the highest mid commission rates of 19% to 21%.
This is partly due to the mix of high and low-value transfers. Indeed, across clubs from every league, the
mid commission rate was noticeably higher for lower-value transfers (transfer fee of less than €1m).
48
CHAPTER 5: Agents
CONTENTS OVERVIEW
14.0%
* With or without controlling for transfer deal value and/or transfer country mix, the mid and average commission comparisons remain true.
Higher commissions on international transfers
Mid commission rates
Mid agents’ commissions on cross-border transfers (14.0%) are higher than the 12.4% mid rate for
national transfers. Furthermore, among these cross-border transfers, the mid rate of 14.8% for a
transfer originating outside UEFA territory is higher than the average of 12.4% within UEFA territory
(i.e. between two clubs from different UEFA member associations).
12.4%
National transfers
International
transfers
12.4% 14.8%
UEFA cross-border
transfers
Transfers from
outside UEFA
Mid commission rates for transfers originating in North and Central America and the
Caribbean (CONCACAF) or South America (CONMEBOL) do not differ significantly from the
average rate for cross-border transfers within Europe.
The mid commission of 26% paid on the 28 transfers originating in Asia (AFC) and the 32%
average paid on the 50 transfers originating in Africa (CAF) are considerably higher. This is
partly due to the low average value of the deals but the mid commissions paid remain
noticeably higher than transfers originating from other regions if just larger (€1m+) deals are
considered.*
49
Club Licensing Benchmarking Report: Financial Year 2016
CONTENTS OVERVIEW
+
* For visual reasons, the 28 outlier deals with commission rates of 50%+ (horizontal axis) are added on the right-hand side but not plotted by value. All transfers over €50m (vertical axis) have been excluded to protect anonymity.
Each transfer deal has been plotted to visually illustrate the wide disparity between agents’ rates and the fact that this wide disparity
applies within all countries (by buying club), underlining the unstructured and unregulated nature of the player agent market
Agents’ commissions as percentage of transfer fee in
1,045 transfers between €1m and €50m*
50%+
Transfer
value
Agent commission as
percentage of
transfer fee
Median
10.3%
No such thing as a ‘typical’ agent commission rate
Number of smaller transfers (less than €1m)
across different commission percentage groups
Extreme agent commissions equivalent to more than 100% of the transfer
fee are rare in large transfer deals (32 occasions, 3% of total) but
relatively common in smaller transfer deals (230 occasions, 25% of total).
Significant transfer fees equivalent to more than 25% of the transfer fee
were recorded on 140 occasions in large deals (13%) and on 370
occasions in smaller deals (40%).
Number of large transfers (€1m+) across
different commission percentage groups
50
CHAPTER 5: Agents
CONTENTS OVERVIEW
More than 70 different agents involved in summer’s large deals
Concentration of player agents by transfer value among the major
summer 2017 transfers
Gestifute is the only agency that represented more than five of the high-value transfers and the
only agency that worked with a single club on more than one occasion, transferring two players
from both Porto FC and Benfica SL and transferring two players to Manchester City FC. The largest
representation by value are relatives of the players. Four players were represented by their
relatives during high-value transfers amounting to a total transfer sum of approximately €320m.*
The four agents responsible for the largest number of transfers during the
summer 2017 transfer window represent only 17% of the total number of
transfers. In total, more than 70 different player representatives were
involved in the 96 high-value transfers that occurred, clearly demonstrating
the lack of concentration of agents among the top transfers.
Most common player representation among the 96 high-value summer 2017
transfers
This page analyses the role of player agents among 96 major transfers made in summer 2017 (€15m+
reported transfer fee) as referenced in the transfers section of this report. In particular the concept of
agent concentration or dominance is investigated.
* For six high-value transfers that occurred in the 2017/18 summer transfer window the collaborating agents are unknown. Therefore these players are listed as unknown and added to the category ‘Other’.
51
Club Licensing Benchmarking Report: Financial Year 2016
CONTENTS OVERVIEW
ENG
27.3%
* The market value of ‘playing talent’ is a theoretical, estimated market value because the actual market value depends on what someone is willing to pay to acquire the registration rights of each player. This is determined by multiple
factors, including the player’s contractual situation and numerous characteristics of the player, and the buying and selling clubs. A non-exhaustive list of club characteristics includes the availability of alternative players (at the club and
from outside), the club’s financial strength and league position, the number of clubs competing for players with the same characteristics, and the club’s managerial situation (e.g. new head coach or sporting director).
Not surprisingly, England is the country in which the top 10 player agencies represent
the largest percentage of the playing talent (27.3%). This percentage puts them ahead of
France (21.1%) and Spain (17.6%). In total, the top ten agencies represent 23.1% of the
estimated playing talent currently playing in Europe.
>10%
5%-
10%
2.5%-
5%
< 2.5%
Market share of top 10 agents
Top 10 agencies and
their market share
ESP
17.6%
GER
14.7%
NED
12.6%
POR
11.6% ITA
10.1%
FRA
21.1%
AUT
10.2%
GRE
8.4%
SCO
9.6%
TUR
5.7%
CRO
2.4%
DEN
3.8%
RUS
4.9%
HUN
2.4%
CYP
2.4%
POL
2.2%
SRB
0.2%
ISL
1.9%
CZE
1.6%
SUI
1.4%
LUX
1.0%
ISR
2.6%
BEL
0.8%
ROU
0.6%
GEO
0.5%
NIR
0.1%
WAL
0.1%
The previous page identified the top 10 agents in the summer 2017 transfer
window. This page identifies and analyses the market share by player value of
the top 10 player agents across European club football.* The ten agencies
analysed are: Mondial Sports Managament (GER), Gestifute (POR), Stellar
Football Ltd (ENG), Mino Raiola (NED), Sports Entertainment Group (NED),
Unique Sports Management (ENG), SportsTotal (GER), Base Soccer Agency Ltd
(ENG), ROGON Sportsmanagement GmbH (GER) and Bahia Internacional (ESP).
52
CHAPTER 5: Agents
CONTENTS OVERVIEW
In the Ukrainian top division, more than a quarter of the top-division players (27.7%) are
represented by the agency ProStar, which represents the largest concentration in any
domestic league. The Austrian Bundesliga is the only other league that surpasses the 10%
mark, where 13.2% of top-division players list Stars & Friends as their agency.
>10%
5% to
10% <5%
Market share of main
agency per country
Low level of concentration in
player representation
Whereas the previous page of the report looked into the influence of the top 10
agencies in the different European countries, this page illustrates the degree of
market concentration, by presenting the percentage of players represented by
the largest agency within the top division. In line with previous chapters of the
report, this analysis focuses on 15 selected leagues across Europe.
UKR
27.7%AUT
13.2%
NED
6.9%
RUS
7.9%
SUI
6.2%
POR
5.0%
ENG
5.0%
BEL
4.6%
TUR
4.1%
SCO
3.7%
GRE
3.6%
ITA
3.4%
FRA
3.3%
ESP
5.5%
GER
6.4%
The French Ligue 1 is on the other side of the spectrum, where only 3.3% of the top-division
players are represented by the agency with the most clients. The German Bundesliga
features the highest diversity of player representation, with over 200 different agencies
representing players.
53
Club Licensing Benchmarking Report: Financial Year 2016
CONTENTS OVERVIEW
Club revenues
6
54
Club revenue highlights
European club revenues have more than tripled this century
Revenue growth varies considerably, with commercial driving the ‘top 12’ clubs’ growth,
TV revenues driving the smaller clubs in large leagues, and UEFA revenue increases
benefitting the clubs in smaller leagues
League TV revenue distributions vary considerably in
size and in the distribution between clubs
Club Licensing Benchmarking Report: Financial Year 2016
55
CONTENTS OVERVIEW
European club revenue growth a long term success story
* Compound average growth rate. Source: data covering all of Europe’s top-division clubs submitted directly to UEFA since 2007. Prior to this no Europe-wide data was available but many of the major leagues collected data and this has been summarised in the Deloitte Annual Football Review dating
back to 1996. The total European top-division aggregate revenue and wages for 1996 to 2006 has been estimated by extrapolating across the missing leagues using a ratio of 68:32 (non top-five data extrapolated from known top-five data).
Club revenues have tripled this century
Average 9.8% p.a.
€ Billions
Club revenues are six and a half times
what they were 20 years ago
56
CHAPTER 6: Club revenues
CONTENTS OVERVIEW
Two-cycle revenue growth from financial years ending 2010 to 2016
(aggregate league increase, €m per club increase and percentage growth)*
Over the medium term (FY2010 to FY2016, equivalent to two TV cycles), clubs in 16 of the top 20
leagues (ranked by average revenue) have increased their revenues. In absolute terms, English clubs
have extended their revenue advantage, growing on average by €110m per club, with German (€58m
per club) and Spanish clubs (€44m per club) also growing strongly. Clubs in the next four leagues, all in
countries with large populations, have also enjoyed healthy growth at an average of €15m to €20m per
club, but have nonetheless fallen further behind the top three leagues.
Medium-term league revenues growing at different speeds
+€2,206m
+€44m
+€1,049m
+€886m
+€428m
+€411m
+€86m
+€218m
+€60m
+€79m
+€121m
+€92m*
€18m
+€43m*
-€60m
-€21m
-€69m
-€152m*
+€40m
+€50m
Growth has been more patchy lower down the rankings, where clubs from countries with smaller
populations have not benefitted from similar levels of TV revenue increases. Belgian, Kazakh, Polish
and Swiss clubs have enjoyed the most relative success in increasing their revenues but the average
revenue in Greece, Norway, Scotland and Ukraine has decreased.
Ranking by average
FY2016 revenue
Six-year growth Average six-year club growth Average six-year growth rate
Six-year increase in European club revenues per
revenue stream (FY2010-FY2016, all 54 leagues)
UEFA
106%
BROADCASTING
64%
SPONSORSHIP&
COMMERCIAL
59%
GATE
RECEIPTS
7%
OTHER
-12%
TRANSFERS
105%
TOTAL
64%
Over the medium term, total European
club revenue has grown by 64%. The
revenue mix has changed, with low
growth in gate receipts and a decrease
in other revenues (primarily donations)
reducing their impact. Gross transfer
earnings (not included in revenue but
analysed separately in financial reports)
has more than doubled, as has UEFA
prize money.
* The 2010-2016 aggregate revenue increase in Denmark is a result of an increase in average club revenue combined with an increase in the number of clubs from 12 to 14. Likewise the Portuguese
league has increased from 16 to 18 clubs. By contrast the aggregate revenue decrease in Ukraine is a result of decreased average revenue and a decrease in number of clubs from 16 to 12.
Club Licensing Benchmarking Report: Financial Year 2016
57
CONTENTS OVERVIEW
Revenue changes over one year (FY2015 to
FY2016) in local currency terms*
While combined European club revenue has seen consistent growth,
country-specific developments are naturally more varied. For middle-
income leagues, one club missing out on qualification for the UEFA
Champions League group stage can set the trend and the Belarussian,
Serbian and Slovenian club revenue fall was specifically due to this.
Short-term European club revenue growth (FY2016)
CHAPTER 6: Club revenues
58
Average club revenue
trends, FY2015 to FY2016
* For clubs not operating in euros , the fluctuation in the value of their local currency can affect their financial results. When looking at the underlying trend within a particular league or country (as on this page) it is important to neutralise the currency impact and analyse the trends in local currency
terms. When looking at aggregate European trends or making cross-border comparisons (as elsewhere in the report) it is more appropriate and meaningful to analyse trends in euro currency terms since the value of the domestic currency impacts competitiveness.
The general upward club revenue trend across Europe
reported last year has continued, with revenue growth
reported in 41 leagues, of which 27 reported major
revenue growth of more than 10%.
The first two Kosovan clubs participated in UEFA club competitions in 2017/18,
passing through the club licensing system and providing financial and other data.
However two clubs is not a sufficient sample to assess the financial results of the
league so Kosovo is not included in this year’s financial section. We hope and
anticipate Kosovo will be included in full in next year’s financial sections.
CONTENTS OVERVIEW
Average and aggregate revenues by country
England’s 20 top-tier clubs together reported more revenue than
all 597 clubs combined from the 48 grey, blue and purple
countries. By way of historical sporting context, those countries
have provided 20 different clubs that have won UEFA silverware.
Average club revenue per top
division (€m)*
Average
revenue
€50m+
€5m to
€50m
€1m to
€5m
€0.1m to
€1m
The ability of clubs to generate revenues varies
enormously across Europe’s top-tier leagues,
from England, where clubs generate €244.4m on
average and €4.9bn in aggregate, to San Marino,
where the 15 clubs generate an average of
€150,000 and an aggregate of €2.3m.
Aggregate club revenues per
top division (€m)*
Aggregate
revenue
€500m+
€100m to
€500m
€10m to
€100m
€1m to
€10m
* All financial figures presented and analysed in this report are collected either directly from clubs or indirectly through national associations or leagues, using
UEFA’s extensive online reporting templates. This data is itself sourced from official financial statements verified by independent external auditors. In some cases
certain items are reallocated in order to achieve consistency in financial reporting across Europe, an important requirement of benchmarking. In a limited number
of cases data may not be available, typically where a club has been relegated or fallen outside the scope of the club licensing system. In these cases the missing
data is simulated by UEFA using data for these clubs from the previous year or, if this is not representative, using an extrapolation of data from clubs with a similar
profile from the same league. Simulated data makes up less than 1% of the total data by value. Across the 30 highest-revenue leagues, financial data has been
extrapolated in FY2016 for eight Portuguese, one Greek and one Slovakian club. In addition, the Spanish figures include data from FY2015 for one club.
Club Licensing Benchmarking Report: Financial Year 2016
59
CONTENTS OVERVIEW
Increasing number of clubs breaking €100m+ revenue barrier
FY2016 revenues
€500m+
€400m-€500m
€250m-€400m
€200m-€250m
€100m-€200m
The number of European clubs with revenues in excess of €100m has
edged up from 46 to 48, although there is some churn with 5 clubs
dropping below the €100m threshold and 6 clubs rising above it.
The more noticeable trend is the number of clubs with revenues
above €50m, which has increased significantly from 86 to 94 clubs. At
the turn of the century there were only an estimated 25 clubs with
this earning, and consequently, spending power.*
Clubs with annual revenues of €100m+
60
9
6
1
10
2
4
5
7 8
15
12
21
18
13
23
19
24
16
22
CHAPTER 6: Club revenues
Clubs with annual revenues of €50m+
This top 30 represents not just Europe’s but the world’s largest football clubs by revenue. Football
might be a global game, but the map above highlights the geographical concentration of that wealth.
* The full picture of European club finances has only been revealed since UEFA started receiving the financial data for all 700 top-division clubs (2007). Deloitte has, however, published its ‘rich list’/‘money league’ since the start of the century and although this has not covered every club in recent
years (in particular many of the large eastern European clubs only release data to UEFA) it does cover the vast majority of clubs. Indeed, going back to 1999/2000 it is quite probable that the 25 clubs reporting over €50m revenue were all on the list.
2000
10
……..
2000 ……..
25
3
11
14
17
20
25
26
27
28
29
30
CONTENTS OVERVIEW
419
503
61
Club Licensing Benchmarking Report: Financial Year 2016
The top 30 clubs generated over €9.1bn in revenues in
FY2016. This amount represents just under half of all
European top-division club revenues. Every one of the
top 30 clubs reported an increase in revenue in FY2016,
the 12% average growth rate matching that of the
previous year.
Last year’s report highlighted the two-speed growth in the
last five years of club commercial revenues and the widening
financial gap between the ‘global super powers’ and other
large clubs. Seven clubs (green markers) reported revenue
growth of €50m or more, with Manchester United and FC
Bayern each enjoying growth of more than €100m.
€m
€m FY2016 revenue
FY2015 revenue
FY2017 revenue (where available)€m
Growth 2015 to 2016
Rank Club Country FY16
Year-on-year
growth
Growth
rate
1 Manchester United FC ENG €689m €169m 32%
2 FC Barcelona ESP €620m €59m 11%
3 Real Madrid CF ESP €620m €42m 7%
4 FC Bayern München GER €592m €118m 25%
5 Paris Saint-Germain FC FRA €542m €58m 12%
6 Manchester City FC ENG €533m €73m 16%
7 Arsenal FC ENG €477m €28m 6%
8 Chelsea FC ENG €440m €27m 7%
9 Liverpool FC ENG €407m €18m 5%
10 Juventus ITA €341m €17m 5%
11 Borussia Dortmund GER €285m €4m 1%
12 Tottenham Hotspur FC ENG €281m €22m 9%
13 VfL Wolfsburg GER €236m €45m 23%
14 Club Atlético de Madrid ESP €229m €64m 39%
15 AC Milan ITA €222m €5m 2%
16 AS Roma ITA €219m €38m 21%
17 FC Schalke 04 GER €219m €0m 0%
18 FC Internazionale Milano ITA €202m €30m 17%
19 West Ham United FC ENG €194m €34m 21%
20 Bayer 04 Leverkusen GER €190m €14m 8%
21 FC Zenit St. Petersburg RUS €180m -€16m -8%
22 Leicester City FC ENG €173m €37m 27%
23 Newcastle United FC ENG €168m -€2m -1%
24 Southampton FC ENG €166m €17m 11%
25 Everton FC ENG €164m €0m 0%
26 Olympique Lyonnais FRA €160m €64m 66%
27 Galatasaray SK TUR €159m €11m 7%
28 VfL Borussia Mönchengladbach GER €154m €7m 4%
29 Fenerbahçe SK TUR €149m €41m 37%
30 Aston Villa FC ENG €147m -€4m -3%
1-30 Average €305m €34m
1-30 Aggregate €9,159m €1,019m 13%
496
676
649
675
411
198
The top 30 clubs by revenue
CONTENTS OVERVIEW
558
328
212
269
428
271
122
98
13 months
Club revenues in euros increased by 9.5% between FY2015 and FY2016,
following 6% increases in the two previous years.
Underlying domestic broadcast revenue increased by a steady 8% in
FY2016with the new international TV rights cycle driving large overall
increases of €101m/+16% and €167m/+28% in Germany and Spain
respectively. Italian clubs reported a 6% increase from the start of
their new TV cycle and English clubs a 4% increase from an
incremental mid-cycle increase.
Revenue from UEFA increased significantly (+29% in EURO terms) in
FY2016, with the full effect of the current cycle being reported by all
clubs. This follows the large 20% increase in FY2015 from the first
partial recognition of the upgraded TV deal in the accounts of clubs
with a December year end. In total, clubs saw a €240m increase on
the previous financial year. UEFA payments increased to 10% of all
clubs’ revenue and 16% for those participating in UEFA competitions.
62
Domestic broadcasting
Revenue from UEFA
Sponsorship
Commercial
Gate receipts
Other revenue
Domestic
currency
trend
Euro
currency
trend
Share of total
revenue
Value of
revenue stream
CHAPTER 6: Club revenues
European club revenues by type
Two growth rates are used in this report. The ‘euro
currency trend’ allows for the best comparison of
relative competitiveness between leagues and clubs,
while the domestic currency trend provides the
underlying trend for each country or club.
CONTENTS OVERVIEW
Underlying ‘other’ revenues decreased by 4%
in FY2015, with lower donations in France
and a drop in one-off revenues in Spain.
Other revenues also include subsidies, grants
and income from non-football operations.
Underlying revenue from gate receipts increased by
7% in FY2016, the fastest rate for a number of years.
Various stadium developments (Liverpool, Lyon,
Manchester City and West Ham) combined with large
capacity clubs hosting more home matches (Borussia
Dortmund, FC Barcelona, FC Bayern and Manchester
United FC) explain this trend.
It should be noted that revenue does not include transfer
sales, which are reflected separately in club accounts as profits
on sale of assets. However, to provide some context, €4.2bn in
gross sales income from transfers was reported, equivalent to
23% of total revenues. Transfer sales income has increased
48% since FY2014, and is set to continue increasing as reported
earlier in the transfers section of the report, reflecting the
inflationary values in the transfer market.
Underlying commercial revenues increased
by a notable 12% in FY2016, following a 9%
increase in FY2015. Commercial revenue
growth is again concentrated among the
largest 12 ‘global’ clubs, who were
responsible for 50% of the growth.
Underlying club sponsorship revenues increased
strongly by 10% in FY2016, following a 5% increase in
FY2015. Once again, sponsorship growth in FY2016
was concentrated at the top, with more than 60% of
increased revenues accruing to the top 12 largest
revenue clubs.
European club revenues of €18.5bn are split roughly in three, with 34% domestic
broadcasting, 33% sponsor and commercial and 33% from gate, UEFA and other revenues
CONTENTS OVERVIEW
63
Club Licensing Benchmarking Report: Financial Year 2016
TV a larger part of revenue mix near top of European game
Outside the top 20 TV markets
Other top 20 markets
The ‘big six’ TV markets
The first year of a new international TV rights cycle was reflected in strong TV revenue growth
reported by Spanish clubs (+28%) and German clubs (+16%). The 6% growth reported by Italian clubs
reflects the relatively modest increases from their new TV cycle. Likewise, the French 1% revenue
growth reflects the relatively low increase in Ligue 1 international rights, which are expected to grow
more significantly from 2018/19. English growth of 4% reflects the final year of their TV cycle and the
incremental year-on-year increase across the cycle. Next year English clubs are expected to report a
massive 33% value increase in euro terms despite a 12-13% drop in the value of the British pound.
As a percentage of overall revenue, Italian clubs remain the most reliant on broadcast revenue,
which generates over half their total revenues. The new TV deal is anticipated to also take the TV
share of total revenue for English clubs over the 50% mark.
Increased TV rights from the start of a new cycle led to strong double-digit growth in Denmark,
Poland, Portugal and Sweden. The Danish growth of 17% is partly due to an increase in the number
of clubs from 12 to 14. The Portuguese league is the last major league where clubs sell rights
individually and their 20% growth reflects notable revenue uplifts from two of the big three clubs
that dominate the Portuguese club football landscape. Higher reported Scottish club TV revenues
were without two of the largest clubs featuring in the top division (Rangers and Hearts) and reflect a
restructured TV deal.
While broadcast revenues feature as the largest revenue stream for many of the larger markets, it
contributes less than 10% of revenue for all European leagues outside the top 20, among which only
Czech clubs (8% of total revenue), Israeli and Serbian clubs (7%), Bulgarian and Icelandic clubs (5%)
derive more than 5% of their total revenue from TV.
The top 20 leagues by average club broadcast revenue
€2,271m
€12m
€1,013m
€937m
€751m
€502m
€286m
€122m
€67m
€71m
€35m
€31m
€29m
€29m
€19m
€18m
€10m
€25m
€14m
€23m
+4%
-1%
+6%
+28%
+16%
+1%
+7%
+20%
+1%
+1%
+17%
-8%
+16%
-18%
+12%
+10%
0%
+7%
-8%
+11%
Percentage of total
revenue
Ranking by
club average
Underlying
growth*
Aggregate Club average (€m)
64
CHAPTER 6: Club revenues
CONTENTS OVERVIEW
Wide variation in distribution of TV money across leagues
The distribution models applied by leagues differ, as reflected in how the money is shared between clubs. All major leagues have part of their distributions connected to league performance but then the basis for distribution
varies considerably. Portugal is now the only major league where clubs sell their rights individually and this is reflected in the huge gap between the TV rights of the top three sides and the rest. The high club to median club ratio
is above 14 there, compared with an average high to median ratio of 2.3.
The Spanish (4.1x) and Italian (3.3x) TV revenue is much less evenly spread among clubs than the French (2.4x) and German (2.3x), which reflects the relatively recent move to collective selling in those countries, where the
benefits of greater overall revenues from collective selling tend to be distributed across clubs but with the largest clubs more or less earning the same as before.
Distribution of TV revenue: Ratio of high to median clubs
Ratio
FY16
Ratio
FY10
1.1 x 1.6 x 1.8 x 3.3 x 1.9 x1.5 x 1.7 x 2.1 x 4.3 x 8.4 x1.7 x 2.3 x 2.6 x 2.7 x 2.9 x1.9 x 5.7 x 2.4 x 2.0 x 5.7x*
While TV money has been distributed more evenly in some
leagues, notably Italy and Spain, where individual deals
have been replaced by collective selling, these are
outnumbered by the number of leagues where the high to
median ratio has increased between FY2010 and FY2016.
* The figures for Portugal FY2010 are based on the ratio of top to 6th placed club due to lack of historic data.
Club Licensing Benchmarking Report: Financial Year 2016
65
CONTENTS OVERVIEW
Top 20 clubs by broadcast revenues
English clubs occupy 16 of the top 20 places in the broadcast revenues table. However, perhaps more surprisingly, this is the first time on record that an English club tops the list outright, with either Real Madrid CF, FC Barcelona
or Juventus previously always receiving more domestic TV revenue. These three clubs remain within the top 20, with FC Internazionale Milano the final non-English club in the top 20. English Premier League distributions are part
equal share and part determined by performance and how many times a team is selected for TV coverage, which leads to some year-on-year changes. Leicester FC’s dramatic title win helped them increase their TV revenue by
35%. The chart highlights how dominant TV money is within the revenue mix of many Premier League clubs, representing up to 85% of total revenue in AFC Bournemouth’s case. The chart and table also highlight how TV money
is significant but not dominant for the wealthiest ‘global’ clubs, contributing less than 30% of total revenues in some cases.
%
€m
FY2016 broadcast revenue from domestic football
FY2016 broadcast revenue as a percentage of total
revenue
Rank Club Country FY16
Year-on-year
growth %
% oftotal
revenue
Multiple of
the league
average
1 Manchester United FC ENG €146m 5% 21% 1.3 x
2 Real Madrid CF ESP €145m 3% 23% 3.2 x
3 FC Barcelona ESP €145m 2% 23% 3.2 x
4 Arsenal FC ENG €138m 8% 29% 1.2 x
5 Manchester City FC ENG €135m 1% 25% 1.2 x
6 Leicester City FC ENG €128m 35% 74% 1.1 x
7 Tottenham Hotspur FC ENG €127m 7% 45% 1.1 x
8 Liverpool FC ENG €127m -1% 31% 1.1 x
9 Chelsea FC ENG €123m -11% 28% 1.1 x
10 Southampton FC ENG €123m 11% 74% 1.1 x
11 Juventus ITA €119m 12% 35% 2.4 x
12 West Ham United FC ENG €117m 14% 60% 1.0 x
13 Everton FC ENG €111m 4% 68% 1.0 x
14 Stoke City FC ENG €107m 6% 76% 0.9 x
15 West Bromwich Albion FC ENG €106m 5% 80% 0.9 x
16 Swansea City FC ENG €104m -7% 82% 0.9 x
17 Crystal Palace FC ENG €104m 0% 77% 0.9 x
18 Watford FC ENG €104m n/a 84% 0.9 x
19 FC Internazionale Milano ITA €99m 10% 49% 2.0 x
20 AFC Bournemouth ENG €99m n/a 85% 0.9 x
1-20 Average €120m 6% 54%
1-20 Aggregate €2,408m 5% 40%
66
CHAPTER 6: Club revenues
CONTENTS OVERVIEW
Domestic broadcast distributions recalibrated
The analysis below is a purely theoretical exercise that underlines how distribution mechanisms impact clubs in different leagues.
Rank by
domestic TV
‘Big five’
average
TV share
ENG ESP
Actual TV revenues (FY2016, high-median-low)
Manchester
United €146m
Aston
Villa €88m
Everton
€111m
Real
Madrid
€145m
Espanyol
€37m
Las Palmas
€17m
PSG €54m
Montpellier
€24m
Ajaccio
€10m
Bayern
München
€83m
Eintracht
Frankfurt
€39m
Darmstadt
€24m
Juventus
€119m
Atalanta
€36m
Frosinone
€20m
TV revenues recalculated on ENG % shares TV revenues recalculated on ESP % shares
€200m
€100m
€50m
€25m
€0m
ENG ESP FRA GER ITA
€59m
€111m
€146m
€88m
€52m
€32m
€45m
€65m
€145m
€92m
€362m
€41m
€124m
€80m
€37m
€161m
1st
2nd
3rd
4th
5th
6th
7th
8th
9th
10th
11th
12th
13th
14th
15th
16th
17th
18th
19th
20th
11.0%
9.6%
7.5%
6.8%
6.1%
5.6%
5.3%
5.0%
4.5%
4.3%
4.0%
3.9%
3.7%
3.6%
3.4%
3.3%
3.2%
3.0%
2.8%
2.5%
6.4%
6.1%
5.9%
5.6%
5.6%
5.6%
5.4%
5.4%
5.1%
4.9%
4.7%
4.6%
4.6%
4.6%
4.6%
4.4%
4.3%
4.2%
4.1%
3.9%
15.9%
15.9%
7.5%
5.7%
5.4%
5.3%
4.6%
4.6%
4.2%
4.0%
3.8%
3.6%
3.2%
3.0%
2.5%
2.5%
2.4%
2.3%
2.0%
1.8%
Club Licensing Benchmarking Report: Financial Year 2016
67
CONTENTS OVERVIEW
Large increases in revenue from UEFA club competitions
The top 20 leagues by average club revenue received from UEFA
The top 20 markets
Outside the top 20 markets
The amount of UEFA prize money a club receives is determined in part by its sporting performance and in part by its
national broadcaster’s contribution to the market pool. UEFA competition rights, prize money and solidarity payments to
non-competing teams operate on a three-year cycle, with FY2016 marking the start of the 2015/16-2017/18 cycle for most
of the large western European clubs with summer financial year ends and the second year of the cycle for clubs with
December financial year ends. UEFA distributions totalled €1,931m in clubs’ FY2016 figures, an increase of €431m on the
previous year, with only Italian, Portuguese and Russian clubs reporting less UEFA revenue (performance-based decreases
in prize money).
€312m
€17m
€323m
€207m
€196m
€159m
€49m
€70m
€67m
€59m
€34m
€44m
€50m
€44m
€24m
€17m
€14m
€54m
€14m
€11m
+72%
+619%
+54%
+24%
-6%
+20%
+6%
+136%
-13%
-21%
+85%
+938%
+35%
+56%
+21%
+65%
+41%
+59%
+60%
+107%
Ranking by
club average
Underlying
growth
Aggregate
Looking forward
* The club averages and ‘UEFA % - All clubs’ figures cover all the teams in the league rather than just the four to seven teams participating in UEFA competitions
during the financial period analysed. This is consistent with the other revenue stream analyses. The share of total revenue received from UEFA by just the clubs
participating in a UEFA club competition during the financial period analysed is the larger percentage figure presented on the far left of the data table. This can
fluctuate depending on which type of club qualifies each season. The aggregate revenue from UEFA includes all direct revenues, including prize money, solidarity
payments for clubs competing in qualifying rounds and in most cases also solidarity payments for non-participating clubs distributed through their respective
leagues. Indirect revenues, i.e. sponsor and commercial partner bonuses and gate receipts, are reported elsewhere.
In the top 20 markets, the significance of the UEFA contribution ranged from 6% of total club revenue in England to more
than 50% in Croatia and Ukraine. Outside the top 20 leagues, UEFA competition revenues tend to represent a greater
proportion of overall revenues for clubs in less wealthy leagues. In relative terms, the qualifying round ‘solidarity
payments’, which in the new cycle range from €200,000 for the first qualifying round of the UEFA Europa League to
€400,000 for the third qualifying round in the UEFA Champions League, can form a greater proportion of smaller clubs’
total revenues than the many tens of millions in Champions League group stage bonuses received by the larger clubs. This
is evidenced in the FY2016 figures, with 50% of total club revenues in Albania, Andorra, Armenia, Gibraltar and Latvia
from UEFA despite no club reaching the Champions League or Europa League group stages.
UEFA prize money is set to rise again considerably from the 2018/19 season on the back of a new cycle of TV rights. Both
prize money for participants and solidarity payments for clubs in qualifying rounds and clubs not participating in either
UEFA club competition will increase significantly.
10%
36%
16%
12%
20%
15%
57%
13%
21%
13%
21%
36%
46%
20%
58%
51%
12%
19%
12%
37%
UEFA % - Participating
clubs only
UEFA % -
All clubs
68
CHAPTER 6: Club revenues
CONTENTS OVERVIEW
Европейские футбольные клубы в 2016 году

More Related Content

What's hot

Football Transfer Review 2014 by Prime Time Sport ENG
Football Transfer Review 2014 by Prime Time Sport ENGFootball Transfer Review 2014 by Prime Time Sport ENG
Football Transfer Review 2014 by Prime Time Sport ENG
Prime Time Sport
 
Football Transfer Review 2014 by Prime Time Sport ESP
Football Transfer Review 2014 by Prime Time Sport ESPFootball Transfer Review 2014 by Prime Time Sport ESP
Football Transfer Review 2014 by Prime Time Sport ESP
Prime Time Sport
 
Soccerex Transfer Review 2014 Winter edition Premier League by Prime Time Sport
Soccerex Transfer Review 2014 Winter edition Premier League by Prime Time SportSoccerex Transfer Review 2014 Winter edition Premier League by Prime Time Sport
Soccerex Transfer Review 2014 Winter edition Premier League by Prime Time Sport
Prime Time Sport
 
Soccerex Transfer Review 2014 Winter edition Liga BBVA by Prime Time Sport
Soccerex Transfer Review 2014 Winter edition Liga BBVA by Prime Time SportSoccerex Transfer Review 2014 Winter edition Liga BBVA by Prime Time Sport
Soccerex Transfer Review 2014 Winter edition Liga BBVA by Prime Time Sport
Prime Time Sport
 
Newsletter Banca IFIS Group 9
 Newsletter Banca IFIS Group 9 Newsletter Banca IFIS Group 9
Newsletter Banca IFIS Group 9
Banca Ifis
 

What's hot (14)

Football Transfer Review 2014 by Prime Time Sport ENG
Football Transfer Review 2014 by Prime Time Sport ENGFootball Transfer Review 2014 by Prime Time Sport ENG
Football Transfer Review 2014 by Prime Time Sport ENG
 
Football Transfer Review 2014 by Prime Time Sport ESP
Football Transfer Review 2014 by Prime Time Sport ESPFootball Transfer Review 2014 by Prime Time Sport ESP
Football Transfer Review 2014 by Prime Time Sport ESP
 
Just how broken is football's financial model (German Football Regulation)
Just how broken is football's financial model (German Football Regulation)Just how broken is football's financial model (German Football Regulation)
Just how broken is football's financial model (German Football Regulation)
 
Football management, from cigars in restaurants into powerpoints in the city
Football management, from cigars in restaurants into powerpoints in the cityFootball management, from cigars in restaurants into powerpoints in the city
Football management, from cigars in restaurants into powerpoints in the city
 
Soccerex Transfer Review 2014 Winter edition Premier League by Prime Time Sport
Soccerex Transfer Review 2014 Winter edition Premier League by Prime Time SportSoccerex Transfer Review 2014 Winter edition Premier League by Prime Time Sport
Soccerex Transfer Review 2014 Winter edition Premier League by Prime Time Sport
 
Soccerex Transfer Review 2016 winter edition Premier League
Soccerex Transfer Review 2016 winter edition Premier LeagueSoccerex Transfer Review 2016 winter edition Premier League
Soccerex Transfer Review 2016 winter edition Premier League
 
Soccerex Transfer Review 2016-17 by Prime Time Sport LaLiga Santander edition...
Soccerex Transfer Review 2016-17 by Prime Time Sport LaLiga Santander edition...Soccerex Transfer Review 2016-17 by Prime Time Sport LaLiga Santander edition...
Soccerex Transfer Review 2016-17 by Prime Time Sport LaLiga Santander edition...
 
Soccerex Transfer Review 2016 winter edition LaLiga
Soccerex Transfer Review 2016 winter edition LaLigaSoccerex Transfer Review 2016 winter edition LaLiga
Soccerex Transfer Review 2016 winter edition LaLiga
 
Soccerex Transfer Review 2014 Winter edition Liga BBVA by Prime Time Sport
Soccerex Transfer Review 2014 Winter edition Liga BBVA by Prime Time SportSoccerex Transfer Review 2014 Winter edition Liga BBVA by Prime Time Sport
Soccerex Transfer Review 2014 Winter edition Liga BBVA by Prime Time Sport
 
Soccerex Transfer Review 2016-17 by Prime Time Sport EPL edition
Soccerex Transfer Review 2016-17 by Prime Time Sport EPL editionSoccerex Transfer Review 2016-17 by Prime Time Sport EPL edition
Soccerex Transfer Review 2016-17 by Prime Time Sport EPL edition
 
Newsletter Banca IFIS Group 9
 Newsletter Banca IFIS Group 9 Newsletter Banca IFIS Group 9
Newsletter Banca IFIS Group 9
 
Olympic Wealth Fund new application form
Olympic Wealth Fund new application formOlympic Wealth Fund new application form
Olympic Wealth Fund new application form
 
Football Transfer Review 2017 by Prime Time Sport winter window
Football Transfer Review 2017 by Prime Time Sport winter windowFootball Transfer Review 2017 by Prime Time Sport winter window
Football Transfer Review 2017 by Prime Time Sport winter window
 
La Liga wants to become "The League"
La Liga wants to become "The League"La Liga wants to become "The League"
La Liga wants to become "The League"
 

Similar to Европейские футбольные клубы в 2016 году

UEFADirect_DEC2016_p36
UEFADirect_DEC2016_p36UEFADirect_DEC2016_p36
UEFADirect_DEC2016_p36
Bakar Jordania
 
Brand Finance Football 50 2016
Brand Finance Football 50 2016Brand Finance Football 50 2016
Brand Finance Football 50 2016
Massimo Pizzo
 

Similar to Европейские футбольные клубы в 2016 году (20)

UEFA BENCHAMARKETING REPORT
UEFA BENCHAMARKETING REPORTUEFA BENCHAMARKETING REPORT
UEFA BENCHAMARKETING REPORT
 
UEFADirect_DEC2016_p36
UEFADirect_DEC2016_p36UEFADirect_DEC2016_p36
UEFADirect_DEC2016_p36
 
Sources of funding for football clubs in the european market
Sources of funding for football clubs in the european market Sources of funding for football clubs in the european market
Sources of funding for football clubs in the european market
 
Manchester United Independent Business Review
Manchester United Independent Business ReviewManchester United Independent Business Review
Manchester United Independent Business Review
 
16 exploring capital markes final post malmo_6 sept 2018
16 exploring capital markes final post malmo_6 sept 201816 exploring capital markes final post malmo_6 sept 2018
16 exploring capital markes final post malmo_6 sept 2018
 
Balance Football Fund
Balance Football FundBalance Football Fund
Balance Football Fund
 
Lets play! The european esports market
Lets play! The european esports marketLets play! The european esports market
Lets play! The european esports market
 
Supporters Direct Europe - EU Position Paper
Supporters Direct Europe - EU Position PaperSupporters Direct Europe - EU Position Paper
Supporters Direct Europe - EU Position Paper
 
An Analysis Of European Soccer Finances And Their Impact On On-field Success
An Analysis Of European Soccer Finances And Their Impact On On-field SuccessAn Analysis Of European Soccer Finances And Their Impact On On-field Success
An Analysis Of European Soccer Finances And Their Impact On On-field Success
 
Sd europe conference
Sd europe conferenceSd europe conference
Sd europe conference
 
Fifa.cies 2013 players
Fifa.cies 2013 playersFifa.cies 2013 players
Fifa.cies 2013 players
 
Arsenal Holdings' Financial Results 2011/12
Arsenal Holdings' Financial Results 2011/12Arsenal Holdings' Financial Results 2011/12
Arsenal Holdings' Financial Results 2011/12
 
Beyond Bosman | The end of all transfer fees in European football
Beyond Bosman | The end of all transfer fees in European footballBeyond Bosman | The end of all transfer fees in European football
Beyond Bosman | The end of all transfer fees in European football
 
Brand Finance Football 50 2016
Brand Finance Football 50 2016Brand Finance Football 50 2016
Brand Finance Football 50 2016
 
ECA (2012) report on youth academies
ECA (2012) report on youth academiesECA (2012) report on youth academies
ECA (2012) report on youth academies
 
Beating the Offside Trap
Beating the Offside TrapBeating the Offside Trap
Beating the Offside Trap
 
Grant Thornton - Focus on Football Finance UK
Grant Thornton - Focus on Football Finance UKGrant Thornton - Focus on Football Finance UK
Grant Thornton - Focus on Football Finance UK
 
Grant Thornton- Focus on football finance
Grant Thornton- Focus on football financeGrant Thornton- Focus on football finance
Grant Thornton- Focus on football finance
 
Football finance 100
Football finance 100Football finance 100
Football finance 100
 
Football and finance eng ab16 sept 2018_malmo
Football and finance eng ab16  sept  2018_malmoFootball and finance eng ab16  sept  2018_malmo
Football and finance eng ab16 sept 2018_malmo
 

More from mResearcher

Українці в умовах протидії коронавірусу
Українці в умовах протидії коронавірусуУкраїнці в умовах протидії коронавірусу
Українці в умовах протидії коронавірусу
mResearcher
 

More from mResearcher (20)

Дослідження громадської думки щодо ситуації у країні під час пандемії COVID-1...
Дослідження громадської думки щодо ситуації у країні під час пандемії COVID-1...Дослідження громадської думки щодо ситуації у країні під час пандемії COVID-1...
Дослідження громадської думки щодо ситуації у країні під час пандемії COVID-1...
 
ЗВІТ ЗА ПРОЕКТОМ "ЕКСПРЕС ОПИТУВАННЯ - ОЦІНКА ПОДІЙ, ПОВ'ЯЗАНИХ З ЕПІДЕМІЄЮ К...
ЗВІТ ЗА ПРОЕКТОМ "ЕКСПРЕС ОПИТУВАННЯ - ОЦІНКА ПОДІЙ, ПОВ'ЯЗАНИХ З ЕПІДЕМІЄЮ К...ЗВІТ ЗА ПРОЕКТОМ "ЕКСПРЕС ОПИТУВАННЯ - ОЦІНКА ПОДІЙ, ПОВ'ЯЗАНИХ З ЕПІДЕМІЄЮ К...
ЗВІТ ЗА ПРОЕКТОМ "ЕКСПРЕС ОПИТУВАННЯ - ОЦІНКА ПОДІЙ, ПОВ'ЯЗАНИХ З ЕПІДЕМІЄЮ К...
 
РЕЗУЛЬТАТИ РЕГІОНАЛЬНОГО ОПИТУВАННЯ У ДОНЕЦЬКІЙ ТА ЛУГАНСЬКІЙ ОБЛАСТЯХ
 РЕЗУЛЬТАТИ РЕГІОНАЛЬНОГО ОПИТУВАННЯ У ДОНЕЦЬКІЙ ТА ЛУГАНСЬКІЙ ОБЛАСТЯХ РЕЗУЛЬТАТИ РЕГІОНАЛЬНОГО ОПИТУВАННЯ У ДОНЕЦЬКІЙ ТА ЛУГАНСЬКІЙ ОБЛАСТЯХ
РЕЗУЛЬТАТИ РЕГІОНАЛЬНОГО ОПИТУВАННЯ У ДОНЕЦЬКІЙ ТА ЛУГАНСЬКІЙ ОБЛАСТЯХ
 
Суспільні настрої на Донбасі
Суспільні настрої на ДонбасіСуспільні настрої на Донбасі
Суспільні настрої на Донбасі
 
YOUкраїна. Тижневий дайджест 30 березня - 5 квітня.
YOUкраїна. Тижневий дайджест 30 березня - 5 квітня.YOUкраїна. Тижневий дайджест 30 березня - 5 квітня.
YOUкраїна. Тижневий дайджест 30 березня - 5 квітня.
 
Психоемоційний стан українців на карантині
Психоемоційний стан українців на карантиніПсихоемоційний стан українців на карантині
Психоемоційний стан українців на карантині
 
Українці в умовах протидії коронавірусу
Українці в умовах протидії коронавірусуУкраїнці в умовах протидії коронавірусу
Українці в умовах протидії коронавірусу
 
Емоції і поведінка українців на карантині
Емоції і поведінка українців на карантиніЕмоції і поведінка українців на карантині
Емоції і поведінка українців на карантині
 
YOUкраїна, ТИЖНЕВИЙ ДАЙДЖЕСТ 23-29 БЕРЕЗНЯ
YOUкраїна, ТИЖНЕВИЙ ДАЙДЖЕСТ 23-29 БЕРЕЗНЯYOUкраїна, ТИЖНЕВИЙ ДАЙДЖЕСТ 23-29 БЕРЕЗНЯ
YOUкраїна, ТИЖНЕВИЙ ДАЙДЖЕСТ 23-29 БЕРЕЗНЯ
 
Ставлення до медичної реформи в Україні
Ставлення до медичної реформи в УкраїніСтавлення до медичної реформи в Україні
Ставлення до медичної реформи в Україні
 
Карантин. Робота. Дистнаційка
Карантин. Робота. ДистнаційкаКарантин. Робота. Дистнаційка
Карантин. Робота. Дистнаційка
 
Загроза коронавірусу
Загроза коронавірусуЗагроза коронавірусу
Загроза коронавірусу
 
Дослідження громадської думки щодо ситуації в країні під час пандемії COVID-19
Дослідження громадської думки щодо ситуації в країні під час пандемії COVID-19Дослідження громадської думки щодо ситуації в країні під час пандемії COVID-19
Дослідження громадської думки щодо ситуації в країні під час пандемії COVID-19
 
Как жители Беларуси рагируют на коронавирус?
Как жители Беларуси рагируют на коронавирус?Как жители Беларуси рагируют на коронавирус?
Как жители Беларуси рагируют на коронавирус?
 
СОЦІАЛЬНО-ПОЛІТИЧНІ НАСТРОЇ ПІД ЧАС КАРАНТИНУ
СОЦІАЛЬНО-ПОЛІТИЧНІ НАСТРОЇ ПІД ЧАС КАРАНТИНУСОЦІАЛЬНО-ПОЛІТИЧНІ НАСТРОЇ ПІД ЧАС КАРАНТИНУ
СОЦІАЛЬНО-ПОЛІТИЧНІ НАСТРОЇ ПІД ЧАС КАРАНТИНУ
 
Соціальна ініціатива "YOUкраїна"
Соціальна ініціатива "YOUкраїна"Соціальна ініціатива "YOUкраїна"
Соціальна ініціатива "YOUкраїна"
 
Фейки в социальных сетях
Фейки в социальных сетяхФейки в социальных сетях
Фейки в социальных сетях
 
ИССЛЕДОВАНИЕ МНЕНИЯ НАСЕЛЕНИЯ МИНСКА О РАЗВИТИИ ВЕЛОДВИЖЕНИЯ
ИССЛЕДОВАНИЕ МНЕНИЯ НАСЕЛЕНИЯ МИНСКА О РАЗВИТИИ ВЕЛОДВИЖЕНИЯИССЛЕДОВАНИЕ МНЕНИЯ НАСЕЛЕНИЯ МИНСКА О РАЗВИТИИ ВЕЛОДВИЖЕНИЯ
ИССЛЕДОВАНИЕ МНЕНИЯ НАСЕЛЕНИЯ МИНСКА О РАЗВИТИИ ВЕЛОДВИЖЕНИЯ
 
ДУМКИ І ПОГЛЯДИ НАСЕЛЕННЯ УКРАЇНИ ЩОДО ОХОРОНИ ЗДОРОВ’ЯТА ІНШИХ ПИТАНЬ: СІЧЕН...
ДУМКИ І ПОГЛЯДИ НАСЕЛЕННЯ УКРАЇНИ ЩОДО ОХОРОНИ ЗДОРОВ’ЯТА ІНШИХ ПИТАНЬ: СІЧЕН...ДУМКИ І ПОГЛЯДИ НАСЕЛЕННЯ УКРАЇНИ ЩОДО ОХОРОНИ ЗДОРОВ’ЯТА ІНШИХ ПИТАНЬ: СІЧЕН...
ДУМКИ І ПОГЛЯДИ НАСЕЛЕННЯ УКРАЇНИ ЩОДО ОХОРОНИ ЗДОРОВ’ЯТА ІНШИХ ПИТАНЬ: СІЧЕН...
 
Оцінка рівня соціальної безпеки в умовах поширення коронавірусної інфекції
Оцінка рівня соціальної безпеки в умовах поширення коронавірусної інфекціїОцінка рівня соціальної безпеки в умовах поширення коронавірусної інфекції
Оцінка рівня соціальної безпеки в умовах поширення коронавірусної інфекції
 

Recently uploaded

+971565801893>>SAFE AND ORIGINAL ABORTION PILLS FOR SALE IN DUBAI AND ABUDHAB...
+971565801893>>SAFE AND ORIGINAL ABORTION PILLS FOR SALE IN DUBAI AND ABUDHAB...+971565801893>>SAFE AND ORIGINAL ABORTION PILLS FOR SALE IN DUBAI AND ABUDHAB...
+971565801893>>SAFE AND ORIGINAL ABORTION PILLS FOR SALE IN DUBAI AND ABUDHAB...
Health
 

Recently uploaded (16)

Albania Vs Spain South American coaches lead Albania to Euro 2024 spot.docx
Albania Vs Spain South American coaches lead Albania to Euro 2024 spot.docxAlbania Vs Spain South American coaches lead Albania to Euro 2024 spot.docx
Albania Vs Spain South American coaches lead Albania to Euro 2024 spot.docx
 
Netherlands Players expected to miss UEFA Euro 2024 due to injury.docx
Netherlands Players expected to miss UEFA Euro 2024 due to injury.docxNetherlands Players expected to miss UEFA Euro 2024 due to injury.docx
Netherlands Players expected to miss UEFA Euro 2024 due to injury.docx
 
Slovenia Vs Serbia Eurovision odds Slovenia have top.docx
Slovenia Vs Serbia Eurovision odds Slovenia have top.docxSlovenia Vs Serbia Eurovision odds Slovenia have top.docx
Slovenia Vs Serbia Eurovision odds Slovenia have top.docx
 
Croatia vs Italy Inter Milan Looking to Carry On Success at Euro 2024.pdf
Croatia vs Italy Inter Milan Looking to Carry On Success at Euro 2024.pdfCroatia vs Italy Inter Milan Looking to Carry On Success at Euro 2024.pdf
Croatia vs Italy Inter Milan Looking to Carry On Success at Euro 2024.pdf
 
basketball evolution History Slides.pdf
basketball evolution  History Slides.pdfbasketball evolution  History Slides.pdf
basketball evolution History Slides.pdf
 
Cricket Api Solution.pdfCricket Api Solution.pdf
Cricket Api Solution.pdfCricket Api Solution.pdfCricket Api Solution.pdfCricket Api Solution.pdf
Cricket Api Solution.pdfCricket Api Solution.pdf
 
Hire 💕 8617370543 Amethi Call Girls Service Call Girls Agency
Hire 💕 8617370543 Amethi Call Girls Service Call Girls AgencyHire 💕 8617370543 Amethi Call Girls Service Call Girls Agency
Hire 💕 8617370543 Amethi Call Girls Service Call Girls Agency
 
Italy vs Albania Italy Euro 2024 squad Luciano Spalletti's full team ahead of...
Italy vs Albania Italy Euro 2024 squad Luciano Spalletti's full team ahead of...Italy vs Albania Italy Euro 2024 squad Luciano Spalletti's full team ahead of...
Italy vs Albania Italy Euro 2024 squad Luciano Spalletti's full team ahead of...
 
Personal Brand Exploration - By Bradley Dennis
Personal Brand Exploration - By Bradley DennisPersonal Brand Exploration - By Bradley Dennis
Personal Brand Exploration - By Bradley Dennis
 
Technical Data | Sig Sauer Easy6 BDX 1-6x24 | Optics Trade
Technical Data | Sig Sauer Easy6 BDX 1-6x24 | Optics TradeTechnical Data | Sig Sauer Easy6 BDX 1-6x24 | Optics Trade
Technical Data | Sig Sauer Easy6 BDX 1-6x24 | Optics Trade
 
Spain Vs Italy Spain to be banned from participating in Euro 2024.docx
Spain Vs Italy Spain to be banned from participating in Euro 2024.docxSpain Vs Italy Spain to be banned from participating in Euro 2024.docx
Spain Vs Italy Spain to be banned from participating in Euro 2024.docx
 
Genuine 8617370543 Hot and Beautiful 💕 Etah Escorts call Girls
Genuine 8617370543 Hot and Beautiful 💕 Etah Escorts call GirlsGenuine 8617370543 Hot and Beautiful 💕 Etah Escorts call Girls
Genuine 8617370543 Hot and Beautiful 💕 Etah Escorts call Girls
 
JORNADA 6 LIGA MURO 2024TUXTEPECOAXACA.pdf
JORNADA 6 LIGA MURO 2024TUXTEPECOAXACA.pdfJORNADA 6 LIGA MURO 2024TUXTEPECOAXACA.pdf
JORNADA 6 LIGA MURO 2024TUXTEPECOAXACA.pdf
 
Belgium Vs Slovakia Belgium at Euro 2024 Teams in group, fixtures, schedule, ...
Belgium Vs Slovakia Belgium at Euro 2024 Teams in group, fixtures, schedule, ...Belgium Vs Slovakia Belgium at Euro 2024 Teams in group, fixtures, schedule, ...
Belgium Vs Slovakia Belgium at Euro 2024 Teams in group, fixtures, schedule, ...
 
+971565801893>>SAFE AND ORIGINAL ABORTION PILLS FOR SALE IN DUBAI AND ABUDHAB...
+971565801893>>SAFE AND ORIGINAL ABORTION PILLS FOR SALE IN DUBAI AND ABUDHAB...+971565801893>>SAFE AND ORIGINAL ABORTION PILLS FOR SALE IN DUBAI AND ABUDHAB...
+971565801893>>SAFE AND ORIGINAL ABORTION PILLS FOR SALE IN DUBAI AND ABUDHAB...
 
Unveiling the Mystery of Main Bazar Chart
Unveiling the Mystery of Main Bazar ChartUnveiling the Mystery of Main Bazar Chart
Unveiling the Mystery of Main Bazar Chart
 

Европейские футбольные клубы в 2016 году

  • 1. The European Club Footballing Landscape Club Licensing Benchmarking Report Financial Year 2016
  • 2. 2
  • 3. Club Licensing Benchmarking Report: Financial Year 2016 Foreword Welcome to the ninth edition of the UEFA Club Licensing Benchmarking Report, which once again focuses on financial and other off-the-pitch developments in European club football. In this latest edition of our report, the success story of European football stands out once more. It shows that UEFA’s regulatory role in financial fair play continues to steady the ship of European football finances and provide a basis for unprecedented growth, investment and profitability. It also demonstrates that while the game remains essentially the same on the pitch, it continues to change significantly off the pitch, making it essential that we at UEFA and our other stakeholders continue to remain vigilant and true to our values. This detailed report shows that the positive revenue, investment and profitability trends identified in last year’s report are continuing. The underlying health of European club football is highlighted, with the 700 top-division clubs together generating the highest operating profits before transfers in history and year-on-year revenue growth of almost 10%. Clubs are generating revenue but they are also investing in assets and infrastructure, thanks in part to UEFA’s financial fair play regulations. For the first time, club investments in stadiums and other long-term fixed assets exceeded €1bn in 2016. It is therefore perhaps not surprising that an increasing number of national associations and leagues, both inside and outside Europe, are starting to implement their own versions of financial fair play. The data from this report and other research from our new intelligence centre helps inform our decision-making. Once more, we cannot help but note that the polarisation of commercial and sponsorship revenues between the top tier of clubs and the rest is accelerating. The top 12 ‘global’ clubs generated a dramatic increase in commercial and sponsorship revenues of €1.58bn in six years – more than double the increase of all other European top-division clubs combined. As the guardians of the game, UEFA must ensure that football remains competitive even as financial gaps are augmented by globalisation and technological change. Reflecting the objective of financial fair play to bring ever greater transparency to European football, this report once again provides fascinating, forensic details on clubs from all 55 UEFA member associations. It also provides some food for thought, analysing the record transfer activity that we saw in the summer 2017 transfer window, highlighting the significant level of agent commissions and agent concentration, looking at multi-club ownership, and comparing the major clubs’ social media reach with that of their star players. We would like to thank all the national associations, leagues and clubs that contributed their financial information and the whole club licensing network for their invaluable assistance. Aleksander Čeferin UEFA President 3
  • 4. 4
  • 5. Introduction For other industries changes in the landscape are accepted as an inevitable fact of life. However for European football, with its unique, stable model of more than a thousand professional football clubs, a direct connection from the grassroots to the professional game and the importance of mutual cooperation and competition between clubs, changes to the landscape can bring challenges. This report includes the traditional analysis of attendance trends, domestic league structures and club finances based on data provided directly to UEFA and more than 500 follow-up clarifications. In addition, highly topical new subjects are discussed, such as a comparison of clubs’ and players’ social media footprints, an analysis of football agent commission rates and agent concentration across leagues, the overlap between the 2017/18 league start and transfer window end, and the increase in both cross-border and multi-club ownership. Club sponsorship is presented from various angles, with revenues divided into sponsor types, shirt prices compared, the different types of shirt sponsorship analysed and the ultimate sources of shirt sponsorship researched by industry. Within the last year, the UEFA Executive Committee has approved the creation of a new strategic research unit – a UEFA intelligence centre – which is made up of data scientist, an econometricist, a statistician and a rights advisor, who together combine specific technical expertise with in-depth knowledge of the football landscape. The primary objective of the intelligence centre, which is part of the Financial Sustainability and Research division and reports to the UEFA General Secretary, is to provide balanced strategic research insights to inform the policy-making and decision-taking of football’s key stakeholders. The production of this report now falls within the competence of the UEFA intelligence centre and continues to contribute to one of the existing objectives of club licensing and financial fair play, namely to increase transparency in the off-pitch workings of European. This report would not have been possible without the considerable input and support of a great many national licensing managers and clubs and numerous colleagues to whom we extend our thanks. Sefton Perry Head of the UEFA Intelligence Centre Analytics The European Club Footballing Landscape continues to be the authoritative review of European club football, on the one hand providing a granular guide to club football across all 55 UEFA member associations and on the other hand identifying and documenting many of the important trends of our time. Since the first report published in 2007 we have tried to document and present the landscape of European club football without excessive editorial control. We present the facts – some positive and some less so. This has been acknowledged by all the major football stakeholders who rely on the publication as a definitive guide to off-pitch developments in club football. The success story that is European club football is apparent from the facts contained over the next 120 or so pages. Few, if any, activities come close to matching the continuous 10% year-on-year growth in revenues that European club football has generated since the turn of the century. This is a testament to the underlying strength and depth of existing supporter loyalty and the ability of clubs to reach out to new supporters. Everything depends on this: the continuing growth in TV revenues and the accelerating growth in sponsorship and commercial partnerships are all business arrangements predicated on accessing the end ‘customer’, namely the huge pool of football supporters. While the ultimate source of club revenue remains essentially the same, the twin forces of technology and globalisation are leading to an unprecedented reshaping of the club football landscape. Only a limited number of clubs are able to fully exploit the enormous commercial opportunities offered by the global market. These clubs are opening offices across the world, introducing new categories and tiers to their commercial partnerships and using technology to offer tailored access to their supporters and expand the brand of both the clubs and their partners. This report covers the financial developments of 681 top-division clubs across more than 50 leagues and documents the growing financial polarisation between clubs and their diverging business models. While uplifted TV contracts have generated 86% of revenue growth this decade for all but the largest clubs in the top six leagues, and UEFA club competition prize money and solidarity payments have provided 50% of all revenue growth for clubs outside the top six leagues, it is sponsorship and commercial revenues that have driven the revenue growth of the top dozen European clubs, contributing 55% of all their new revenue since 2010. Club Licensing Benchmarking Report: Financial Year 2016 5
  • 6. Competitions and supporters Ownership Sponsorship AgentsTransfers Wages Profitability Balance sheets Revenues Operating costs 7
  • 7. Domestic competition and supporter highlights League formats and recent changes across Europe UEFA coefficients over the decade European attendance levels Social media profiles European club websites Contents Domestic competitions and supporters Sponsorship Foreword Ownership Ownership highlights European club ownership Foreign ownership Multi-club ownership 3 9 10 12 13 16 18 20 21 22 24 8 27 19 1 3 4 2 Transfer highlights Transfer spending Transfer windows Transfers 5 36 37 38 42 Agents Agent highlights Agents’ commissions Agent representation 45 46 51 44 Club revenue highlights European club revenue growth European club revenue levels Broadcasting revenue Revenue from UEFA Gate receipts revenue Sponsorship and commercial revenue Revenue mix Club revenues 54 55 56 59 64 68 70 73 77 6 Wage and squad cost highlights Wage growth Wage levels Breakdown of wages Wage and squad costs 80 81 82 84 87 Sponsorship highlights Kit manufacturers Principal sponsors Sleeve sponsors and stadium naming rights 28 29 32 35 7 OVERVIEW Introduction 4 Operating and transfer cost highlights Transfer costs and income European club operating costs Operating and transfer costs 90 91 92 95 8 Profitability highlights Profitability trends Underlying operating profitability Bottom-line profitability Underlying and bottom-line profitability 99 100 101 105 108 9 Balance sheet highlights European club assets European stadium ownership and investment Player assets Net debts Appendix Balance sheets 112 113 114 115 119 121 125 10 Club Licensing Benchmarking Report: Financial Year 2016 7
  • 8. Domestic competitions and supporters 1 8
  • 9. 9 Club Licensing Benchmarking Report: Financial Year 2016 Domestic competition and supporter highlights 22 European clubs’ websites now receive over a million monthly visitors, with the percentage of foreign visitors ranging from 91% (FC Barcelona) to 5% (Galatasaray SK) Four leagues (in Georgia, Greece, Kazakhstan and Moldova) have changed their competition structures for 2017/18 CONTENTS OVERVIEW League attendances decreased in 2016/17 in 62% of leagues, reversing some of the 2015/16 attendance increases
  • 10. CONTENTS OVERVIEW Number of clubs in top division 20 18 16 15 14 12 10 8 6 ENG, ESP, FRA, ITA GER, NED, POR, TUR BEL, BLR, CZE, GRE, NOR, POL, RUS, SRB, SWE SMR BUL, CYP, DEN, ISR, LUX, MLT, ROU BIH, FIN, HUN, IRL, ISL, KAZ, KOS, MDA, NIR, SCO, SVK, UKR, WAL ALB, AUT, CRO, EST, FRO, GEO, GIB, MKD, MNE, SUI, SVN AND, AZE, LTU, LVA ARM Changes in number of clubs participating in top division (2015/16 to 2017/18) Compared with 2015/16, the total number of top-division clubs in Europe has fallen by five, continuing the long-term downward trend. Malta increased its top division from 12 to 14 clubs, with Ukraine doing the opposite. Moldova increased from 11 to 12, while Montenegro reduced from 12 to 10. Georgia introduced the most radical change, reducing its top division from 14 to 10 clubs. This brings the total number of clubs in all 55 European top-division leagues to 713 clubs. UKR MDA MLT MNE 18 16 14 12 10 8 6 AZE BIH ARM LTU LVA GEO BLR BUL DEN League formats and recent changes across Europe 10 CHAPTER 1: Domestic competitions and supporters Changes in the scheduling of championships are rare but Moldova, much like Georgia in 2015/16, is running a spring to autumn season to transition from a winter to summer format, making it the 12th country to introduce a summer championship. Kosovo, this year’s newcomer to the European club footballing landscape, is among the 43 countries following the winter model. Summer championship Winter championship 43x 12x
  • 11. TWO rounds (17) BLR CZE ENG ESP FRA GER GRE ISL ITA LUX MDA NED NOR POR RUS SWE TUR FOUR rounds (10) ALB AUT AZE CRO EST GEO LVA MKD SUI SVN BEL BIH BUL CYP DEN ROU UKR WAL THREE rounds (10) FIN FRO GIB HUN IRL KAZ KOS MLT MNE SVK NIR SCO SMR POL SRB ISR Split TWO & TWO (8) Split TWO & ONE (2) SIX rounds (1) ARM No league, only cup (1) Basic format of domestic top-tier leagues (summer 2017 and winter 2017/18 seasons) Four leagues have made significant adjustments to their competition formats. Georgia has moved from a transitional format of two groups of clubs each playing 12 matches to a league in which 10 teams play four rounds. Similarly to Georgia, Moldova introduced a transitional season in 2017 in which 10 teams play each other twice. Kazakhstan has moved to a traditional format with three rounds instead of a split- season format. Lithuania is now the only country to play four rounds before going to a final championship round, while Greece has kept its same basic format but removed the post-season play-off for European competitions. A total of 38 leagues (69%), including the most well-known leagues with global audiences, can be described as traditional, with each team playing each of the other teams twice (17), three times (10), four times (10) or six times (Armenia). The other 17 leagues adopt a different approach, splitting their teams into groups based on their rankings at a specific point in the season. The country trigrams of these leagues can be found overlapping two or more circles, indicating how many rounds are played before and after the leagues split. Split THREE & TWO (1) Split THREE & ONE (2) COMPLEX (2) LIE AND Split FOUR & ONE (1) LTU 11 Club Licensing Benchmarking Report: Financial Year 2016 CONTENTS OVERVIEW Four leagues changed domestic league structure for 2017/18
  • 12. Trends over the last decade The trends in the top 10 tend to be more stable than lower down the table, where one good series of results by a club can make a significant difference to the country’s average coefficient. Nonetheless, the reversal of France and Germany in 3rd and 4th place was highly significant at the time, as a fourth spot in the UEFA Champions League changed hands as a result. The most dramatic fluctuation in the top half of the rankings is Romania’s rise to 7th place in 2008, its subsequent fall from from 8th in 2010 to 22nd just two seasons later, and its recovery to 15th place. UEFA club and country rankings reflect the average results of clubs over the last five seasons and can therefore provide a good indication of trends and the relative success of clubs from each country in UEFA club competitions over time. Lithuania is the country that has lost the most ground over the last decade, dropping 15 places from 33rd in 2007 to 48th in 2017. The other big decliners are Scotland, who have dropped 13 places to 23rd place, and Romania, Bulgaria and Latvia, who have all fallen 10 places to 17th, 27th and 41st place respectively. The three biggest climbers over the past decade are Belarus, who have moved up 21 places to 19th place, and Azerbaijan and Kazakhstan, who have both moved up 16 places to 26th and 29th place respectively. The rise and fall in UEFA coefficients over the decade Change ESP GER ENG ITA FRA RUS POR UKR BEL TUR CZE SUI NED GRE AUT CRO ROU DEN BLR POL SWE ISR SCO CYP NOR AZE BUL SRB KAZ SVN SVK LIE HUN MDA ISL FIN ALB IRL BIH GEO LVA MKD EST MNE ARM LUX NIR LTU MLT WAL FRO GIB AND SMR KOS ENG ESP ITA FRA GER RUS ROU POR NED SCO TUR UKR BEL GRE CZE SUI BUL NOR DEN AUT SRB ISR SWE SVK POL HUN CRO CYP SVN FIN LVA BIH LTU MDA IRL MKD ISL GEO LIE BLR EST AZE ALB ARM KAZ NIR WAL FRO LUX MLT AND MNE SMR GIB KOS 12 CHAPTER 1: Domestic competitions and supporters CONTENTS OVERVIEW
  • 13. European attendance levels broadly stable The 2016/17 attendance figures of top domestic leagues totalled just under a hundred million. Compared with 2015/16, total attendances were down 1%, primarily due to the mix of clubs promoted/relegated in England and Germany. Attendances were generally stable across Europe, with 18 countries reporting a year-on-year change of less then 5%. While five leagues reported a significant increase of more than 15%, there were eight leagues, all in eastern Europe, that reported a notable decrease of more than 15%. Attendance figures will continue to be monitored carefully by the UEFA Intelligence Centre, since the number of people attending matches is a simple but significant indicator of the health of club football. 5xIncrease of 15%+ 8xIncrease of 5% to 15% 18xStable (<5% increase/decrease) Decrease of 5% to 15% 8xDecrease of 15%+ 5xUnknown 11x Aggregate match attendance trends (2015/16 to 2016/17) 13 Club Licensing Benchmarking Report: Financial Year 2016 CONTENTS OVERVIEW
  • 14. Eleven clubs enjoyed over one million league spectators For the first time in European football, 11 clubs have reported aggregate league attendances of over a million. New in this category since last year are West Ham United FC, Celtic FC and Liverpool FC. West Ham United FC, who completed a move to London Stadium, and Rangers FC jumped into this season’s top 20, replacing Newcastle United FC and VFB Stuttgart, who were both relegated at the end of 2015/16. Top 20 European clubs by aggregate attendances (2016/17) Top 20 clubs based on aggregate attendances (2016/17) Club with 2015/16 European rank by total season home LEAGUE attendances Average Total 1. FC Barcelona (ESP) 78,034 1,482,646 2. Manchester United FC (ENG) 75,290 1,430,510 3. Borussia Dortmund (GER) 79,653 1,354,101 4. Real Madrid CF (ESP) 69,426 1,319,094 5. FC Bayern München (GER) 75,000 1,275,000 6. Arsenal FC (ENG) 59,957 1,139,183 7. West Ham United FC (ENG) 56,972 1,082,468 8. Celtic FC (SCO) 54,726 1,039,794 9. FC Schalke 04 (GER) 60,703 1,031,951 10. Manchester City FC (ENG) 54,019 1,026,361 11. Liverpool FC (ENG) 53,016 1,007,304 12. SL Benfica (POR) 55,952 951,184 13. Rangers FC (SCO) 49,156 933,964 14. Hamburger SV (GER) 52,341 889,797 15. FC Internazionale Milano (ITA) 46,622 885,818 16. VfL Borussia Mönchengladbach (GER) 51,494 875,398 17. Paris Saint-Germain FC (FRA) 45,160 858,040 18. Hertha BSC Berlin (GER) 50,267 854,539 19. Club Atlético de Madrid (ESP) 44,710 849,490 20. AFC Ajax (NED) 49,620 843,540 14 CHAPTER 1: Domestic competitions and supporters CONTENTS OVERVIEW
  • 15. Biggest increases in average club attendance (5,000+) Seven clubs added 5,000 or more to their average season match attendances between 2015/16 and 2016/17. At the top of the list is West Ham United FC, who benefitted from their move to London Stadium. FC Krasnodar also moved to a new venue with increased capacity in 2016/17, with Liverpool FC also boosted by the addition of a new tier in the main stand at Anfield. Germany and England provide five of top ten most attended leagues Top 10 European leagues by total attendance (2016/17) The Portuguese Primeira Liga is this year’s newcomer in the top 10 for aggregate attendances, replacing the Spanish Segunda División. SL Benfica, Sporting Lisbon and FC Porto are the main drivers of Portugal’s average attendances, each averaging crowds of 37,000 to 56,000, compared with 2,000 to 19,000 for all other Portuguese teams. Once again, the German Bundesliga reported the highest average attendance of all European leagues. The Premier League ranks higher for aggregate attendance due to its higher number of teams and therefore matches. The English Championship joined the English Premier League, German Bundesliga and Spanish La Liga in reporting aggregate attendances of over 10 million in 2016/17. 15 Club Licensing Benchmarking Report: Financial Year 2016 CONTENTS OVERVIEW
  • 16. Top 20 most followed European clubs all from ‘big6’ TV markets Number of followers on Last year’s report analysed the most successful official club websites; this year we look at the most successful social media profiles among European clubs. Numberoflikeson A total of 14 European clubs currently* have more than ten million likes on Facebook. Five of these fourteen clubs also have more than ten million followers on Twitter. The chart on the right includes the top 20 clubs by Twitter followers. If the top 20 had been based on Facebook likes, Leicester City FC and Inter Milan would have replaced AS Monaco and Olympique Marseille. Top 20 clubs and players by Twitter and Facebook popularity FC Bayern have a higher following on Facebook than on Twitter. * The social media figures presented in this section were collected in November 2017. Cristiano Ronaldo ** Both Lionel Messi (no official Twitter account) and Zlatan Ibrahimović have been included to the chart due to the high number of fans they have on Facebook. In many cases, top players have just as large a social media following as the clubs they play for. This is particularly the case on Twitter. Cristiano Ronaldo, the most popular player, has more Twitter followers than Real Madrid CF and FC Barcelona combined (65.3 million) and more fans on Facebook than any of Europe’s top-division clubs (122 million). Real Madrid CF and FC Barcelona are much more popular on social media than the other top European clubs. Lionel Messi** Neymar Mesut Özil Andres Iniesta James Rodriguez Gareth Bale Wayne Rooney Gerard Piqué Radamel Falcao Zlatan Ibrahimović** Sergio Ramos Luis Suarez Sergio Aguero Cesc Fàbregas David De Gea Robin van Persie Marcelo David Luiz Twelve active football players currently list over 10 million followers on Twitter, whereas only five clubs have reached this milestone to date. Daniel Alves 16 CHAPTER 1: Domestic competitions and supporters CONTENTS OVERVIEW
  • 17. Players more popular on Twitter and clubs more popular on Facebook 17 Club Licensing Benchmarking Report: Financial Year 2016 In contrast to Twitter followings, the Facebook followings of clubs are generally higher than that of their most followed player (15 out of 20 clubs). Whereas Neymar (Paris Saint-Germain) and Radamel Falcao (AS Monaco), the main outliers, were more than five times more popular on Twitter, the difference on Facebook is considerably smaller. In aggregate terms the 20 clubs total 642 million Facebook followers and the 20 players of those clubs total only 485 million Twitter followers. The Twitter following of the top player exceeds the following of his club in the majority of cases (11 out of 20 clubs) and is significantly higher in aggregate terms with the 20 clubs totalling 161million Twitter followers and the 20 players of those clubs totalling 244million Twitter followers. 0.2x Same 5x 0.1x Same 2x0.5x 1.5x2.5x The relative social media followings of clubs and their top players is further explored below. The bar charts indicate the Twitter and Facebook followings of the top 20 clubs, alongside those of the most- followed player from each club. The line charts above, featuring the club logos, pinpoint the social media profile of each club relative to that of their most popular player.  Club more popular  Club more popular Player more popular Player more popular  Total Clubs: 161 million Total Players: 244 million Total Clubs: 642 million Total Players: 485 million CONTENTS OVERVIEW
  • 18. Global profile of largest clubs clear from online traffic Top 25 most popular club websites in September (in millions) Distribution of website visitors The clubs that generate the most visitors to their websites tend to have a broad reach that encompasses their domestic market and other global markets. Further down the top 25, interest is clearly more concentrated in home markets. Remarkably, FC Barcelona is the only club in the top 25 that was not visited most by people in the country in which it plays its domestic matches, with 8.9% of visitors in Spain and 9.5% in the USA. On the contrary, Turkish giants Fenerbahçe SK and Galatasaray SK attracted only 4 to 5% of their website visitors from foreign markets. In total, 22 European club websites attracted more than one million visitors in the month September. In line with their social media popularity, Real Madrid CF had the highest number of visitors, just ahead of Manchester United FC. In the previous report, the success of official club websites was measured by the peak month’s visitor tally and the average number of minutes spent on the website. This year’s report focusses on the number of visitors recorded in September, where these visitors accessed the websites from and how. 18 The access ratios (whether visitors used desktop or mobile devices) appear to be more balanced across the 25 club websites. Celtic FC had the lowest percentage of desktop access (24%) and Spartak Moskva the highest (66%), its website having been accessed more by desktop devices than mobile). In general the trend is towards increasing access from mobile devices. CHAPTER 1: Domestic competitions and supporters CONTENTS OVERVIEW
  • 20. Ownership highlights Foreign owners have invested in 40 European clubs since the introduction of financial fair play, and the percentage of foreign-owned clubs in major leagues has increased to 19% Club ownership in major leagues is relatively stable, with only 5% of clubs changing hands in the last 12 months More than 20 clubs in the top 15 major European leagues are linked to multi-club ownership structures 20 CHAPTER 2: Ownership CONTENTS OVERVIEW
  • 21. European club ownership profile European club ownership As initiated in last year’s edition of the European Club Footballing Landscape, the next few pages of the report will provide a high-level summary of club ownership, ownership profiles and trends in 15 of Europe's major leagues* (now including the Austrian Bundesliga and Greek Super League). The analysis on this page identifies whether clubs have controlling parties (owning more than 50% of shares) and whether the majority owners are domestic or foreign nationals. The two following pages offer a timeline of foreign ownership and the section ends with some examples and a timeline of multi-club ownership in global club football. Type of ownership * Information sourced from a combination of club representations submitted as part of the club licensing process (March-July 2017) and UEFA desktop research (up to September 2017). ** ‘No controlling party’ in this analysis refers to no single or group of owners working in concert with more than a 50% holding in the voting share capital. Foreign club ownership No controlling party** ENG ENG-2 ITA The English Premier League (65%) and Championship (58%) continue to top the list in terms of foreign club ownership. One of the newcomers in this study, Austria, is the only country in which no top-division clubs currently have an ultimate controlling party. This structure is also common in Portugal, Germany, the Netherlands and Turkey, where more than 75% of clubs have no controlling party (predominantly associations). The majority of the 256 clubs in this analysis have a controlling party, although a sizeable minority do not (37%). Of the 63% that have a controlling party, the majority have a domestic owner. A domestic owner is the most-common form of ownership in 6 of the 15 leagues analysed (RUS, UKR, GRE, ITA, FRA and BEL). TUR AUTFRA UKR RUS GER SUI BEL POR ESP GRE Club Licensing Benchmarking Report: Financial Year 2016 21 CONTENTS OVERVIEW Ten clubs changed ownership in the 12-month period from September 2016 to September 2017. Although some were high-profile changes (for instance in the cases of AC Milan, Southampton FC, Olympique de Marseille and FC Basel), club ownership remains relatively stable, affecting only 5% of the total club population in the 15 selected leagues. NED
  • 22. Nationality of foreign club owners changing over time 22 CHAPTER 2: Ownership * Note that this timeline only contains the milestones of current owners. If a club has been taken over multiple times in the period covered, only the latest acquisition is illustrated. ** ‘Other’ leagues in the timeline include foreign ownership in Belgium, Germany, Greece, the Netherlands, Portugal and Switzerland. Austria, Russia, Turkey and Ukraine do not appear as there is currently no foreign ownership as shown on the map on the previous page. The club acquisitions highlighted across these two pages are quite revealing, not least in illustrating how the nationality profile of new club owners has changed over the last decade.* The most steady flow of new foreign owners has come from the USA, with US owners taking over clubs in most of the years reviewed. By contrast, the number of high-profile Russian and Middle Eastern investors has noticeably fallen since 2008 to 2012. CONTENTS OVERVIEW Other** Serie A La Liga Ligue 1 Championship Premier League
  • 23. 23 Club Licensing Benchmarking Report: Financial Year 2016 More than 70% of all foreign takeovers in the top 15 leagues since 2016 have involved Chinese investors. In this period Chinese owners have taken over clubs in the Premier League, Championship, Serie A, Ligue 1, La Liga and Eredivisie. With Aston Villa, Wolverhampton Wanderers, West Bromwich Albion and Birmingham City, all Birmingham- based football clubs in the top two English divisions have been taken over by Chinese nationals. CONTENTS OVERVIEW Origin of current foreign owners The timeline also highlights the intensity of new foreign ownership activity. After the record number of foreign acquisitions reported in 2016, when nine clubs acquired foreign owners, five new foreign owners were reported in 2017, which is back in line with the trend of previous years.
  • 24. At least 12 private owners with interests in more than one club 24 CHAPTER 2: Ownership The previous pages in this section focused largely on private owners acquiring a controlling stake in a football club. The next three pages aim to give an introduction to multi-club ownership across the same 15 leagues. The examples are split into three groups: private persons having control and/or a decisive influence over more than one football club, entities (“related entities”) having control and/or a decisive influence over more than one football club, and clubs having control and/or a decisive influence over other football clubs. Several private owners of foreign origin have control or a decisive influence over more than one football club. The map on the right illustrates five such examples involving at least one of the 15 leagues analysed. Besides the listed owners and private persons with a decisive influence over more than one football club, there are several agents reported to have an influence at more than one football club. One such example could be the reported involvement of an agent at a Cypriot club, in which he is listed as an investor, and Belgian club, where his relatives are listed as the current owner and a member of the board of directors respectively. CONTENTS OVERVIEW Type of owner with multi-club ownership Twelve ultimate owning parties currently own one club in the major European leagues and also have participation in one or more other football clubs.
  • 25. The second form of cross ownership involves ‘corporate entities’. City Football Group is probably the most well- known entity with ownership in five different continents. Other active examples that are illustrated on the map on the right are Red Bull, Traffic Sports, the Suning Group and Aspire Academy. The ‘club’ category is a relative new form of cross ownership in which a club has control and/or a decisive influence over another football club. The most recent high-profile examples are Atletico Madrid and AS Monaco acquiring stakes in the second-division RC Lens (France) and Cercle Brugge (Belgium). 25 Club Licensing Benchmarking Report: Financial Year 2016 CONTENTS OVERVIEW Ownership mix includes club groups and multi club arrangements
  • 26. Timeline of multi-club ownership The previous page gave some active examples of cross-ownership linked to the 15 selected leagues. This second timeline presents an overview of multi-club ownership over time. With the exception of Ajax Amsterdam, most examples of cross-club ownership have emerged in the last three years. The selected five corporation examples on the previous page have been involved in 26 football clubs worldwide since 1997. In addition, this timeline includes ENIC International Limited, who are no longer active across different clubs. Traffic Sports and Red Bull bought their shares more than seven years ago, while the activities of City Football Group, the Suning Group and Aspire Academy are more recent. 26 CHAPTER 2: Ownership CONTENTS OVERVIEW The increase in foreign ownership and the basic cross-ownership models referenced in this section are some of the numerous club ownership developments for regulators and governing bodies to consider. Following the era of third-party player ownership, the growing influence of agents at some clubs and the acquisition of lower-league clubs purely to facilitate transfer activity are further developments that could potentially threaten competition integrity. It is important for governing bodies to do at least the following three things in relation to potential club acquisitions: identify the direct and indirect source of investment, establish whether the investors have the means to fund both the club takeover and necessary further investment, and understand the underlying business case and motivation(s) for the acquisition.
  • 28. Sponsorship highlights The top three clubs generate more than 100 times the kit manufacturing revenue and 25 times the shirt sponsorship revenue of smaller clubs in their league Club kit manufacturers are surprisingly diverse, with 41 different brands and adidas and Nike’s combined market share just 40% Apart from most Premier League clubs and some top clubs in other leagues, most remain local brands, with just 24% sporting international shirt sponsors A number of kit manufacturer deals cover ten or more years with only one in eight clubs switching in 2017 28 CHAPTER 3: Sponsorship CONTENTS OVERVIEW
  • 29. Strong competition for club kit manufacturer deals Kit manufacturers’ share of the club market Changes in kit manufacturer Two kit manufacturers, Nike and adidas, are the most prevalent brands in the club kit manufacturing landscape. However, unlike many other sports, in which centralised kit deals are common, there is significant diversity within European kit manufacturing. The combined market share of the two market leaders is only 40% and there are 41 different kit manufacturers featuring in just the 16 leagues analysed for this report. In four of the 16 leagues no club changed their kit manufacturer for 2017/18. At the other end of the scale, just 63% of Belgian top-division clubs retained the same kit manufacturer, with six clubs changing for 2017/18. There is no local market dominance, with no individual kit manufacturer sponsoring more than half of the clubs in any of the selected leagues. adidas sponsors seven Russian top-division teams and Nike sponsors eight Turkish top-division teams, giving them a market share of 44% in those leagues. This is the highest percentage across any of the 16 leagues. * The ‘Other’ category includes all kit manufacturers that sponsor fewer than 10 clubs, including Jako (9), Kappa (8), Lotto, New Balance (both 7), Hummel and Legea (both 6). Across the 268 clubs analysed in the 16 leagues, there is relative stability in the kit manufacturing landscape. Just 13% of the clubs changed their kit manufacturer for the 2017/18 season. Of the six kit manufacturers that provide the kits of at least ten clubs within this 16-league sample, the shirts manufactured by Nike have the highest average selling price at €71, compared with an average of €54 for Joma kits. This is clearly impacted by each brand’s specific club and league mix. The significant value and long contract length of kit manufacturer deals for the largest clubs is highlighted by the one-off contract termination payment of £67m which Chelsea FC incurred when switching kit manufacturers and cancelling their existing contract six years early. 29 Club Licensing Benchmarking Report: Financial Year 2016 CONTENTS OVERVIEW
  • 30. Large range in kit manufacturer values between different clubs 30 CHAPTER 3: Sponsorship This page provides a high-level overview of the kit manufacturer landscape, presenting a cross-section of 30 clubs with indicative value ranges for their latest announced kit manufacturing deals*, some of which have not yet come into force. The same analysis is provided for shirt sponsors later in this section and a more detailed analysis of trends and levels of sponsorship and commercial values based on audited FY2016 values, analysed right across the top 20 leagues, is presented later in the revenue section of this report. * Transforming long term kit manufacturing deals into an annual sum is not an exact science, with payment structures (even weighted, front or back loaded) and bonus structures (signing bonuses, performance related bonuses, penalty clauses, extension options or other commercial clauses) adding a degree of subjectivity to the annual valuation. In addition care should be taken when comparing deals or compiling lists (hence the use of indicative value ranges in this analysis) since there can be considerable variation in the kit manufacturing contract arrangements (pure kit supply/merchandising deal or additional sponsorship) and deal structures (merchandising profit or income share and/or fixed sum payment). Value ranges and contract lengths based on TVSM data with UEFA sanity checks applied. €75m €25m Kit manufacturer annual deal value ranges* €75m €25m €10m €10m€3m €150m In common with other sponsorships and commercial partnerships, the value of a club’s kit manufacturer deal is influenced by the profile of the club, both the potential reach of the club/league and also the level of success associated with the club ‘brand’. However the kit manufacturer deal involves a product rather than just an association and so the value to the kit manufacturer is also heavily influenced by the supporter base and potential revenue from merchandising. The latest kit manufacturing contracts across the sample of 30 major clubs average 8 years, a relatively long period in club football terms, given that both TV contract cycles and main shirt sponsors tend to be across 3 to 5 years. Indeed 12 of the 30 clubs analysed have long term kit manufacturing deals of at least ten years with others having shorter contracts but renewing new deals with the same kit supplier. The spread of clubs across value ranges clearly illustrates the wide difference in deal value between the very largest clubs and other big clubs. The top three clubs receive kit manufacturing income more than 10 times many domestic rivals and more than 100 times the majority of smaller clubs in their domestic league. Majority of clubs < €1m Kit manufacturer duration latest contract Average: 7.9 years CONTENTS OVERVIEW
  • 31. Wide range of club shirt prices within each league Average shirt price in selected leagues** This section focusses on two of the most high-profile types of club sponsorship: kit manufacturers and main shirt sponsors*. A similar sample size is used as in the previous chapter on ownership, with the sponsorship section focusing on a selection of 16 major European leagues representing 268 clubs. The section starts with an analysis of the prices of new 2017/18 replica shirts according to the official club websites. This is followed by a market concentration and stability analysis of the main kit manufacturers and a geographical and industry concentration and stability analysis of the main shirt sponsors. This section ends with an analysis on the use and size of different sponsoring types. High to low: In the German Bundesliga, the difference between the most expensive shirts (FC Bayern and Schalke) and the least expensive (Hamburger SV, Freiburg and Werder Bremen) is the lowest of all leagues, with a range of only €20. The Russian Premier League has the highest range from high to low, with an FC Zenit shirt costing almost four times as much as an FC Arsenal Tula shirt**. At €87 the Swiss Super League clubs have the highest average shirt price of for the 2017/18 season, placing them comfortably ahead of the German Bundesliga, the Italian Serie A and the French Ligue 1. The average shirt price in Ukraine is the lowest of the selected 16 leagues, at an average of €43. Club football shirt Official replica of the 2017/18 club shirt that is offered for sale on the official club website Kit manufacturer Brand that produces the first-team kit Shirt sponsor The sponsor named on the front of the home match shirt, typically also the main club sponsor 31 Club Licensing Benchmarking Report: Financial Year 2016 CONTENTS OVERVIEW * All shirt prices are presented in euros using the exchange rates applicable at the time of writing. **This study has collected shirt sale prices as of October 2017 offered on the various official club websites. Some clubs did not provide an option to buy the shirt via the website and have therefore been excluded in this study.
  • 32. Two out of three clubs still have a domestic shirt sponsor Origins of main sponsors Turnover of shirt sponsors In the top two English leagues and the Swiss top division around 40% of clubs changed their main sponsor for the 2017/18 season. In contrast, all the ten clubs in the Austrian top division retained the same shirt sponsor as in 2016/17 for the 2017/18 season. Despite the increasing global attractiveness of European club football, the majority of clubs in the 16 major leagues analysed remain local not global brands.* This is reflected in the primary shirt sponsorship deals, with 64% of shirt sponsors based in the same country as the club they sponsor. With 12% of clubs not having a shirt sponsor, this means only 24% of clubs have international shirt sponsors. Clubs in Austria, Greece, the Netherlands and Russia have only brands of domestic origin as shirt sponsors. The region providing the highest number of non-domestic shirt sponsors is Asia, with Asian companies appearing on 11% of European club shirts (31 different clubs). The English Premier League is the only league that features a majority of international shirt sponsors, with foreign companies appearing on 16 of the 20 club shirts. The Championship (English second tier) has foreign shirt sponsors on 12 of the 24 clubs’ shirts, reflecting both the international appeal and foreign ownership of English football clubs. One month into the 2017/18 season, 12% of clubs were still without a shirt sponsor, most commonly in Greece, where 7 of the 16 clubs still did not have a shirt sponsor. The origin and nature of shirt sponsorship deals in Europe differs widely. This study focuses on the main shirt sponsor a club selects for the full season. In some cases, however, clubs may decide to appoint different sponsors for their home, away or European matches or even on a match-to-match basis. In those cases, this study takes account only of the official shirt sponsor for the home kit contracted for the full season. In comparison with the stable relationship between clubs and kit manufacturers, the turnover of main shirt sponsors from year to year is considerably higher, with 22% changing between 2016/17 and 2017/18. In fact, if the 12% of clubs with no shirt sponsor are excluded, then exactly one in four clubs with a sponsor changed sponsor in 2017/18. * The separation of a company or brand into domestic and international can be a subjective exercise in certain cases. Where a shirt sponsor is headquartered domestically but the brand is international, it has been considered a domestic sponsor for this analysis. 32 CHAPTER 3: Sponsorship CONTENTS OVERVIEW
  • 33. Ratio of more than 25 to 1 in shirt sponsor values within leagues €75m €55m €25m Shirt sponsorship* annual deal value ranges €55m €25m €10m €10m€3m * Transforming long term shirt sponsorship deals into an annual sponsorship sum is not an exact science, as assumptions are needed for payment structures (even weighted, front or back loaded) and bonus structures (signing bonuses, performance related bonuses, penalty clauses, extension options or other commercial clauses). In addition care should be taken when comparing deals or compiling lists (hence the use of indicative value ranges in this analysis) since there can be considerable variation in the shirt sponsorship contract type (single or multiple shirt sponsorship deals) and in the packaged/bundled rights covered by the sponsorship deal (naming, signage, designation, hospitality IP rights etc) adding a degree of complexity and subjectivity to value comparisons. Value ranges and contract lengths based on TVSM data with UEFA sanity checks applied. In common with the kit manufacturer deal and other sponsoring and commercial partnerships, the value of a club’s principal shirt sponsorship deal is influenced by the profile of the club, both the potential reach of the club/league and also the level of success associated with the club ‘brand’. In most cases the principal shirt sponsor is considered the main club sponsor with the shirt sponsorship deal the largest individual club commercial contract. It is relatively common for the principal shirt sponsor to be associated with the main club investor/benefactor, especially in Eastern Europe and further down the football pyramid. The latest principal shirt sponsorship contracts across the sample of 30 major clubs average 4.4 years, with a tendency for higher value deals to also be longer term deals. As already indicated on the previous page, 12% of clubs across the largest 16 leagues didn’t have any principal shirt sponsor at the start of this season and one year deals, sometimes rolled-over, are not uncommon. Although the shirt sponsorship ratio is smaller than the kit manufacturing deals, the top three clubs nonetheless receive shirt sponsorship income more than 5 times many domestic rivals and more than 25 times the majority of smaller clubs in their domestic league. Majority of clubs < €3m Shirt sponsorship duration latest contract Average: 4.4 years 33 Club Licensing Benchmarking Report: Financial Year 2016 CONTENTS OVERVIEW
  • 34. The diverse appeal of club football reflected in shirt sponsor brands Branch of main sponsors The broad appeal of European club football is reflected in the diverse range of business sectors that sponsor club football, as the main shirt sponsor and not just a commercial partner. Even after grouping all the different company activities into just eight industry sectors, there is no dominant sector, with the list featuring both B2B and B2C companies. Gambling and sports betting companies are the most prevalent shirt sponsors in European football, with 45 active deals with such companies in place. Shirt sponsorship by gambling companies is widespread in the top two English divisions and the Greek top division, approximately 50% of the clubs in all three having gambling companies as their shirt sponsors. This level of concentration is equalled in two other leagues – the Swiss and Scottish top divisions – with financial service companies (banks and insurances) in Switzerland and construction and industrial goods companies in Scotland sponsoring half the clubs. Only 5 of the 212 different companies appear as shirt sponsors in more than one different league. The airline Fly Emirates is the most common shirt sponsor across the leagues, with six major shirt sponsorship deals in six different countries. Drinks manufacturer Red Bull, energy provider Gazprom and betting companies Dafabet and Marathonbet are the only other companies that appear in more than one league, albeit in just two countries each, underlining again the domestic nature of most shirt sponsors and the diversity in foreign shirt sponsorship. * The ‘Other’ category includes governmental organisations, charity institutions, academies and individual philanthropists. 34 CHAPTER 3: Sponsorship CONTENTS OVERVIEW
  • 35. Use of sleeve sponsorship and stadium naming rights varies Sleeve sponsor Shirt sponsor Kit manufacturer Stadium naming rights 88% 100% 26% Whereas kit manufacturers and shirt sponsors (main sponsors) have been a part of the sponsorship landscape for a long time in European club football, stadium naming rights and sleeve sponsors are less prevalent. Although sleeve sponsorship is common practice in 12 of the 16 analysed leagues, it is only used by just over half of the analysed clubs, as a number of leagues currently have no sleeve sponsorship. Stadium naming rights are even more concentrated. For the 2017/18 season only three leagues (Germany, Netherlands and Austria) had a majority of club stadiums with naming rights. Additional kit sponsorship is becoming more common in the European club sponsorship landscape and the examples are diverse, from training kit deals in England, to sponsors on shorts in Belgium, multiple sponsors on the front of shirts in France and sponsors on the back of shirts in Austria. Shirt sleeve sponsorship is another example that can be added to the list. In England and Germany, which are considered the two biggest commercial European football markets, 58% of clubs signed new agreements with a shirt sleeve sponsors before the start of the 2017/18 season. This type of sponsorship was previously centralised in the Bundesliga (single deal) and was introduced in the Premier League for the 2017/18 season. 56% This page of the report illustrates the use of different types of sponsorship across the 16 selected leagues. In addition to the previous pages (shirt sponsorship and kit manufacturers), it considers two other categories: sponsors that are displayed on the sleeve of football shirts (sleeve sponsors) and sponsors that acquire the naming rights of club football stadiums (stadium naming rights). The prevalence of such deals is illustrated as a percentage of clubs across the 16 leagues as well as in the flags of the countries in which the different types of sponsorship are common (over 50% of clubs). Stadium naming rights and shirt sleeve sponsors per league Percentage of clubs: 35 Club Licensing Benchmarking Report: Financial Year 2016 CONTENTS OVERVIEW
  • 37. Transfer highlights Transfer spending reached record levels of almost €5.6bn in summer 2017 80% of global transfer spending during the summer window was in the big five European leagues (ENG, ITA, FRA, ESP and GER) Summer 2017 featured 6 of the top 20 transfer fees of all time and ten reported transfers of €50m+ Of the 96 major transfers of €15m+ in summer 2017, only 4 players went to clubs in leagues outside the big five (3x Zenit and 1x Porto) Club Licensing Benchmarking Report: Financial Year 2016 37 CONTENTS OVERVIEW
  • 38. Record summer transfer spending fuelled by ‘big 5’ leagues Summer window spending (€billions) Summer window spending relative to club revenue (%) The summer window spending was equivalent to 28% of the projected total club revenue for the 2017 financial year, setting another new benchmark as this is 6% higher than the highest value in the last ten years. The total European spending during the summer 2017 transfer window reached a record high of €5.6bn. Clubs spent almost €1bn in the January transfer window, which suggests a total 2017/18 spend of €6bn to €7bn. The Premier League’s 29% share is 3% lower than last year. Most of that difference has been absorbed by the French Ligue 1’s increase from 5% to 15% of overall spending in summer 2017. Of the non-big five leagues, which account for 20% of the total, the English Championship has the largest share, at 4%. Share of overall summer transfer spending by clubs in the ‘big five’ European leagues Transfer spending by leagueEuropean transfer spending over the past decade This section reviews the most recent transfer activity (summer 2017) and sets it in context. The data is indicative only, since known values are supplemented with reported estimates. Detailed audited historic transfer data is analysed in the operating costs section of this report. 38 CHAPTER 4: Transfers CONTENTS OVERVIEW
  • 39. Almost 100 high value transfers (€15m plus) reported in summer The most significant jump in high-value transfers is visible in the €50m+ category, where the number of transfers is twice as high as in the 2016 summer transfer window. The number of high-value summer transfers has increased over time, as could be expected given the increase in club revenues. Of the 96 high-value transfers that occurred in the 2017 summer transfer window, French players appear to have been most in demand. Those 11 French players are followed by 8 Spanish and 7 Argentinian, English and Italian players. A total of 19 other transfers that do not appear in this list involved players of 19 different nationalities, demonstrating the international nature of playing talent. Nationalities involved in high-value transfers in summer 2017 39 Club Licensing Benchmarking Report: Financial Year 2016 Number of high-value transfers per category CONTENTS OVERVIEW
  • 40. Premier League most active in summer 2017 transfer market Net spend Transfer earningsTransfer spend +€231m +€56m +€13m +€8m -€10m -€15m -€78m -€111m -€118m -€772m The Premier League was both the biggest spender as well as the biggest earner of this summers transfer window. Despite being the biggest earner, the net spend of the Premier League is the lowest with -€772million. On the other side of the spectrum is Portugal who had a positive net result of +231m. Notable changes Outside the top 10 markets The Netherlands just missed the top by a margin after upping their spending from 40million to 67million this summer. Ukraine, Sweden and Norway are the countries that saw the biggest proportional growth in comparison to previous year. If the top 10 was listed by transfer earnings, the Netherlands and Romania would’ve made it on to the ranking instead of Turkey and Russia. Greece recorded the best net result of all non-top 10 countries with a plus of just under €20million. The French Ligue 1 reported a growth of 331% in comparison to last summers spending on the transfer market. This is by far the highest growth of the top 10 markets (comfortably above the Turkish Superlig who went up 92%). Although summer transfer spending of the English Championships decreased by 3% compared to last summer, the second divisions of the big nations continue to make up ground on mid-level nations in terms of transfer spending. The top 10 markets The top 10 leagues by transfer spend POR BEL ENG L2 ESP GER TUR RUS FRA ITA ENG 40 CHAPTER 4: Transfers CONTENTS OVERVIEW
  • 41. Four clubs dominated summer 2017 reported net transfer spending Net spend Transfer earningsTransfer spend +€256m -€71m -€24m -€51m -€153m +€34m -€3m -€203m -€153m -€353m Only two clubs (AS Monaco and FC Barcelona) out of the top 10 were able to balance their transfer activity. In contrast, four clubs (Paris Saint-Germain, AC Milan, Manchester City FC and Manchester United FC) had a considerably higher net spend than the other big spenders. Notable changes Outside the top 10 markets Inter Milan, Arsenal FC and Borussia Dortmund dropped out of the top 10 after having reported transfer spending of over €100m in the 2016 summer window, while the winner of the previous two editions of the UEFA Champions League, Real Madrid CF, has not featured in the top 10 in either of the previous two years. In a five-year ranking, three English clubs (Manchester City (1st), Manchester United (3rd) and Chelsea (4th)) make the top five in terms of transfer spending. These three English teams are accompanied by Paris Saint-Germain (2nd) and FC Barcelona (5th). In terms of transfer earnings over the same period, AS Monaco, Chelsea, SL Benfica, AS Roma and Juventus make up the top five. The top 10 markets The top 10 clubs by transfer spend 41 Club Licensing Benchmarking Report: Financial Year 2016 AS Monaco Bayern Munich Juventus Everton Manchester United FC Barcelona Chelsea AC Milan Manchester City Paris Saint- Germain CONTENTS OVERVIEW
  • 42. Considerable timing differences in summer transfer windows 30x> 80 days 12x71 – 80 days 7x61 - 70 days < 60 days 6x A total of 22 countries opened their summer transfer window (i.e. the window opened after the end of the previous season) for 83 days, which is the longest in Europe. The longest overall player registration period (winter and summer transfer windows combined) was 113 days, as seen in 11 countries ahead of the 2017/18 season. The timing in which transfers can be made differs considerably between UEFA’s 55 member associations. In 2017 Luxembourg was the first to open its summer transfer window, on 25 May, and Portugal was the last, on 3 July.* Bosnia-Herzegovina and Estonia are the countries with the shortest summer transfer windows, at 50 and 52 days respectively. Over the entire season, Latvia is the country with the shortest player registration period, at just 73 days. Summer 2017 transfer windows around Europe * Transfer window information was retrieved on 9 October from the FIFA TMS website, on which all associations enter their transfer window data directly. 42 CHAPTER 4: Transfers CONTENTS OVERVIEW
  • 43. A quarter of transfer spending after season opener * As domestic seasons usually kick off at the weekend, the exact overlap between the start of the season and end of the window may vary slightly. Some leagues also start earlier in the summer preceding a major tournament (e.g. August 2017, ahead of the 2018 World Cup). Therefore the summer 2018 overlap could potentially be a week shorter that shown here for 2017 in France, Germany, Portugal, Russia and Turkey. Overlap between start of season and transfer deadline Whereas the previous page looked at the length of the 55 UEFA member associations’ player registration periods, this page illustrates the overlap between those registration periods and the start of the season for the top 10 leagues by transfer spend (see p22). A total of €1.5bn was spent in the top 10 leagues between the start of the season and the day the various transfer windows closed. The Premier League accounted for almost one- third of this (€552m). Portugal has the longest period between the start of the season and the day the transfer window closes (47 days). By contrast, Serie A clubs had just 12 days’ overlap in 2017/18. Season starts Overlap Transfer window closes Transfer spend during overlap (€millions) Clubs spent 25% of their overall summer 2017 transfer spending after their domestic season started €16m €19m €31m €61m €89m €306m €122m €236m €79m €552m POR BEL TUR RUS ENG L2 GER ESP ITA ENG FRA 43 Club Licensing Benchmarking Report: Financial Year 2016 CONTENTS OVERVIEW
  • 45. Agent highlights Across some 2,000 transfers reviewed between 2014 and 2017, agents’ fees averaged 12.6% of the transfer fee – a significant cost for clubs There is no ‘typical’ agent commission – 769 deals involved agents’ fees of less than 10%, 576 involved fees of 10 to 20% and 646 involved fees of more than 20% In general, agents’ commissions are higher on smaller deals – averaging less than 10% on deals of €5m+ but 20% on transfers of less than €1m The agent business is relatively open, with the largest agency responsible for only 6 of the 96 major transfers of summer 2017 Club Licensing Benchmarking Report: Financial Year 2016 45 CONTENTS OVERVIEW
  • 46. ENG 261 The agents’ commission analysis covers clubs that have competed in UEFA club competitions between 2014 and 2017 and includes clubs from 37 UEFA member associations. The sample is strongly representative as it covers at least 100 different player transfers for clubs from each of the six most active countries and at least 50 transfers for another 10 of the countries that are active in the transfer market. The transfer deals also include selling clubs from 84 different countries, including clubs in 47 UEFA member associations, 15 CAF (African), 10 AFC (Asian), 9 CONMEBOL (South American) and 3 CONCACAF (North and Central America and Caribbean) member associations. This representative sample more or less mirrors the activity highlighted in the transfers section of this report. 100+ 50 to 100 10 to 50 < 10 Number of transfers analysed by country of buying clubAgent fees reviewed across 2,000 transfers ESP 102 GER 139 POR 141 ITA 191 FRA 164 CZE 45 POL 85 9 This section expands considerably on the high-level agents’ commission analysis included in the FY2012 report by analysing agents’ commissions on almost 2,000 player transfers. The analysis shows how the ‘typical’ benchmark commission varies according to market and transfer type and highlights the variation in commissions, indicating that care should be taken when using these benchmarks for individual deals. The second part of the section focuses on a concentration analysis of agents and agencies across world football and at the top of the sport, linking that analysis to the major individual transfers presented in the transfers section of this report. AUT 79 GRE 76 SUI 76 NED 75 RUS 65 ISR 64 DEN 63 BEL 55 TUR 51 SCO 44 NOR 41 BUL 25 SWE 21 CRO 19 HUN 16 SRB 13 CYP 10 KAZ 10 8 8 4 3 3 2 2 1 1 1 * For the purposes of this report, all references to ‘agents’ covers the broader category of intermediaries, which can include lawyers, accountants, advisors and agents. Agents’ commissions in this report cover just the buying club’s agent costs and are analysed only for transfers (no loans or out-of-contract deals) where the buying club discloses both the value of the transfer and the agents’ commission. In some cases, where relevant, the agents’ commission includes other direct transfer costs reported by the club. The agents’ and transfer fees are based on the agreed transfer compensation not including contingent add-on payments and not including the agents’ costs. Agents’ commissions for 1,973 transfers are analysed by commission value and percentage of transfer fee, by year of transfer, by buying and selling club, by country of buying and selling clubs and by type of transfer (national or international). The commission percentage is further analysed based on percentage thresholds, (weighted) averages and ‘typical’ (median) rates to obtain a clearer picture. With the purpose of increasing transparency, FIFA made it mandatory from 2016 for the football governing bodies in each country to report the total agents’ fees paid per club each year. If fully and consistently monitored, this will contribute significantly to attempts to document agent activity. 46 CHAPTER 5: Agents CONTENTS OVERVIEW
  • 47. * The ‘weighted average’ agents’ commission is the total agents’ fee as a percentage of the total transfer fee and is the best measure to estimate total European agent costs. The weighted average cost of 12.6% has been adjusted to exclude the disproportionate effect of two outlier transfers, where disproportionately high agent costs were recorded due to the impact of third-party ownership, the average would increase to 13.4% if these two transfers were included. The rest of the analysis in the section focuses on presenting the mid commission rate which is the value halfway down the list from highest to lowest (median) and gives a better representative benchmark for agents’ commission rates, albeit this report clearly highlights that there is no such thing as a ‘typical’ commission due to the enormous variation in rates. The other common use of the term average, calculated from the average of average rates, is avoided in this report, as it is skewed heavily by some outlier deals with commission percentages of 100%+ that have a disproportionately large impact on the results. Lower-value transfers of less than €100,000 are subject to the highest agents’ commissions, with a mid rate of 40%. If the threshold is increased to between €1 and €1 million, then the mid rate agent commission is still 20%. The mid agents’ fee as a percentage of the transfer fee falls as the transfer deal increases, with the benchmark at 9.2% for transfers of more than €5m. Number transfers reviewed 1,973 268 439 221 226 338 481 Agents’ commissions significantly higher on lower-value transfers The mid rate is relatively consistent over the years, fluctuating between 13% and 14% in each of the periods analysed. An eye watering €1,270m of agent commissions were reported by clubs on the 2,000 transfers reviewed, which covered about 40% of overall European club transfer spending during the period 2013-2017. In total these commissions were equivalent to 12.6% of the transfer fees with the mid commission rate at 13.3%. Benchmark commission rate: Total, weighted average and mid agents’ commissions:* Mid agents’ commission rate by size of transfer deal 47 Club Licensing Benchmarking Report: Financial Year 2016 CONTENTS OVERVIEW
  • 48. * Commission rates by country are presented for the 16 leagues with a strong representative sample of at least 50 transfers. The total measures cover all transfers from these 16 leagues and all the other leagues where a smaller number of transfers were analysed. Agents’ commission rates vary country by country Mid commission rate by country* of recipient club: Agent costs as percentage of transfer fees French, Israeli and Spanish clubs reported the lowest agent commission rates of 8% to 9% between 2013 and 2016, with Danish, Polish and Swiss clubs reporting the highest mid commission rates of 19% to 21%. This is partly due to the mix of high and low-value transfers. Indeed, across clubs from every league, the mid commission rate was noticeably higher for lower-value transfers (transfer fee of less than €1m). 48 CHAPTER 5: Agents CONTENTS OVERVIEW
  • 49. 14.0% * With or without controlling for transfer deal value and/or transfer country mix, the mid and average commission comparisons remain true. Higher commissions on international transfers Mid commission rates Mid agents’ commissions on cross-border transfers (14.0%) are higher than the 12.4% mid rate for national transfers. Furthermore, among these cross-border transfers, the mid rate of 14.8% for a transfer originating outside UEFA territory is higher than the average of 12.4% within UEFA territory (i.e. between two clubs from different UEFA member associations). 12.4% National transfers International transfers 12.4% 14.8% UEFA cross-border transfers Transfers from outside UEFA Mid commission rates for transfers originating in North and Central America and the Caribbean (CONCACAF) or South America (CONMEBOL) do not differ significantly from the average rate for cross-border transfers within Europe. The mid commission of 26% paid on the 28 transfers originating in Asia (AFC) and the 32% average paid on the 50 transfers originating in Africa (CAF) are considerably higher. This is partly due to the low average value of the deals but the mid commissions paid remain noticeably higher than transfers originating from other regions if just larger (€1m+) deals are considered.* 49 Club Licensing Benchmarking Report: Financial Year 2016 CONTENTS OVERVIEW
  • 50. + * For visual reasons, the 28 outlier deals with commission rates of 50%+ (horizontal axis) are added on the right-hand side but not plotted by value. All transfers over €50m (vertical axis) have been excluded to protect anonymity. Each transfer deal has been plotted to visually illustrate the wide disparity between agents’ rates and the fact that this wide disparity applies within all countries (by buying club), underlining the unstructured and unregulated nature of the player agent market Agents’ commissions as percentage of transfer fee in 1,045 transfers between €1m and €50m* 50%+ Transfer value Agent commission as percentage of transfer fee Median 10.3% No such thing as a ‘typical’ agent commission rate Number of smaller transfers (less than €1m) across different commission percentage groups Extreme agent commissions equivalent to more than 100% of the transfer fee are rare in large transfer deals (32 occasions, 3% of total) but relatively common in smaller transfer deals (230 occasions, 25% of total). Significant transfer fees equivalent to more than 25% of the transfer fee were recorded on 140 occasions in large deals (13%) and on 370 occasions in smaller deals (40%). Number of large transfers (€1m+) across different commission percentage groups 50 CHAPTER 5: Agents CONTENTS OVERVIEW
  • 51. More than 70 different agents involved in summer’s large deals Concentration of player agents by transfer value among the major summer 2017 transfers Gestifute is the only agency that represented more than five of the high-value transfers and the only agency that worked with a single club on more than one occasion, transferring two players from both Porto FC and Benfica SL and transferring two players to Manchester City FC. The largest representation by value are relatives of the players. Four players were represented by their relatives during high-value transfers amounting to a total transfer sum of approximately €320m.* The four agents responsible for the largest number of transfers during the summer 2017 transfer window represent only 17% of the total number of transfers. In total, more than 70 different player representatives were involved in the 96 high-value transfers that occurred, clearly demonstrating the lack of concentration of agents among the top transfers. Most common player representation among the 96 high-value summer 2017 transfers This page analyses the role of player agents among 96 major transfers made in summer 2017 (€15m+ reported transfer fee) as referenced in the transfers section of this report. In particular the concept of agent concentration or dominance is investigated. * For six high-value transfers that occurred in the 2017/18 summer transfer window the collaborating agents are unknown. Therefore these players are listed as unknown and added to the category ‘Other’. 51 Club Licensing Benchmarking Report: Financial Year 2016 CONTENTS OVERVIEW
  • 52. ENG 27.3% * The market value of ‘playing talent’ is a theoretical, estimated market value because the actual market value depends on what someone is willing to pay to acquire the registration rights of each player. This is determined by multiple factors, including the player’s contractual situation and numerous characteristics of the player, and the buying and selling clubs. A non-exhaustive list of club characteristics includes the availability of alternative players (at the club and from outside), the club’s financial strength and league position, the number of clubs competing for players with the same characteristics, and the club’s managerial situation (e.g. new head coach or sporting director). Not surprisingly, England is the country in which the top 10 player agencies represent the largest percentage of the playing talent (27.3%). This percentage puts them ahead of France (21.1%) and Spain (17.6%). In total, the top ten agencies represent 23.1% of the estimated playing talent currently playing in Europe. >10% 5%- 10% 2.5%- 5% < 2.5% Market share of top 10 agents Top 10 agencies and their market share ESP 17.6% GER 14.7% NED 12.6% POR 11.6% ITA 10.1% FRA 21.1% AUT 10.2% GRE 8.4% SCO 9.6% TUR 5.7% CRO 2.4% DEN 3.8% RUS 4.9% HUN 2.4% CYP 2.4% POL 2.2% SRB 0.2% ISL 1.9% CZE 1.6% SUI 1.4% LUX 1.0% ISR 2.6% BEL 0.8% ROU 0.6% GEO 0.5% NIR 0.1% WAL 0.1% The previous page identified the top 10 agents in the summer 2017 transfer window. This page identifies and analyses the market share by player value of the top 10 player agents across European club football.* The ten agencies analysed are: Mondial Sports Managament (GER), Gestifute (POR), Stellar Football Ltd (ENG), Mino Raiola (NED), Sports Entertainment Group (NED), Unique Sports Management (ENG), SportsTotal (GER), Base Soccer Agency Ltd (ENG), ROGON Sportsmanagement GmbH (GER) and Bahia Internacional (ESP). 52 CHAPTER 5: Agents CONTENTS OVERVIEW
  • 53. In the Ukrainian top division, more than a quarter of the top-division players (27.7%) are represented by the agency ProStar, which represents the largest concentration in any domestic league. The Austrian Bundesliga is the only other league that surpasses the 10% mark, where 13.2% of top-division players list Stars & Friends as their agency. >10% 5% to 10% <5% Market share of main agency per country Low level of concentration in player representation Whereas the previous page of the report looked into the influence of the top 10 agencies in the different European countries, this page illustrates the degree of market concentration, by presenting the percentage of players represented by the largest agency within the top division. In line with previous chapters of the report, this analysis focuses on 15 selected leagues across Europe. UKR 27.7%AUT 13.2% NED 6.9% RUS 7.9% SUI 6.2% POR 5.0% ENG 5.0% BEL 4.6% TUR 4.1% SCO 3.7% GRE 3.6% ITA 3.4% FRA 3.3% ESP 5.5% GER 6.4% The French Ligue 1 is on the other side of the spectrum, where only 3.3% of the top-division players are represented by the agency with the most clients. The German Bundesliga features the highest diversity of player representation, with over 200 different agencies representing players. 53 Club Licensing Benchmarking Report: Financial Year 2016 CONTENTS OVERVIEW
  • 55. Club revenue highlights European club revenues have more than tripled this century Revenue growth varies considerably, with commercial driving the ‘top 12’ clubs’ growth, TV revenues driving the smaller clubs in large leagues, and UEFA revenue increases benefitting the clubs in smaller leagues League TV revenue distributions vary considerably in size and in the distribution between clubs Club Licensing Benchmarking Report: Financial Year 2016 55 CONTENTS OVERVIEW
  • 56. European club revenue growth a long term success story * Compound average growth rate. Source: data covering all of Europe’s top-division clubs submitted directly to UEFA since 2007. Prior to this no Europe-wide data was available but many of the major leagues collected data and this has been summarised in the Deloitte Annual Football Review dating back to 1996. The total European top-division aggregate revenue and wages for 1996 to 2006 has been estimated by extrapolating across the missing leagues using a ratio of 68:32 (non top-five data extrapolated from known top-five data). Club revenues have tripled this century Average 9.8% p.a. € Billions Club revenues are six and a half times what they were 20 years ago 56 CHAPTER 6: Club revenues CONTENTS OVERVIEW
  • 57. Two-cycle revenue growth from financial years ending 2010 to 2016 (aggregate league increase, €m per club increase and percentage growth)* Over the medium term (FY2010 to FY2016, equivalent to two TV cycles), clubs in 16 of the top 20 leagues (ranked by average revenue) have increased their revenues. In absolute terms, English clubs have extended their revenue advantage, growing on average by €110m per club, with German (€58m per club) and Spanish clubs (€44m per club) also growing strongly. Clubs in the next four leagues, all in countries with large populations, have also enjoyed healthy growth at an average of €15m to €20m per club, but have nonetheless fallen further behind the top three leagues. Medium-term league revenues growing at different speeds +€2,206m +€44m +€1,049m +€886m +€428m +€411m +€86m +€218m +€60m +€79m +€121m +€92m* €18m +€43m* -€60m -€21m -€69m -€152m* +€40m +€50m Growth has been more patchy lower down the rankings, where clubs from countries with smaller populations have not benefitted from similar levels of TV revenue increases. Belgian, Kazakh, Polish and Swiss clubs have enjoyed the most relative success in increasing their revenues but the average revenue in Greece, Norway, Scotland and Ukraine has decreased. Ranking by average FY2016 revenue Six-year growth Average six-year club growth Average six-year growth rate Six-year increase in European club revenues per revenue stream (FY2010-FY2016, all 54 leagues) UEFA 106% BROADCASTING 64% SPONSORSHIP& COMMERCIAL 59% GATE RECEIPTS 7% OTHER -12% TRANSFERS 105% TOTAL 64% Over the medium term, total European club revenue has grown by 64%. The revenue mix has changed, with low growth in gate receipts and a decrease in other revenues (primarily donations) reducing their impact. Gross transfer earnings (not included in revenue but analysed separately in financial reports) has more than doubled, as has UEFA prize money. * The 2010-2016 aggregate revenue increase in Denmark is a result of an increase in average club revenue combined with an increase in the number of clubs from 12 to 14. Likewise the Portuguese league has increased from 16 to 18 clubs. By contrast the aggregate revenue decrease in Ukraine is a result of decreased average revenue and a decrease in number of clubs from 16 to 12. Club Licensing Benchmarking Report: Financial Year 2016 57 CONTENTS OVERVIEW
  • 58. Revenue changes over one year (FY2015 to FY2016) in local currency terms* While combined European club revenue has seen consistent growth, country-specific developments are naturally more varied. For middle- income leagues, one club missing out on qualification for the UEFA Champions League group stage can set the trend and the Belarussian, Serbian and Slovenian club revenue fall was specifically due to this. Short-term European club revenue growth (FY2016) CHAPTER 6: Club revenues 58 Average club revenue trends, FY2015 to FY2016 * For clubs not operating in euros , the fluctuation in the value of their local currency can affect their financial results. When looking at the underlying trend within a particular league or country (as on this page) it is important to neutralise the currency impact and analyse the trends in local currency terms. When looking at aggregate European trends or making cross-border comparisons (as elsewhere in the report) it is more appropriate and meaningful to analyse trends in euro currency terms since the value of the domestic currency impacts competitiveness. The general upward club revenue trend across Europe reported last year has continued, with revenue growth reported in 41 leagues, of which 27 reported major revenue growth of more than 10%. The first two Kosovan clubs participated in UEFA club competitions in 2017/18, passing through the club licensing system and providing financial and other data. However two clubs is not a sufficient sample to assess the financial results of the league so Kosovo is not included in this year’s financial section. We hope and anticipate Kosovo will be included in full in next year’s financial sections. CONTENTS OVERVIEW
  • 59. Average and aggregate revenues by country England’s 20 top-tier clubs together reported more revenue than all 597 clubs combined from the 48 grey, blue and purple countries. By way of historical sporting context, those countries have provided 20 different clubs that have won UEFA silverware. Average club revenue per top division (€m)* Average revenue €50m+ €5m to €50m €1m to €5m €0.1m to €1m The ability of clubs to generate revenues varies enormously across Europe’s top-tier leagues, from England, where clubs generate €244.4m on average and €4.9bn in aggregate, to San Marino, where the 15 clubs generate an average of €150,000 and an aggregate of €2.3m. Aggregate club revenues per top division (€m)* Aggregate revenue €500m+ €100m to €500m €10m to €100m €1m to €10m * All financial figures presented and analysed in this report are collected either directly from clubs or indirectly through national associations or leagues, using UEFA’s extensive online reporting templates. This data is itself sourced from official financial statements verified by independent external auditors. In some cases certain items are reallocated in order to achieve consistency in financial reporting across Europe, an important requirement of benchmarking. In a limited number of cases data may not be available, typically where a club has been relegated or fallen outside the scope of the club licensing system. In these cases the missing data is simulated by UEFA using data for these clubs from the previous year or, if this is not representative, using an extrapolation of data from clubs with a similar profile from the same league. Simulated data makes up less than 1% of the total data by value. Across the 30 highest-revenue leagues, financial data has been extrapolated in FY2016 for eight Portuguese, one Greek and one Slovakian club. In addition, the Spanish figures include data from FY2015 for one club. Club Licensing Benchmarking Report: Financial Year 2016 59 CONTENTS OVERVIEW
  • 60. Increasing number of clubs breaking €100m+ revenue barrier FY2016 revenues €500m+ €400m-€500m €250m-€400m €200m-€250m €100m-€200m The number of European clubs with revenues in excess of €100m has edged up from 46 to 48, although there is some churn with 5 clubs dropping below the €100m threshold and 6 clubs rising above it. The more noticeable trend is the number of clubs with revenues above €50m, which has increased significantly from 86 to 94 clubs. At the turn of the century there were only an estimated 25 clubs with this earning, and consequently, spending power.* Clubs with annual revenues of €100m+ 60 9 6 1 10 2 4 5 7 8 15 12 21 18 13 23 19 24 16 22 CHAPTER 6: Club revenues Clubs with annual revenues of €50m+ This top 30 represents not just Europe’s but the world’s largest football clubs by revenue. Football might be a global game, but the map above highlights the geographical concentration of that wealth. * The full picture of European club finances has only been revealed since UEFA started receiving the financial data for all 700 top-division clubs (2007). Deloitte has, however, published its ‘rich list’/‘money league’ since the start of the century and although this has not covered every club in recent years (in particular many of the large eastern European clubs only release data to UEFA) it does cover the vast majority of clubs. Indeed, going back to 1999/2000 it is quite probable that the 25 clubs reporting over €50m revenue were all on the list. 2000 10 …….. 2000 …….. 25 3 11 14 17 20 25 26 27 28 29 30 CONTENTS OVERVIEW
  • 61. 419 503 61 Club Licensing Benchmarking Report: Financial Year 2016 The top 30 clubs generated over €9.1bn in revenues in FY2016. This amount represents just under half of all European top-division club revenues. Every one of the top 30 clubs reported an increase in revenue in FY2016, the 12% average growth rate matching that of the previous year. Last year’s report highlighted the two-speed growth in the last five years of club commercial revenues and the widening financial gap between the ‘global super powers’ and other large clubs. Seven clubs (green markers) reported revenue growth of €50m or more, with Manchester United and FC Bayern each enjoying growth of more than €100m. €m €m FY2016 revenue FY2015 revenue FY2017 revenue (where available)€m Growth 2015 to 2016 Rank Club Country FY16 Year-on-year growth Growth rate 1 Manchester United FC ENG €689m €169m 32% 2 FC Barcelona ESP €620m €59m 11% 3 Real Madrid CF ESP €620m €42m 7% 4 FC Bayern München GER €592m €118m 25% 5 Paris Saint-Germain FC FRA €542m €58m 12% 6 Manchester City FC ENG €533m €73m 16% 7 Arsenal FC ENG €477m €28m 6% 8 Chelsea FC ENG €440m €27m 7% 9 Liverpool FC ENG €407m €18m 5% 10 Juventus ITA €341m €17m 5% 11 Borussia Dortmund GER €285m €4m 1% 12 Tottenham Hotspur FC ENG €281m €22m 9% 13 VfL Wolfsburg GER €236m €45m 23% 14 Club Atlético de Madrid ESP €229m €64m 39% 15 AC Milan ITA €222m €5m 2% 16 AS Roma ITA €219m €38m 21% 17 FC Schalke 04 GER €219m €0m 0% 18 FC Internazionale Milano ITA €202m €30m 17% 19 West Ham United FC ENG €194m €34m 21% 20 Bayer 04 Leverkusen GER €190m €14m 8% 21 FC Zenit St. Petersburg RUS €180m -€16m -8% 22 Leicester City FC ENG €173m €37m 27% 23 Newcastle United FC ENG €168m -€2m -1% 24 Southampton FC ENG €166m €17m 11% 25 Everton FC ENG €164m €0m 0% 26 Olympique Lyonnais FRA €160m €64m 66% 27 Galatasaray SK TUR €159m €11m 7% 28 VfL Borussia Mönchengladbach GER €154m €7m 4% 29 Fenerbahçe SK TUR €149m €41m 37% 30 Aston Villa FC ENG €147m -€4m -3% 1-30 Average €305m €34m 1-30 Aggregate €9,159m €1,019m 13% 496 676 649 675 411 198 The top 30 clubs by revenue CONTENTS OVERVIEW 558 328 212 269 428 271 122 98 13 months
  • 62. Club revenues in euros increased by 9.5% between FY2015 and FY2016, following 6% increases in the two previous years. Underlying domestic broadcast revenue increased by a steady 8% in FY2016with the new international TV rights cycle driving large overall increases of €101m/+16% and €167m/+28% in Germany and Spain respectively. Italian clubs reported a 6% increase from the start of their new TV cycle and English clubs a 4% increase from an incremental mid-cycle increase. Revenue from UEFA increased significantly (+29% in EURO terms) in FY2016, with the full effect of the current cycle being reported by all clubs. This follows the large 20% increase in FY2015 from the first partial recognition of the upgraded TV deal in the accounts of clubs with a December year end. In total, clubs saw a €240m increase on the previous financial year. UEFA payments increased to 10% of all clubs’ revenue and 16% for those participating in UEFA competitions. 62 Domestic broadcasting Revenue from UEFA Sponsorship Commercial Gate receipts Other revenue Domestic currency trend Euro currency trend Share of total revenue Value of revenue stream CHAPTER 6: Club revenues European club revenues by type Two growth rates are used in this report. The ‘euro currency trend’ allows for the best comparison of relative competitiveness between leagues and clubs, while the domestic currency trend provides the underlying trend for each country or club. CONTENTS OVERVIEW
  • 63. Underlying ‘other’ revenues decreased by 4% in FY2015, with lower donations in France and a drop in one-off revenues in Spain. Other revenues also include subsidies, grants and income from non-football operations. Underlying revenue from gate receipts increased by 7% in FY2016, the fastest rate for a number of years. Various stadium developments (Liverpool, Lyon, Manchester City and West Ham) combined with large capacity clubs hosting more home matches (Borussia Dortmund, FC Barcelona, FC Bayern and Manchester United FC) explain this trend. It should be noted that revenue does not include transfer sales, which are reflected separately in club accounts as profits on sale of assets. However, to provide some context, €4.2bn in gross sales income from transfers was reported, equivalent to 23% of total revenues. Transfer sales income has increased 48% since FY2014, and is set to continue increasing as reported earlier in the transfers section of the report, reflecting the inflationary values in the transfer market. Underlying commercial revenues increased by a notable 12% in FY2016, following a 9% increase in FY2015. Commercial revenue growth is again concentrated among the largest 12 ‘global’ clubs, who were responsible for 50% of the growth. Underlying club sponsorship revenues increased strongly by 10% in FY2016, following a 5% increase in FY2015. Once again, sponsorship growth in FY2016 was concentrated at the top, with more than 60% of increased revenues accruing to the top 12 largest revenue clubs. European club revenues of €18.5bn are split roughly in three, with 34% domestic broadcasting, 33% sponsor and commercial and 33% from gate, UEFA and other revenues CONTENTS OVERVIEW 63 Club Licensing Benchmarking Report: Financial Year 2016
  • 64. TV a larger part of revenue mix near top of European game Outside the top 20 TV markets Other top 20 markets The ‘big six’ TV markets The first year of a new international TV rights cycle was reflected in strong TV revenue growth reported by Spanish clubs (+28%) and German clubs (+16%). The 6% growth reported by Italian clubs reflects the relatively modest increases from their new TV cycle. Likewise, the French 1% revenue growth reflects the relatively low increase in Ligue 1 international rights, which are expected to grow more significantly from 2018/19. English growth of 4% reflects the final year of their TV cycle and the incremental year-on-year increase across the cycle. Next year English clubs are expected to report a massive 33% value increase in euro terms despite a 12-13% drop in the value of the British pound. As a percentage of overall revenue, Italian clubs remain the most reliant on broadcast revenue, which generates over half their total revenues. The new TV deal is anticipated to also take the TV share of total revenue for English clubs over the 50% mark. Increased TV rights from the start of a new cycle led to strong double-digit growth in Denmark, Poland, Portugal and Sweden. The Danish growth of 17% is partly due to an increase in the number of clubs from 12 to 14. The Portuguese league is the last major league where clubs sell rights individually and their 20% growth reflects notable revenue uplifts from two of the big three clubs that dominate the Portuguese club football landscape. Higher reported Scottish club TV revenues were without two of the largest clubs featuring in the top division (Rangers and Hearts) and reflect a restructured TV deal. While broadcast revenues feature as the largest revenue stream for many of the larger markets, it contributes less than 10% of revenue for all European leagues outside the top 20, among which only Czech clubs (8% of total revenue), Israeli and Serbian clubs (7%), Bulgarian and Icelandic clubs (5%) derive more than 5% of their total revenue from TV. The top 20 leagues by average club broadcast revenue €2,271m €12m €1,013m €937m €751m €502m €286m €122m €67m €71m €35m €31m €29m €29m €19m €18m €10m €25m €14m €23m +4% -1% +6% +28% +16% +1% +7% +20% +1% +1% +17% -8% +16% -18% +12% +10% 0% +7% -8% +11% Percentage of total revenue Ranking by club average Underlying growth* Aggregate Club average (€m) 64 CHAPTER 6: Club revenues CONTENTS OVERVIEW
  • 65. Wide variation in distribution of TV money across leagues The distribution models applied by leagues differ, as reflected in how the money is shared between clubs. All major leagues have part of their distributions connected to league performance but then the basis for distribution varies considerably. Portugal is now the only major league where clubs sell their rights individually and this is reflected in the huge gap between the TV rights of the top three sides and the rest. The high club to median club ratio is above 14 there, compared with an average high to median ratio of 2.3. The Spanish (4.1x) and Italian (3.3x) TV revenue is much less evenly spread among clubs than the French (2.4x) and German (2.3x), which reflects the relatively recent move to collective selling in those countries, where the benefits of greater overall revenues from collective selling tend to be distributed across clubs but with the largest clubs more or less earning the same as before. Distribution of TV revenue: Ratio of high to median clubs Ratio FY16 Ratio FY10 1.1 x 1.6 x 1.8 x 3.3 x 1.9 x1.5 x 1.7 x 2.1 x 4.3 x 8.4 x1.7 x 2.3 x 2.6 x 2.7 x 2.9 x1.9 x 5.7 x 2.4 x 2.0 x 5.7x* While TV money has been distributed more evenly in some leagues, notably Italy and Spain, where individual deals have been replaced by collective selling, these are outnumbered by the number of leagues where the high to median ratio has increased between FY2010 and FY2016. * The figures for Portugal FY2010 are based on the ratio of top to 6th placed club due to lack of historic data. Club Licensing Benchmarking Report: Financial Year 2016 65 CONTENTS OVERVIEW
  • 66. Top 20 clubs by broadcast revenues English clubs occupy 16 of the top 20 places in the broadcast revenues table. However, perhaps more surprisingly, this is the first time on record that an English club tops the list outright, with either Real Madrid CF, FC Barcelona or Juventus previously always receiving more domestic TV revenue. These three clubs remain within the top 20, with FC Internazionale Milano the final non-English club in the top 20. English Premier League distributions are part equal share and part determined by performance and how many times a team is selected for TV coverage, which leads to some year-on-year changes. Leicester FC’s dramatic title win helped them increase their TV revenue by 35%. The chart highlights how dominant TV money is within the revenue mix of many Premier League clubs, representing up to 85% of total revenue in AFC Bournemouth’s case. The chart and table also highlight how TV money is significant but not dominant for the wealthiest ‘global’ clubs, contributing less than 30% of total revenues in some cases. % €m FY2016 broadcast revenue from domestic football FY2016 broadcast revenue as a percentage of total revenue Rank Club Country FY16 Year-on-year growth % % oftotal revenue Multiple of the league average 1 Manchester United FC ENG €146m 5% 21% 1.3 x 2 Real Madrid CF ESP €145m 3% 23% 3.2 x 3 FC Barcelona ESP €145m 2% 23% 3.2 x 4 Arsenal FC ENG €138m 8% 29% 1.2 x 5 Manchester City FC ENG €135m 1% 25% 1.2 x 6 Leicester City FC ENG €128m 35% 74% 1.1 x 7 Tottenham Hotspur FC ENG €127m 7% 45% 1.1 x 8 Liverpool FC ENG €127m -1% 31% 1.1 x 9 Chelsea FC ENG €123m -11% 28% 1.1 x 10 Southampton FC ENG €123m 11% 74% 1.1 x 11 Juventus ITA €119m 12% 35% 2.4 x 12 West Ham United FC ENG €117m 14% 60% 1.0 x 13 Everton FC ENG €111m 4% 68% 1.0 x 14 Stoke City FC ENG €107m 6% 76% 0.9 x 15 West Bromwich Albion FC ENG €106m 5% 80% 0.9 x 16 Swansea City FC ENG €104m -7% 82% 0.9 x 17 Crystal Palace FC ENG €104m 0% 77% 0.9 x 18 Watford FC ENG €104m n/a 84% 0.9 x 19 FC Internazionale Milano ITA €99m 10% 49% 2.0 x 20 AFC Bournemouth ENG €99m n/a 85% 0.9 x 1-20 Average €120m 6% 54% 1-20 Aggregate €2,408m 5% 40% 66 CHAPTER 6: Club revenues CONTENTS OVERVIEW
  • 67. Domestic broadcast distributions recalibrated The analysis below is a purely theoretical exercise that underlines how distribution mechanisms impact clubs in different leagues. Rank by domestic TV ‘Big five’ average TV share ENG ESP Actual TV revenues (FY2016, high-median-low) Manchester United €146m Aston Villa €88m Everton €111m Real Madrid €145m Espanyol €37m Las Palmas €17m PSG €54m Montpellier €24m Ajaccio €10m Bayern München €83m Eintracht Frankfurt €39m Darmstadt €24m Juventus €119m Atalanta €36m Frosinone €20m TV revenues recalculated on ENG % shares TV revenues recalculated on ESP % shares €200m €100m €50m €25m €0m ENG ESP FRA GER ITA €59m €111m €146m €88m €52m €32m €45m €65m €145m €92m €362m €41m €124m €80m €37m €161m 1st 2nd 3rd 4th 5th 6th 7th 8th 9th 10th 11th 12th 13th 14th 15th 16th 17th 18th 19th 20th 11.0% 9.6% 7.5% 6.8% 6.1% 5.6% 5.3% 5.0% 4.5% 4.3% 4.0% 3.9% 3.7% 3.6% 3.4% 3.3% 3.2% 3.0% 2.8% 2.5% 6.4% 6.1% 5.9% 5.6% 5.6% 5.6% 5.4% 5.4% 5.1% 4.9% 4.7% 4.6% 4.6% 4.6% 4.6% 4.4% 4.3% 4.2% 4.1% 3.9% 15.9% 15.9% 7.5% 5.7% 5.4% 5.3% 4.6% 4.6% 4.2% 4.0% 3.8% 3.6% 3.2% 3.0% 2.5% 2.5% 2.4% 2.3% 2.0% 1.8% Club Licensing Benchmarking Report: Financial Year 2016 67 CONTENTS OVERVIEW
  • 68. Large increases in revenue from UEFA club competitions The top 20 leagues by average club revenue received from UEFA The top 20 markets Outside the top 20 markets The amount of UEFA prize money a club receives is determined in part by its sporting performance and in part by its national broadcaster’s contribution to the market pool. UEFA competition rights, prize money and solidarity payments to non-competing teams operate on a three-year cycle, with FY2016 marking the start of the 2015/16-2017/18 cycle for most of the large western European clubs with summer financial year ends and the second year of the cycle for clubs with December financial year ends. UEFA distributions totalled €1,931m in clubs’ FY2016 figures, an increase of €431m on the previous year, with only Italian, Portuguese and Russian clubs reporting less UEFA revenue (performance-based decreases in prize money). €312m €17m €323m €207m €196m €159m €49m €70m €67m €59m €34m €44m €50m €44m €24m €17m €14m €54m €14m €11m +72% +619% +54% +24% -6% +20% +6% +136% -13% -21% +85% +938% +35% +56% +21% +65% +41% +59% +60% +107% Ranking by club average Underlying growth Aggregate Looking forward * The club averages and ‘UEFA % - All clubs’ figures cover all the teams in the league rather than just the four to seven teams participating in UEFA competitions during the financial period analysed. This is consistent with the other revenue stream analyses. The share of total revenue received from UEFA by just the clubs participating in a UEFA club competition during the financial period analysed is the larger percentage figure presented on the far left of the data table. This can fluctuate depending on which type of club qualifies each season. The aggregate revenue from UEFA includes all direct revenues, including prize money, solidarity payments for clubs competing in qualifying rounds and in most cases also solidarity payments for non-participating clubs distributed through their respective leagues. Indirect revenues, i.e. sponsor and commercial partner bonuses and gate receipts, are reported elsewhere. In the top 20 markets, the significance of the UEFA contribution ranged from 6% of total club revenue in England to more than 50% in Croatia and Ukraine. Outside the top 20 leagues, UEFA competition revenues tend to represent a greater proportion of overall revenues for clubs in less wealthy leagues. In relative terms, the qualifying round ‘solidarity payments’, which in the new cycle range from €200,000 for the first qualifying round of the UEFA Europa League to €400,000 for the third qualifying round in the UEFA Champions League, can form a greater proportion of smaller clubs’ total revenues than the many tens of millions in Champions League group stage bonuses received by the larger clubs. This is evidenced in the FY2016 figures, with 50% of total club revenues in Albania, Andorra, Armenia, Gibraltar and Latvia from UEFA despite no club reaching the Champions League or Europa League group stages. UEFA prize money is set to rise again considerably from the 2018/19 season on the back of a new cycle of TV rights. Both prize money for participants and solidarity payments for clubs in qualifying rounds and clubs not participating in either UEFA club competition will increase significantly. 10% 36% 16% 12% 20% 15% 57% 13% 21% 13% 21% 36% 46% 20% 58% 51% 12% 19% 12% 37% UEFA % - Participating clubs only UEFA % - All clubs 68 CHAPTER 6: Club revenues CONTENTS OVERVIEW