Students' knowledge of stereotypes in Europe
•Download as DOCX, PDF•
1 like•145 views

Description of the Sample

Recommended
More Related Content
Viewers also liked
Viewers also liked (17)
Similar to Students' knowledge of stereotypes in Europe
Similar to Students' knowledge of stereotypes in Europe (20)
More from Luís Gonçalves
More from Luís Gonçalves (20)
Recently uploaded
Recently uploaded (20)
Students' knowledge of stereotypes in Europe
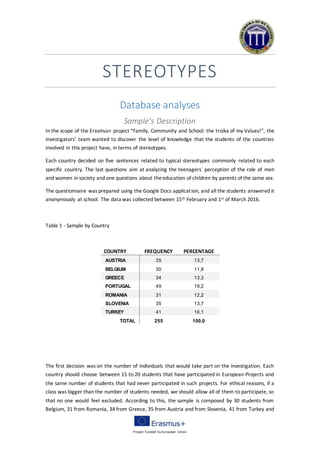
- 1. Project Funded by European Union STEREOTYPES Database analyses Sample’s Description In the scope of the Erasmus+ project “Family, Community and School: the troika of my Values!”, the investigators’ team wanted to discover the level of knowledge that the students of the countries involved in this project have, in terms of stereotypes. Each country decided on five sentences related to typical stereotypes commonly related to each specific country. The last questions aim at analyzing the teenagers` perception of the role of men and women in society and one questions about theeducation of children by parents of the same sex. The questionnaire was prepared using the Google Docs application, and all the students answered it anonymously at school. The data was collected between 15th February and 1st of March 2016. Table 1 - Sample by Country COUNTRY FREQUENCY PERCENTAGE AUSTRIA 35 13,7 BELGIUM 30 11,8 GREECE 34 13,3 PORTUGAL 49 19,2 ROMANIA 31 12,2 SLOVENIA 35 13,7 TURKEY 41 16,1 TOTAL 255 100,0 The first decision was on the number of individuals that would take part on the investigation. Each country should choose between 15 to 20 students that have participated in European Projects and the same number of students that had never participated in such projects. For ethical reasons, if a class was bigger than the number of students needed, we should allow all of them to participate, so that no one would feel excluded. According to this, the sample is composed by 30 students from Belgium, 31 from Romania, 34 from Greece, 35 from Austria and from Slovenia, 41 from Turkey and
- 2. Project Funded by European Union 49 from Portugal. The total of the sample is 255 individuals, in all questions. There are no missing values, once that all the questions were mandatory. Table 2 - Sample by Age AGE FREQUENCY PERCENTAGE 13 1 0,4 14 9 3,5 15 38 14,9 16 78 30,6 17 96 37,6 18 26 10,2 19 7 2,7 TOTAL 255 100,0 During the two years of the project, the schools have been working, mainly, with students from 14 to 18 years old. In this rangeof ages, we have collected 9 answers from students with 14 years old (3,5%), 38 answers from students with 15 years old (14,9%), 78 answers of students with 16 years old (30,6%), 96 answers of students with 17 years old (37,6%, the biggest group of the sample), and 26 answers from students with 18 years old (10,2%). However, sometimes, theclasses might haveyounger or older Students. For that reason, it is possible to find one answer from a student with 13 years old (0,4%) and 7 answers from students with 19 years old (2,7%). Table 3 - Sample by Sex/Gender AGE FREQUENCY PERCENTAGE MALE 120 47,1 FEMALE 135 52,9 TOTAL 255 100,0 It was also important to have a balanced number of boys and girls in the sample. However, it is not possible to have an equal number of individuals from both sex. We have 120 male students in the sample (47,1%), and 135 female students (52,9%). Table 4 - Sample by participation in European Projects
- 3. Project Funded by European Union PARTICIPATION IN EUROPEAN PROJECTS FREQUENCY PERCENTAGE YES 118 46,3 NO 137 53,7 TOTAL 255 100,0 As wepreviously referred, each country should apply the questionnaires to student that had already participated in European Projects and to a similar amount of students that had never participated. By participating in European Projects, we have considered any student that took part in a Comenius Project, in an Erasmus+ project (in an exchange or just by doing local activities related to theproject) or in an eTwinning Project. 118 students have participated in such projects (46,3%), and 137 (53,7%), have never participated in this kind of projects. Description of the Instrument