1. The current issue and full text archive of this journal is available at
www.emeraldinsight.com/1463-5771.htm
BIJ
18,3 Applied qualimetry: its origins,
errors and misconceptions
Garry G. Azgaldov
428 Central Economics and Mathematics Institute, Russian Academy of Sciences,
Moscow, Russia, and
Alexander V. Kostin
Centre for Intellectual Property Introduction and Commercialisation,
Russian State Institute of Intellectual Property, Moscow, Russia
Abstract
Purpose – The purpose of this paper is to provide the reader, who may have little or no knowledge of
qualimetry, with first, an outline of the history and development of this relatively new scientific
discipline, which deals with the methodology of and problems in the integral quantitative assessment of
the quality of objects of any nature: things and processes, products of labour and products of nature,
whether material or ideal, animate or inanimate, simple or complex, natural or man-made, etc.; and
second, the most common errors that occur in the design and application of quality assessment
techniques, which result in the depreciation of findings obtained by these techniques, and methods for
eliminating such errors.
Design/methodology/approach – The methodology used to obtain the results described in the
paper is based on a deductive-axiomatic approach and, occasionally, on expert judgements.
Findings – The findings presented in the paper can raise the research community’s awareness of the
great opportunities that the qualimetry toolbox offers them in addressing their problems; at the same
time, they can help them to avoid many pitfalls.
Practical implications – The information found in the paper broadens the range of business
problems and problem-solving procedures that can make use of qualimetric techniques and approaches.
Originality/value – The vast majority of the readers of this journal will find information contained
in this paper both novel and potentially useful.
Keywords Quality, Quality assessment
Paper type Research paper
Introduction
Measure what is measurable, and make measurable what is not so (Galileo Galilei).
Qualimetry – what is it?
The rationale of qualimetry
Scientific and technological progress is marked by steady growth in the use of
quantitative techniques to rationalise decision making in industrial management, i.e. in
the manufacturing businesses and allied branches of science and technology. This has
Benchmarking: An International been a trend throughout written history. As everyone is well aware, if a technology (or a
Journal related science) uses numerical techniques, its name often contains the ending-metry
Vol. 18 No. 3, 2011
pp. 428-444 or -metrics (from the Greek m1tr1v, “to measure”). While the ancient world knew but
q Emerald Group Publishing Limited one term with this ending, geometry, the Middle Ages knew of four or five. One of these
1463-5771
DOI 10.1108/14635771111137796 authors has collected more than 90 such terms, from absorptiometry to uroflowmetry;
2. and the list is by no means complete. It must be said, however, that this ending is not a Applied
necessary or exclusive characteristic of the application of quantitative techniques; more qualimetry
about it later.
The tendency to expand the domain of quantification, i.e. the application of numerical
techniques, has some features of its own. To bring them out, we need to bear in mind
several factors. It is common knowledge that anything people produce within a definite
time period (and what they deal with in commodity exchange or consumption) is 429
expressed by a set of four elements:
(1) product;
(2) service;
(3) energy (such as thermal, electric, compressed air, etc.); and
(4) information (which, like energy, is sometimes reckoned among products).
Each of these elements is fully described by three fundamental parameters:
(1) quantity (in conventional units of measure);
(2) cost of production, distribution and consumption/utilisation/exploitation/application
of a unit of quantity; and
(3) quality of a unit of quantity, which hereinafter refers to a totality of such and
only such qualities of an object as become apparent in the course of its
consumption/utilization/exploitation/application.
As mentioned before, this paper will deal mainly manufacturing businesses, which
produce commodities. Therefore, terms in italic type will refer mainly to manufactured
products rather than services, information or energy.
The first of these fundamental parameters, quantity, is basic to calculations in the
engineering disciplines, e.g. design calculation, heat engineering, lighting engineering,
materials engineering. The second, cost, is studied and recognised by the body of
economic disciplines, e.g. production economics, budgeting, production management.
As to the third fundamental characteristic, quality, until quite recently it was seldom if
ever taken into account by either engineering or economic or management disciplines.
This was due to the lack of a theory and a toolbox for valid quantification (estimation)
of quality, e.g. product quality. With technological progress this lack in fact generated a
social need, which could not but lead to the appearance of Qualimetry.
The term qualimetry (from the Latin quale, “of what kind”), which designates a
scientific discipline studying the methodology and problems of quantitative assessment
of the quality of any kind of object (primarily, products), was first used in 1968. That this
initiative was timely and justifiable was borne out by a series of international scholarly
conferences fully or partly devoted to issues of qualimetry, e.g. in Moscow, Oslo, Varna,
Yerevan, Madrid or Tallinn.
The term qualimetry is being gradually admitted into the scientific and engineering
vocabularies of many countries. According to Google, tens of thousands of references to
publications in 32 languages contain this term.
In the English-language literature, qualimetry is used along with other synonymous
terms such as technometry (Technometrics, n.d.), systems analysis (Ifenthaler et al.,
2010), hierarchy analysis (Samochvalov, 2004), decision theory (White, 1969),
benchmarking and others.
3. BIJ When it first appeared, the term and the respective concept were perceived as
18,3 unexpected, almost fortuitous; some still regard them as such.
However, it would be wrong to talk of the fortuity of qualimetry. Quite to the contrary,
its appearance should be seen as another natural indication, besides the one mentioned
at the beginning, of the general broadening of the scope of quantification. The universal
and imperative nature of this tendency to widen the application of quantification as a
430 major tool of cognition was expressed by mathematician Yudin (1974): “Quality is yet
unknown quantity”.
Many great minds were aware of the great influence that mathematics, the general
framework of quantification techniques, exerts on the development of science and its
close ally, technology.
It is common knowledge (Azgaldov, 1995b) that K. Marx only recognised as science
what had a mathematical foundation. A century before him, I. Kant wrote in his
Metaphysical Foundations of Natural Science, “I maintain, however, that in every
special doctrine of nature only so much science proper can be found as there is
mathematics in it” (Kant, 1966). Three centuries before Kant, a similar statement was
made by Leonardo da Vinci: “No human investigation can be called real science if it
cannot be demonstrated mathematically” (Gukovsky, 1947).
Five centuries before Leonardo, in the ninth century, a similar line of thought was
pursued by the famous Arab Scientist Abu Yusuf Ya’qub ibn Ishaq Al-Kindi, who saw in
mathematics the basis and prerequisite of all science, including philosophy and natural
history (Al-Kindi, 1961). Another thirteen centuries earlier, the Greek philosopher
Xenocrates of Chalcedon expressed the ancients’ idea of mathematics in the following
maxim: “Mathematics is the handle of philosophy” (Frolov, 1958). Dozens of years before
Xenocrates, or 2,300 years before our time, his teacher Plato said, “Exclude from any
science mathematics, measure and weight, and it is left with very little” (Asmus, 1969).
Now, what made qualimetry appear in the 1960s?
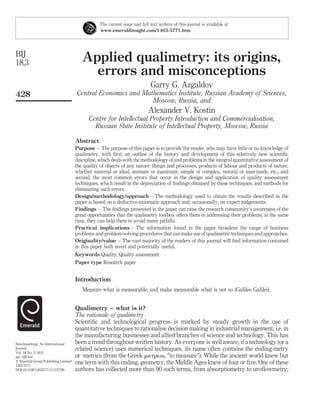
Modern management science formulated five necessary and sufficient conditions for
the success of any work. They can be represented by the present authors’ “condition
tree” (Figure 1).
Four of these five conditions – to KNOW, to BE ABLE, to MANGAGE, and to
STIMULATE – are relatively easy to meet methodologically, regulatory documents for
respective calculations being in place. For example, every branch of material production
has its own rate-setter’s handbook or a similar document, which is used to calculate the
workforce, the time and the tools needed to perform a piece of work (the MANAGE
condition). Other documents, like wage rate books, specify the requirements to be met in
selecting a workforce to do a piece of work successfully (the BE ABLE condition). It is
relatively easy to meet the KNOW condition: you only need to set the task to the job
executors. Finally, to meet the STIMULATE condition all businesspersons or managers
They KNOW how to work successfully
People CAN They ARE ABLE to work successfully
SUCCESS work successfully They MANAGE to work successfully
Figure 1. of a piece of work
Necessary and sufficient The success of their work is EVALUATED
conditions for the success People WANT
of a piece of work to work successfully The success of their work is STIMULATED
4. have a broad range of stimulatory actions they can use with their subordinates: material Applied
and moral; positive (“carrot”) and negative (“stick”); individual-directed or qualimetry
team-directed; one-off or time-phased, etc.
We have quite a different situation with the EVALUATE condition. What is to be
evaluated is a piece of work; and any work (and its output) is characterised by three
parameters: quantity, cost and quality. Arguably, in most occupations in the material
production field the numerical evaluation of the parameters of quantity and cost does not 431
present essential difficulties.
The difficulty of quantifying quality
This is not the case with quality. Here, two aspects must be taken into account: the quality of
individual labor (simple or complex) and the quality of teamwork. As for individual labor,
evaluating it is anything but a trivial task, especially if it must be done in quantitative form
and with due regard for the many characteristics that make up its quality.
Evaluating even the simple labour of an industrial worker poses difficulties: it is
by far not always that it can be evaluated using a simple reject rate indicator. These
difficulties multiply when it is a matter of quantitative assessment of the quality of
complex, e.g. intellectual, labor.
Here, is an example to illustrate the importance and complexity of this task. Back in
the early 1970s, a group of UNESCO experts surveyed 1,200 research teams in Austria,
Belgium, Finland, Hungary and Sweden. Their conclusion: the most vexed problem in
raising operating efficiency in science is the lack of a reliable methodology for assessing
the quality of work of individual researchers and research teams (Andrews, 1979)
(similar examples can be cited with respect of managers, health professionals, engineers,
teachers, administrators and some others (Zimmerer and Stroh, 1974)).
Let us, now look at the issue of assessment of the quality of teamwork. It stands to
reason that its most important characteristic is the quality of output. As already
mentioned, the outcome of any teamwork is either a product or a service or information
or energy. Of these four forms that a production outcome may take, the product is by far
the most complex in terms of the quality assessment method and the most important in
terms of the breadth of its existence domain, given that developed economies
manufacture more than 20 million kinds of product.
It all goes to show that:
(1) In the present-day context, successful, i.e. effective, productive work is a key
condition of the economic health of either an individual company or a whole country.
(2) In addressing the problem of increasing the success/efficiency of any labour the
key element is quantitative assessment – both of the process and the outcome
of labour, primarily its product.
(3) Of the three characteristics of labour (and its outcome) – quantity, quality and
cost – quality is the most complex in terms of quantitative assessment.
(4) Until quite recently, the approach to the problem of quantitative assessment of
quality (primarily of products) lacked a sound methodological support. At best,
isolated quantitative assessment techniques were devised, but they had not any
reliable and unified rationale to support them. As a result, quantifications
of the quality of one and the same object calculated by different methods could
be worlds apart.
5. BIJ A natural corollary to propositions (1)-(4): in the early post-Second World War years,
18,3 every industrialised country felt the need for scientific rationalisation of the methods of
quantitative assessment of the quality of production work and its outcomes.
F. Engels in his day noted that when an engineering need appears in society, it moves
science forward faster than a dozen universities. The appearance of qualimetry can be
seen as a natural response to the pressing need for generalisation and perfection of the
432 techniques of quantitative assessment of quality.
The advantage of the accepted terminology
Our analysis shows that qualimetry is the best possible name for this discipline. Indeed,
the Greek root metreo has become accepted in the international lexicon of science. As for
the Latin root qualis, its derivative words in the majority of the languages in which the
bulk of scientific and technical literature is published means “quality” (cualidad in
` ¨
Spanish, qualita in Italian, kwaliteit in Dutch, Qualitat in German). Therefore, the term
qualimetry is quite handy: it is concise and it accurately renders the content of the
“quality measurement” concept; its main components are intelligible to people speaking
different languages; its structure makes it easy to form any derivative words like a
qualimetrologist (a qualimetry scientist), a qualimetric approach (a quality
measurement approach), etc.
Furthermore, this term is part of a logically bracketed system of concept and terms,
e.g. the science of quality (qualilogy) and the related science of quality measurement
(qualimetry); one can draw an analogy with some other sciences: economics –
econometrics, biology – biometry, psychology – psychometrics.
Minimum information about the essentials of qualimetry. This paper does not
describe specific methods of qualimetry for it would require a much larger exposition. We
only note that qualimetry measures the quality of an object on the 0-100 (or 0-100 per cent)
scale, 100 per cent taken as the world’s best characteristics of a similar product at the time
of evaluation. A detailed exposition of the axiomatics and methodology of qualimetry is
found in Azgaldov (1981).
However, being aware that a considerable proportion of the “Benchmarking” readers
may not be familiar with the basic principles and terminology of qualimetry, the authors
considered it necessary to provide some simple explanations concerning this discipline.
To this end, we introduce some basic concepts used in qualimetry. We recognise the
fact that, to date, several approaches to the quantitative assessment of quality have been
developed within the framework of qualimetry. The terminology used herein refers to
the most common of them (while it features the least labour input it is also least precise
and reliable).
Object, any thing or process:
.
animate (e.g. a human specialist) or inanimate (e.g. a motor car);
.
a product of labour (e.g. concrete for road surfacing) or a product of nature
(e.g. the surface relief on the alignment of a future motorway);
.
material (e.g. a workshop manufacturing products) or virtual (e.g. a television
commercial);
.
natural (e.g. a mountain landscape) or man-made (e.g. a complex of structures); and
.
a product (e.g. clothing) or a service (e.g. the operation and repair of electric
equipment).
6. In what follows, we apply the term “object” to an object such that its quantity in accepted Applied
units of measurement equals 1; we can call it singular. Which is to say that one truck can qualimetry
be an object but several (e.g. three) trucks cannot. Similarly, one can of fuel, one batch of a
concrete-mixer (of a particular concrete composition), etc.
Property, a feature, characteristic or peculiarity of an object that shows itself in the
course of its consumption or operation, use or application (hereinafter all these words
will be used interchangeably – Auth.) according to its purpose, e.g. TV set mass. 433
We call the reader’s attention to a very important circumstance for understanding the
meaning of the term “property”; though it was noted in its definition it may be ignored in
practice. To wit: properties are not just any features/characteristics of an object but such
and only such ones that show themselves in the course of its manufacture or
consumption/application/use/operation.
Here, is an examplet. Every ferromagnetic article is known to possess the
magnetostriction quality, an ability to change its form and size in response to change in
the magnetic field.
Let us take a look at two kinds of products made of ferromagnetic (steel): a wrist
chronometer watch and the crawler dozer tracks. Clearly, magnetostriction is
characteristic of both.
The way magnetostriction shows itself in the chronometer is that its accuracy is
impaired under the influence of a strong magnetic. As for the tracks, the magnetostriction
phenomenon in the physical sense does occur during their operation. As to its effect,
however (for example, the magnitude of the absolute and relative change in their shape
and size), magnetostriction does not affect the tracks’s capacity to perform their function,
viz to be the driving element of the mover caterpillar belt. Consequently, for these articles,
we can think that magnetostriction does not show itself in the course of their consumption
(not in a physical, but in an economic, consumer’s sense).
It follows that with an object like a chronometer watch the presence of
magnetostriction is to be interpreted as one of its properties, whereas in the case of
the caterpillar belt tracks it is not considered to be a property in the sense of the above
definition of “property”.
The above-mentioned properties can be classified:
.
By the degree of complexity, into complex properties (i.e. decomposable into
other, less complex ones) and elementary properties (i.e. non-decomposable ones).
.
With respect to the process of want satisfaction, into use properties
(or, for simplicity, object properties), which satisfy individual social needs,
and reliability properties, by means of which object properties are realised or
manifested. Reliability properties as applied to products of labour include
storability, flawlessness, maintainability and longevity.
Individual properties (any elementary and some complex ones) can be measured in units
of measurement specific to each property. Such a measurement produces values of the
absolute indices of the property Qi (i ¼ 1, . . . ,n; n – the number of object properties).
Such measurements (i.e. the determination of the values of absolute indices of property)
can be done by:
(a) Methods of metrology (e.g. the measurement of mass, geometric dimension,
strength).
7. BIJ (b) Methods of experimental psychology (e.g. expert measurement of aesthetic, some
18,3 ergonomic and ecological properties).
(c) Analytical methods, when we know the functional relationship between the
absolute indices of a complex property and its constituent less complex properties
(e.g. when we determine the annual capacity of a transport vehicle). For case (c), a
complex property will be called a “quasi-elementary” one.
434
Quality, a complex property which is the aggregate of properties such and only such
that characterise the results (both desirable/positive and undesirable/negative)
obtained during the consumption of an object but do not comprise its costs of creation
and consumption. Which is to say that this aggregate is limited to the properties
associated with the result obtained in consuming an object and does not include
properties associated with the costs that underlie the result.
We note that:
.
the properties that form quality do not include properties that show themselves
during the production/creation/formation/manufacturing of objects; for the sake of
simplicity in what follows we will commonly use one generic term, manufacturing,
instead of four – production, creation, formation, manufacturing – unless the use
of the other three synonymous terms is specially provided for; and
.
the life cycle of an object will consist by convention of two general stages,
production and consumption; subsumed under the latter will be what is known
as the distribution stage with regard to some objects that are products of labour.
Thus, when one analyses the quality of an object one can – in fact must – abstract from
the product manufacturing method and its costs at the manufacturing and consumption
stages and, thus, limit our analysis to the results, positive and negative, obtained at the
consumption stage.
The relation between quality and its influencing properties – complex,
quasi-elementary, and elementary – can be represented by a hierarchy (a property
tree built by the rules defined in qualimetry); at its bottom level is quality (as the most
general, complex property of an object) and at its top level are elementary and
quasi-elementary properties. The reliability property is not included in the property tree.
Every elementary or quasi-elementary property other than the absolute measure Qi is
also characterised by a relative measure, Ki, which expresses the degree of manifestation of
the property relative to a benchmark (reference) measure, Q ben , and a rejection one, Q rej :
i i
Qi 2 Qrej
i
Ki ¼ : ð1Þ
Qben 2 Qrej
i i
The quantities Qben and Qrej reflect the level of time-varying social needs. Therefore, the
i i
relative measure Ki characterises the degree to which the need for a particular object
property is satisfied. The values of Ki for the same property, i.e. at a constant Qi,
may change (as a rule, for the worse) with time as social needs grow, which finds
expression in the variation of the values of Qben and Qrej .
i i
Every elementary or complex property of an object is characterised in quantitative
terms by its weight (importance) among all the other properties, the weight coefficient, Gi.
8. Two groups of techniques can be used to determine the values of these coefficients, Applied
expert techniques and non-expert (analytical) ones.
Reliability properties are taken into account primarily by means of the efficiency
qualimetry
retention factor, Keff, which is the ratio of the total usable time of an object to its
benchmark lifetime.
To quantify quality a relative measure, Krel, is used which is defined by the function
Krel ¼ f(Ki, Gi, Keff), i ¼ 1, . . . ,n, where n is the number of elementary and 435
quasi-elementary properties of an object (without considering reliability properties).
The function f can be expressed by polynomials, various means, etc. When some rather
soft constraints are fulfilled, the function f can be represented by the expression:
X
K rel ¼ K eff K i Gi : ð2Þ
If in addition to the properties that form the quality of an object, we consider also the
properties that describe the social costs of its manufacturing and consumption (we call
them “cost effectiveness”), the totality of these properties forms the so-called “integral
quality” of the object. The determination of the values of the integral quality measure KS
is based on the same principles we have described above as applied to Krel.
Cost effectiveness in some cases can be represented either by so-called “reduced
costs” or so-called “full costs”.
From the above definitions of “quality” and “cost effectiveness” (and from the
accompanying explanations) it follows that the total set of object properties can be splite
into two disjoint subsets: properties forming the quality of an object and properties
forming its cost effectiveness.
Because the users of an object are not, as a rule, interested in its quality alone not
caring about its cost effectiveness, or alternatively, in its cost effectiveness without
regard for its quality, it was felt that qualimetry should have a characteristic that would
recognise the total set of object properties associated with the results obtained in using
the object (quality) and the costs incurred (cost effectiveness).
This characteristic, described as “integral quality” in qualimetry, is thus the most
general characteristic of an object, which recognises all its properties.
Inasmuch as quality control is the main – though by no means only – area where the
qualimetry toolbox is applied, what follows will primarily refer to this subject field.
However, it should be noted that some of the other fields, mentioned above, have
addressed similar problems, among them benchmarking (Sullivan, 1986).
Qualimetry and “quasimetry”
The application potential of qualimetry as a component part of quality control stems
from its interdisciplinary and intersectoral character. Its main applications are in
problem solving regarding new product planning, market research and competitive
power in domestic and external markets.
Special works were written scrutinising the question of how and where managers can
apply qualimetric tools in a market economy (Azgaldov, 1991) or relative to
competitiveness (Azgaldov, 1990). Experience shows, however, that when qualimetry
was applied in this, as well as other, fields, qualimetric tools were sometimes used
improperly or crudely (“Improperly” here refers to qualimetric applications not based on
a scientifically validated technique of quantitative assessment of quality, which has
been developed in theoretical qualimetry).
9. BIJ Improper applications of qualimetry – we call these crude applications
18,3 “quasimetry” – can have deplorable consequences. Here, is just one example
(although many more can be cited).
Back in the 1980s, the Soviet Union saw a strong movement for the introduction of
government certification of product quality. Best products meeting world standards
were awarded the Quality Seal. To all appearances, figures of merit were calculated on
436 the basis of qualimetry; in actual fact, it was “quasimetry” pure and simple. As a result,
by 1985, nearly half (45 per cent) of the products due for certification received the Quality
Seal; in industries such as construction engineering and road engineering the figure
could be as high as 79 per cent. At face value it was all world-class production, which
given its very low pricing should have led to its great growth in competitiveness and,
accordingly, a jump in the share of engineering products going for export. In point of
fact, quite the opposite happened. By that time, the share of engineering production in
Soviet exports had fallen to 4 per cent and that of high technologies, to 0.6 per cent. The
root cause was self-deception in quality assessment, made possible by the substitution of
“quasimetry” for qualimetry. It makes no difference that it was the time of a planned
economy and today we are living in a market economy: the nature and effects of blunders
committed in quality assessment are substantially the same (Smelyakov, 1966).
Here, is one more example. In 1999, one of these authors took part in a conference,
which considered a progress report on a research project commissioned by the Russian
Ministry of Science and Technology. Its subject was “Quality of Life: Criteria and
Quantitative Assessment”. Obviously, if the project title includes the two keywords,
quality and quantitative assessment, it was supposed – in fact it had – to refer
to qualimetry. It was nothing of the kind. The first report variant did not even mention
qualimetry. That is not the point, however; after all, as the saying goes, “Call me a pot but
heat me not”. The worst of it was that the report suggested that the quality of life be
evaluated with a 30-year-old method, ignoring all that had been developed by theoretical
qualimetry during that period. One of us tried to open the project leaders’ eyes to the
inadmissibility of their technique, which if used could sanctify by the authority of
science some off-the-wall conclusions regarding the actual, rather poor, life quality
situation in this country.
This brings up the question: why should “quasimetry” rather than qualimetry be
used at all? There seem to be two main reasons.
For one thing, it is often thought that quality measurement is quite a simple, if not a
primitive problem. Let a chief give direction, and any engineer or economist who is an
expert in a branch or a sub-branch of production will develop a quality scoring method.
If a computer is used into the bargain, all doubt about the excellence of the method
should fall away automatically!
Second, people who devise new or apply existing quality evaluation techniques are
overwhelmingly unaware of the existence of theoretical qualimetry, which dictates
rather stringent requirements that qualimetric methods must meet if qualimetry is not to
turn into “quasimetry”. Regrettably, this is true not only of “ordinary” designers of
quality measurement methods but also of some of those who have put into circulation
world-known methods. One is Stiftung Warentest in Germany, which regularly
publishes its quantitative ratings of the quality of various consumer goods in the Test
magazine; their findings have been uncritically reprinted by some Russian journals,
e.g. Spros (“Demand”). As a result, the quantitative ratings of the quality of different
10. samples of goods of the same purpose but different quality permit, at best, to Applied
obtain information on an ordinal scale (that is, the extent to which these samples differ in qualimetry
quality) but produce no information on a ratio scale (that is, the degree of their
difference). Yet, this is the claim made by the authors of the respective techniques!
There is one more shortcoming in the quality applications of qualimetry besides
improper use, namely, failure to use the qualimetry toolbox where it can and must be
applied. However, in view of the limitation on the size of this paper this second shortcoming 437
will not be considered. Those interested in this aspect of the problem are referred to a
relatively recent publication, dealing with the most practical fields of application for
qualimetry in systems of statistical control of product quality (Azgaldov, 1998).
Therefore, hereinafter the problem of qualimetry will only be discussed in terms of
errors in the application of quantitative measures of quality. In other words, the object of
this paper is to warn numerous authors in this field again the repetition of such errors.
These errors have been examined by one of the authors (Azgaldov, 1975, 1989).
However, given that these sources are relatively rare and thus virtually inaccessible to
the readers of “Benchmarking” these authors deemed it possible to reiterate their
arguments.
To repeat: the present authors for reasons of the size acceptable for this kind of paper
are prevented from making a very strong case or adducing a fairly comprehensive
review of publications in this area.
Typical errors in quality evaluation procedures
These errors can be conveniently considered in the order defined by the acknowledged
algorithm of qualimetric analysis (Azgaldov, 1994). Notably, they have been found in
papers since the institutionalisation of qualimetry (in 1968) to the present.
Specification of basic terms
Francis Bacon advised: before any debate – in a broader sense any discussion of a
point – terminology must be clarified. Therefore, the problem specified in the title of this
paper, if it is to be understood correctly, requires that key terms applied be clearly
defined, primarily, the terms quality and quality control.
Here, quality – according to the philosophy of the book What is Quality (Glichev et al.,
1968) and State Standard 15467-79 (Product Quality, n.d.) and that definition which has
been given above, which is based on it – denotes the aggregate of properties of an object
(in special cases, a product or a service), which manifest themselves in its
consumption/exploitation/use/application and which describe the consumption
outcomes, positive and negative, but not the costs of its production and consumption.
Product quality depends on three factors:
(1) the quality of design;
(2) the quality of materials (stock, semi-finished products and component parts); and
(3) the quality of work (compliance with design and regulations, i.e. prevention of
spoilage).
As is generally known, these factors do not influence product quality to the same
extent. Design quality is overwhelmingly the dominant factor in as many as 70 per cent
of all cases (Ettinger and van Sittig, 1968).
11. BIJ Unfortunately, people talking of product quality often, too often, reduce it to a single
18,3 factor, at best two, which is usually the quality of work. For example, throughout the
period of the so-called “Five-year Plan of Effectiveness and Quality” in the Soviet Union
in the 1970s, reject rate reduction in production was very nearly the main indicator of a
successful solution to the quality problem. Meanwhile design quality was actually
underestimated or estimated incorrectly. This resulted in considerable losses of
438 economic, social, even political terms. Hereafter, we will speak mainly about design
quality, which exerts a dominant influence on the quality of finished products.
With respect to the term quality control one feels the need for a clear explanation of
this as well as a number of related terms: quality change, quality improvement, quality
loss, quality maintenance and quality stabilisation. Confusing these terms leads to
economic and other losses, too. For example, when you familiarise yourself with a
promotional statement to the effect that the quality of a product has been improved, you
often see that what it does refer to is not an improvement, but at best a change, in quality.
Therefore, steps were taken towards more precise definition of these close categories,
indeed, their more formalised presentation. Owing to the obvious limit on the size of this
paper, we will not present the system of these terms and formalised definitions. We only
note that these concepts differ in the completeness of information about the variable
parameters the totality of which characterises the quality control process. These
quantities are:
.
DK: variation in the figure of merit (in absolute magnitude and in sign); and
.
DT: variation in the time interval in which quality changes in absolute
magnitude.
In total, 12 conceptually possible combinations of these parameters were identified and
each was associated with a quality variation process: improvement, loss, maintenance,
stabilisation and control. Note that in this approach quality control is seen as a change
(usually improvement) in quality within prescribed limits at a set time.
Unless our terminology is clarified, as we did above, it is pointless and even harmful
to use the terms quality and quality control. However, as shown in Glichev et al. (1968),
this kind of error is fairly common.
Defining an evaluation situation
Almost every published, as well as unpublished but applied, procedure for quantitative
assessment of quality neglects the need, before starting work on such a procedure,
to define the evaluation situation. Designers of these procedures, and certainly their
users, do not know in what scale – ordinal, interval or ratio – the numerical results of
quality measurement will be obtained. In actual fact, these results are overwhelmingly
expressed in an ordinal scale, which sharply reduces the arithmetic that can be done with
these results. This narrows their area of application; for instance, they cannot be used to
stimulate improvement in the quality of a product or a service. Yet, users and designers
of these procedures, understandably, try to expand their scope of application and act as
if there were a more informative – and much more labour consuming – ratio scale. What
happens is that these procedures lead to quite unreliable quality evaluation data.
In order to eliminate this drawback, a designer of a quality estimation method before
starting work must obtain answers to three groups of questions specifying the
conditions of:
12. (1) application of this type of object; Applied
(2) use of calculated figures of merit; and qualimetry
(3) design of a quality assessment method.
Listed below are some – by no means all! – of these questions.
Is it necessary to take into account (in terms of intellectual and physical capacity) the
end-user of the object concerned? What is the social rank of the individual from whose 439
perspective the object will be evaluated? Should the so-called patent-law properties
be taken into account? Should the highest possible accuracy of estimation be sought in
each case, bearing in mind that accuracy grade depends monotonically on the estimation
method development and use effort? Should quality estimates of different objects be
comparable? (For details of defining an evaluation situation, see Azgaldov (1995a)).
Building a property tree
It is clear to everyone, as well as justified theoretically, that figures of merit depend to a
great extent on the measures/criteria of properties that collectively form a quality model
of an object being evaluated. So great is this dependence that it can well lead to the
following situation: with one set of measures, object A will be better than object B, and
with another set, it may be vice versa, B will be better than A. It is then clear that the set
of measures by which quality is evaluated should be presented unambiguously, if not
standardised. Furthermore, this set should be ordered/decomposed into a hierarchy, or a
property tree (as already mentioned). Unless these two conditions are satisfied, one and
the same object may be evaluated very differently, even oppositely. In other words,
quality may be measured with a “rubber ruler” rather than a steel one.
Designers are not to blame, being only guilty of the lack of knowledge about the right
set of measures to make sure they measure with a “steel ruler”. Many do not even suspect
that the problem exists. To illustrate, back in the 1970s, a well-known Soviet economic
journal carried an article in which two esteemed academic economists said in plain
Russian: “To be brief, we decompose quality in some way or other into separate
properties” (Fedorenko and Maiminas, 1971). However, as already mentioned, such an
arbitrary decomposition may well lead to a “rubber ruler” situation.
In order to counter this pitfall, qualimetry has established a set of rules, which if
followed guarantee that different individuals independently of each other will arrive at
almost identical property trees for the same object (Azgaldov, 1996). In most quality
evaluation cases, unfortunately, these tree-building rules are not obeyed. Which means
that the “ruler” by which quality is measured is anything but a steel one. If follows that
we should treat with great caution any results obtained with the help of such a “ruler”.
By way of illustration, a very common fallacy is to leave in a property tree
only more important characteristics. The argument is that minor characteristics
being unimportant contribute little or nothing to a figure of merit. The argument would
be valid, if it were only a matter of neglecting just one property. The fact is, however, that
in the great majority of cases, not one but very many properties are excluded from a
property tree. Yet, the cumulative importance of these properties can be quite
significant; this may add greatly to the error in the final quality estimate.
Another example, one among very many. It is often the case that when two or more
objects of the same kind are compared for quality, in order to reduce the calculation effort,
some properties equally pronounced in the variants being compared are left out
13. BIJ of consideration. The findings of the comparison are then treated as if they were expressed
18,3 on a ratio scale; in other words, as already mentioned, it is assumed that this information
shows not only the amount by which one variant differs from the other, but also the factor
by which the difference manifests itself. In point of fact, when equally pronounced
characteristics are left out, evaluation results cannot be obtained either on a ratio scale
(“how many times”) or on an interval scale (“to what extent”). In this case, figures of merit
440 can only be expressed on an ordinal scale; in other words, the information obtained tells us
which is better in quality, but not how much and, least of all, to what degree.
Weighting
One of the more common errors in weighting is to depend exclusively on the Delphi
technique. In fact, there are analytical (non-Delphi) methods, which can be applied (even
if less frequently) to weighting. Moreover, they do much better than Delphi ones in terms
of closeness in estimation (one of these methods, perhaps the first ever to be presented in
strictly mathematical terms, was devised by Academician Krylov (Krylov, 1951), the
noted Russian mechanic and shipbuilder).
Even when Delphi techniques are applied to weighting, ignorance of the basics of the
methodology of qualimetry can result in great errors. For example, in the Stiftung Warentest
technique, weight factors are rounded to multiples of 5 per cent. Then, for relatively
unimportant characteristics whose weights are taken equal to 5 per cent or 10 per cent, the
error introduced in calculations due to the use of roughened data can be 50 per cent or more.
Finally, the last but not least, with the Delphi approach to weighting, few if any
techniques give an indication of the error at which weight factors were calculated.
Meanwhile theoretical qualimetry (Azgaldov, 1982) has long validated calculation
formulas that can be applied to interrelated problems:
.
given a confidence interval and a confidence probability describing the desirable
weighting accuracy, determine the necessary number of panel members; and
. given knowledge of the number of respondents, determine some important statistical
characteristics of the expert survey outcomes, e.g. collective expert appraisal error.
To be sure, there are some other aspects to the intelligent application of the Delphi
technique the ignorance of which leads to lower accuracy in expert-based results. They
are not considered here for lack of space.
Determining benchmarks and rejection values of property measures
Very many, if not most, practical methods of quality assessment are guilty of one
fundamental fallacy. Benchmark values (often poorly termed base ones) of quality
characteristics are most often adopted with the help of either of the two algorithms below:
(1) Select a few objects analogous to the object being evaluated; identify a superior
quality object among them; define as benchmarks the values of the individual
properties of this object.
(2) For the set of analogous objects selected by algorithm (1), determine the best
values of each property; accept them as benchmarks.
It should be mentioned that theoretical qualimetry has proven theorems implying that
the use of either algorithm can lead to large errors in final results, the error probability
being higher in the case of the first algorithm. It has also been demonstrated
14. that the only correct way of benchmarking is to select the world’s best (at the time of Applied
estimation) values of the measure of the respective property. qualimetry
The foregoing – as far as frequent errors and benchmarking algorithms are
concerned – is also true of the rejection values (often mistermed marginal values)
of property measures.
Determining absolute values of property measures 441
Very many quality assessment methods here and abroad (including the Warentest
approach) use a verbal rather than a numeric technique of gradation of absolute
magnitudes of properties. For instance, a five-point verbal scale is often used: “very
good”, “good”, “satisfactory”, “unsatisfactory”, “very unsatisfactory”. Sometimes,
an equivalent numeric five-point scale is employed. However, because of the limited
number of gradations fractional error increases to ^ 20 per cent.
To reduce fractional error we need, all other things being equal, to increase the
number of gradations. Which is not to say that we must maximise it, but that we must
optimise it according to man’s psychological ability, which admits gradations in the
range of 10-12. In other words, we should use the familiar five-point scale complemented
with the intermediate values “ þ ” or “ 2 ”.
Similar results can be obtained if we use a 100 per cent scale with 10 per cent
gradations (with the exception of the beginning and the end of the scale, where finer
gradations are possible). Of course, this refers to properties that are either too difficult or,
for some reason or other, undesirable to represent by common physical units of measure.
Determining relative values of measures
As has been mentioned above, more primitive quality assessment methods in order to
achieve the comparability of the absolute measures Qi (by reducing them to the same
scale and expressing them in the same units of measure) transform Qs into the relative
measures Ks by means of the normalization:
Q ij 2 qrej
i
K ij ¼ ;
q ben 2 qrej
i i
where:
i is the property number.
j is the object number.
qben is the benchmark value of a property measure.
i
qrej
i is the rejection value of a property measure.
Clearly, 0 # Kij # 1 and it expresses a linear relationship between the function K and
the argument Q. In actual fact, their relationship is usually nonlinear (Azgaldov, 1982).
It is taken to be linear simply from considerations of easier calculation.
Some practical quality assessment methods, however, depart from the above
formula, which obviously results in miscalculations. Departures may be isolated or
combinations thereof, as listed below:
(1) Formula components such as the benchmark value qben and the rejection value
i
qrej are left out.
i
15. BIJ (2) For the properties of one and the same object, two quite different kinds of
18,3 relationship are used:
.
linear at Qij , qben ðK ij ¼ Qij =qben Þ; and
i i
.
nonlinear (hyperbolic) at Qij . qben ðK ij ¼ qben =Qij Þ
i i
It is clear that the use of two different kinds of relationship has no logical justification
442 whatsoever.
Factoring in reliability properties
In the quality assessment practice, the most common approach to factoring in reliability
characteristics is to recognise them alongside the other characteristics that collectively
constitute quality. But, as already mentioned, qualimetric theory demonstrates that this
approach is basically incorrect for two reasons.
First, it is generally not possible to recognise in calculations all the properties that
according to State Standard 27.003 – 83 “Reliability in Engineering” collectively define the
concept of reliability, viz, retention ability, operational safety, maintainability and lifetime.
Second, and most important, reliability is not sought for its own sake. It is not an
end in itself but a means of actualisation of the properties for which a particular
product/service was designed in the first place, that is, in general, the properties of
functionality and appearance.
For the reasons given above reliability must be accounted for as the efficiency
retention factor, which describes the proportion of the benchmark time for the object
when it is ready for use, i.e. not under repair or in maintenance or inoperative or
obsolescent. This coefficient, varying from 0 to 1, must be multiplied by the contraction
function by dint of which all the functionality and appearance properties are recognised;
the nature of this function is described in the next section.
Determining the value of the integral quality index
As already noted, in the quality assessment method described here (which is not the only
one in qualimetry), the quality index KQ can be expressed by the weighted average
formula:
X
KQ ¼ KE
j j Kij £ Gi;
where:
KQ
j is the quality index of the jth object (0 # K Q # 1).
j
KE
j is the efficiency retention factor of the jth object (0 # K E # 1).
j
S is the summation over all the ith properties describing the quality of the object
(i ¼ 1, 2,. . . n, where n is the full number of properties describing the quality
of the object).
Kij is a relative measures of the ith property of the jth object (0 # Kij # 1).
Gi is the weight coefficient of the ith property (0 , Gi , 1).
Note a characteristic feature of calculating the value of KQ. Among the ith properties,
identify so-called “critical properties”, i.e. such that for at least one of them the
inequality qij w= , qrej (where w/, stands for “worse or equivalent”) is infeasible.
i
16. For example, a critical property for foodstuffs is “presence of harmful chemical Applied
substances”. qualimetry
If this inequality holds for at least one (any) critical property, then we take K K ¼ 0.
Conclusion
To conclude this paper on typical errors in the qualimetric analysis of products we
consider it necessary to make the following points: 443
(1) the foregoing technique is but one, if the most common, of the many methods of
qualimetry;
(2) only its simplified version – but not a rough-and ready or, least of all, rigorous
one – was considered; and
(3) the exposition was of necessity very brief.
To conclude, these authors would like to reiterate: if the material presented in this paper
is taken into account, anyone writing on the subject of quantitative estimation of quality,
whether a theorist or a practitioner, will be enabled to avoid unnecessary errors in their
research and practical methods.
References
Al-Kindi (1961), Selected Works of Thinkers of the Near and Middle East, Moscow.
Andrews, F.M. (Ed.) (1979), Scientific Productivity: The Effectiveness of Research Groups in
Six Countries, Vol. XXXIV, Cambridge University Press, London, p. 4.
Asmus, V.F. (1969), Plato, Mysl, Moscow (in Russian).
Azgaldov, G.G. (1975), “The best variant selection method: application conditions”, Ekonomika
Stroitel’stva, No. 6.
Azgaldov, G.G. (1981), “Development of the theoretical basis of qualimetry”, doctoral
dissertation, XXX, Moscow.
Azgaldov, G.G. (1982), Theory and Practice of Product Quality Assessment: Fundamentals of
Qualimetry, Ekonomika, Moscow (in Russian).
Azgaldov, G.G. (1989), “Some drawbacks manifested in the quality evaluation practice”,
Proceedings of the Conference on Upgrading Industrial Engineering in the New Economic
Context, Voronezh, Section 2.
Azgaldov, G.G. (1990), “Competitive power and qualimetry”, Elektronnnaya Tekhnika, Ser. 9,
Issue 4.
Azgaldov, G.G. (1991), “Some questions of the application of qualimetry in a market economy”,
Problems in Creating a Regulated Market, Moscow.
Azgaldov, G.G. (1994), “Some general information about metrology and qualimetry”, Standarty i
Kachestvo, No. 11.
Azgaldov, G.G. (1995a), “Defining an evaluation situation”, Standarty i Kachestvo, Nos 9 and 12.
Azgaldov, G.G. (1995b), “Informatisation – quantification – qualimetry”, Proceedings of the
4th International Forum on Informatisation ( MFI-95. Pt 1), Moscow.
Azgaldov, G.G. (1996), “Building a tree of property measures for an object”, Standarty i
Kachestvo, No. 11.
Azgaldov, G.G. (1998), “Product quality management and qualimetry”, Rynok i Kachestvo
Yaroslavii, No. 3 (1999, No. 1).
17. BIJ Ettinger, J. and van Sittig, J. (1968), More Through Quality, Standards Publishers, Moscow
(transl. from English).
18,3 Fedorenko, N.P. and Maiminas, E.Z. (1971), “Towards the organisation of economic decision
making”, Voprosy Ekonomiki, No. 3.
Frolov, E.D. (1958), “The life and work of Xenophon”, Proc. of LSU, No. 251.
Glichev, A.V., Panov, V.P. and Azgaldov, G.G. (1968), What is Quality?, Ekonomika, Moscow
444 (in Russian).
Gukovsky, M.A. (1947), Leonaro da Vinci’s Mechanics, USSR Academy of Sciences Publishers,
Moscow (in Russian).
Ifenthaler, D., Pirnay-Dummer, P. and Seel, N.M. (2010), Computer-based Diagnostics and
Systematic Analysis of Knowledge, Springer, New York, NY, p. XXI.
Kant, I. (1966), Works in 6 Vols, Vol. 6, Mysl, Moscow (in Russian).
Krylov, A.N. (1951), “On the assessments of projects presented to the competition”, Collected Works
of Acad. A.N. Krylov. Pt 1. Memoirs and Memoir Essays. Moscow-Leningrad.
Product Quality (n.d.), Product Quality: Terms and Definitions. - GOST 15467 – 79.
Samochvalov, V.V. (2004), “Distinctive features of using the method of analysis of hierarchies in
estimating problems on the basis of metric criteria”, Cybernetics and Systems Analysis,
Vol. 40 No. 5.
Smelyakov, N.N. (1966), “On the quality criteria of industrial products”, Tekhnicheskaya Estetika, No. 4.
Sullivan, L.P. (1986), “Quality function deployment”, June, available at: www.deming.nm.ru/TehnUpr/
StrFunKa.htm; http://subscribe.ru/archive/insurance.it2bpro/200512/22110916.html
Technometrics (n.d.), Technometrics. – In: Wikipedia.
White, D.J. (1969), Decision Theory, Aldine Publishing Company, Chicago, IL.
Yudin, D.B. (1974), Mathematical Methods of Management under Incomplete Information,
Sovetskoe Radio, Moscow (in Russian).
Zimmerer, Th.W. and Stroh, Th.F. (1974), “Preparing managers for performance appraisal”,
SAM Advanced Management Journal, Vol. 39 No. 3.
Further reading
Azgaldov, G.G. and Kostin, A.V. (2008), “Strategic management: main applications”,
Strategicheskii Menedzhment, No. 3 (in Russian).
About the authors
Garry G. Azgaldov, a pioneer of Qualimetry, is a Doctor of Economics and a Fellow of the International
Academy of Informatisation, the Russian Academy of Natural Sciences, the Academy of Economic
Sciences and Business, the Futures Research Academy, the Academy of Quality Problems and the
International Guild of Quality Professionals. He is a Chief Researcher at the Central Economics
and Mathematics Institute, Russian Academy of Sciences, Moscow. Garry G. Azgaldov is the
corresponding author and can be contacted at: gazgaldov@mail.ru
Alexander V. Kostin is a Candidate of Economics, an intellectual property assessment expert,
Deputy Head of the Centre for Intellectual Property Introduction and Commercialisation, Russian
State Institute of Intellectual Property, Moscow. His research interests encompass knowledge
economies, intellectual property assessment, and applied qualimetry.
To purchase reprints of this article please e-mail: reprints@emeraldinsight.com
Or visit our web site for further details: www.emeraldinsight.com/reprints