More Related Content
Similar to Bond immunization
Similar to Bond immunization (20)
Bond immunization
- 1. Bond Immunization
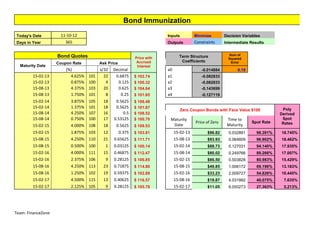
Today's Date 11-10-12 Inputs Minimize Decision Variables
Days in Year 365 Outputs Constraints Intermediate Results
Bond Quotes Sum of
Price with Term Structure Squared
Accrued Coefficients Error
Coupon Rate Ask Price
Maturity Date Interest
(%) x/32 Decimal a0 -0.014884 0.19
15-02-13 4.625% 101 22 0.6875 $ 102.74 a1 -0.082833
15-02-13 0.875% 100 4 0.125 $ 100.32 a2 -0.082833
15-08-13 4.375% 103 20 0.625 $ 104.64 a3 -0.143699
15-08-13 1.750% 101 8 0.25 $ 101.65 a4 -0.127119
15-02-14 3.875% 105 18 0.5625 $ 106.48
15-02-14 1.375% 101 18 0.5625 $ 101.87 Poly
Zero Coupon Bonds with Face Value $100
15-08-14 4.250% 107 16 0.5 $ 108.52 Derived
15-08-14 0.750% 100 17 0.53125 $ 100.70 Maturity Time to Spot
Price of Zero Spot Rate Rates
15-02-15 4.000% 108 18 0.5625 $ 109.53 Date Maturity
15-02-15 1.875% 103 12 0.375 $ 103.81 15-02-13 $96.82 0.032891 98.391% 18.745%
15-08-15 4.250% 110 21 0.65625 $ 111.71 15-08-13 $93.93 0.064609 96.902% 18.462%
15-08-15 0.500% 100 1 0.03125 $ 100.14 15-02-14 $88.73 0.127031 94.140% 17.935%
15-02-16 4.000% 111 15 0.46875 $ 112.47 15-08-14 $80.02 0.249766 89.266% 17.007%
15-02-16 2.375% 106 9 0.28125 $ 106.85 15-02-15 $66.50 0.503828 80.983% 15.429%
15-08-16 4.250% 113 23 0.71875 $ 114.80 15-08-15 $49.85 1.006172 69.196% 13.183%
15-08-16 1.250% 102 19 0.59375 $ 102.88 15-02-16 $33.23 2.009727 54.826% 10.445%
15-02-17 4.500% 115 13 0.40625 $ 116.57 15-08-16 $19.87 4.031992 40.075% 7.635%
15-02-17 2.125% 105 9 0.28125 $ 105.78 15-02-17 $11.05 8.050273 27.363% 5.213%
Team: FinanceZone
- 3. Cash Matching
Cash matching w/ Cash matching with
Cash Matching reinvestment at zero
rate
reinvestment (poly
spot rates)
Maturity Coupon Dirty Price Portfolio Portfolio Inputs Minimize
15-02-13 0.04625 $ 102.74 $ 101.08 $ 19.26 Outputs Constraints
15-02-13 0.00875 $ 100.32 $ 98.71 $ 18.81 Decision Variables
15-08-13 0.04375 $ 104.64 $ 101.39 $ 19.32 Intermediate Results
15-08-13 0.01750 $ 101.65 $ 98.50 $ 18.77
15-02-14 0.03875 $ 106.48 $ 100.24 $ 19.10
15-02-14 0.01375 $ 101.87 $ 95.90 $ 18.27
15-08-14 0.04250 $ 108.52 $ 96.87 $ 18.46
15-08-14 0.00750 $ 100.70 $ 89.89 $ 17.13
15-02-15 0.04000 $ 109.53 $ 88.70 $ 16.90 <===== Decision Variables
15-02-15 0.01875 $ 103.81 $ 84.07 $ 16.02
15-08-15 0.04250 $ 111.71 $ 77.30 $ 14.73
15-08-15 0.00500 $ 100.14 $ 69.30 $ 13.20
15-02-16 0.04000 $ 112.47 $ 61.66 $ 11.75
15-02-16 0.02375 $ 106.85 $ 58.58 $ 11.16
15-08-16 0.04250 $ 114.80 $ 46.00 $ 8.76
15-08-16 0.01250 $ 102.88 $ 41.23 $ 7.85
15-02-17 0.04500 $ 116.57 $ 31.90 $ 31.90
15-02-17 0.02125 $ 105.78 $ 28.95 $ 5.51
Total Cost 144428.7294 30526.16687 <===== Objective Function (Minimize)
CF from Portfolio CF from Portfolio
Date Obligation
15-02-13 10000 < $ 9,800.21 9961.94
15-08-13 5000 < $ 4,800.11 4961.92
15-02-14 40000 < $ 39,803.86 39962.63
15-08-14 7000 < $ 6,813.24 6964.42
15-02-15 80000 < $ 79,827.23 79967.08 <===== Cash Flow Constraints
15-08-15 12000 < $ 11,853.41 11972.07
15-02-16 50000 < $ 49,879.76 49977.09
15-08-16 6000 < $ 5,912.77 5983.38
15-02-17 15000 < $ 14,939.16 14962.59
Team: FinanceZone
- 4. Duration Front End
Duration Optimization Maturity Coupon Dirty Price Portfolio
Inputs Minimize 15-02-13 0.04625 $ 102.74 0
Outputs Constraints 15-02-13 0.00875 $ 100.32 0
Decision Variables 15-08-13 0.04375 $ 104.64 0
Intermediate Results 15-08-13 0.0175 $ 101.65 0
15-02-14 0.03875 $ 106.48 0
Date Obligation 15-02-14 0.01375 $ 101.87 0
15-02-13 10000 15-08-14 0.0425 $ 108.52 0
15-08-13 5000 15-08-14 0.0075 $ 100.70 0
15-02-14 40000 15-02-15 0.04 $ 109.53 0
15-08-14 7000 15-02-15 0.01875 $ 103.81 0
15-02-15 80000 15-08-15 0.0425 $ 111.71 0
15-08-15 12000 15-08-15 0.005 $ 100.14 0
15-02-16 50000 15-02-16 0.04 $ 112.47 0
15-08-16 6000 15-02-16 0.02375 $ 106.85 0
15-02-17 15000 15-08-16 0.0425 $ 114.80 0
15-08-16 0.0125 $ 102.88 0
15-02-17 0.045 $ 116.57 0
15-02-17 0.02125 $ 105.78 0
Objective 0
Constraint Portfolio = Obligation
PV PV = 5000
Constraints ======> dPV/da0 PV-1 = 33000
dPV/da1 PV-2 = -73000
dPV/da2 PV-3 = 68000
dPV/da3 PV-4 = -38000
dPV/da4 PV-4 = -9000
Team:FinanceZone
- 5. Results Table a0 a0-a1 a0-a2 a0-a3 a0-a4
Maturity Coupon Dirty Price Portfolio Portfolio Portfolio Portfolio Portfolio
15-02-13 0.04625 $ 102.74 $ 21,448.36 $ 1,029.12 $ 1,029.12 $ 286.35 $ 377.20
15-02-13 0.00875 $ 100.32 $ 3,962.43 $ 190.12 $ 190.12 $ 52.90 $ 69.69
15-08-13 0.04375 $ 104.64 $ 20,664.31 $ 991.50 $ 991.50 $ 275.88 $ 363.42
15-08-13 0.0175 $ 101.65 $ 8,029.56 $ 385.27 $ 385.27 $ 107.20 $ 141.21
15-02-14 0.03875 $ 106.48 $ 18,624.40 $ 893.63 $ 893.63 $ 248.65 $ 327.54
15-02-14 0.01375 $ 101.87 $ 6,323.06 $ 303.39 $ 303.39 $ 101.05 $ 111.20
15-08-14 0.0425 $ 108.52 $ 20,819.07 $ 998.93 $ 998.93 $ 277.95 $ 366.14
15-08-14 0.0075 $ 100.70 $ 3,409.18 $ 163.58 $ 163.58 $ 45.52 $ 59.96
15-02-15 0.04 $ 109.53 $ 19,777.05 $ 948.93 $ 948.93 $ 264.04 $ 347.81
15-02-15 0.01875 $ 103.81 $ 8,786.06 $ 421.57 $ 421.57 $ 117.30 $ 154.52
15-08-15 0.0425 $ 111.71 $ 21,430.07 $ 1,028.25 $ 1,028.25 $ 286.11 $ 376.88
15-08-15 0.005 $ 100.14 $ 2,260.23 $ 108.45 $ 108.45 $ 30.18 $ 39.75
15-02-16 0.04 $ 112.47 $ 20,306.66 $ 974.34 $ 974.34 $ 271.11 $ 357.13
15-02-16 0.02375 $ 106.85 $ 11,454.69 $ 549.61 $ 549.61 $ 152.93 $ 201.45
15-08-16 0.0425 $ 114.80 $ 22,023.09 $ 1,056.70 $ 1,056.70 $ 294.03 $ 387.31
15-08-16 0.0125 $ 102.88 $ 5,804.99 $ 278.53 $ 278.53 $ 77.50 $ 102.09
15-02-17 0.045 $ 116.57 $ 23,678.32 $ 1,136.12 $ 1,136.12 $ 316.12 $ 416.42
15-02-17 0.02125 $ 105.78 $ 10,146.85 $ 486.86 $ 486.86 $ 135.47 $ 178.45
Objective $ 248,948.39 $11,944.90 $ 11,944.90 $ 3,340.28 $ 4,378.16
Team:FinanceZone