More Related Content
Similar to (Portfolio summary)
Similar to (Portfolio summary) (20)
Recently uploaded
Industrial Policy - 1948, 1956, 1973, 1977, 1980, 1991Industrial Policy - 1948, 1956, 1973, 1977, 1980, 1991RKavithamani
(Portfolio summary)
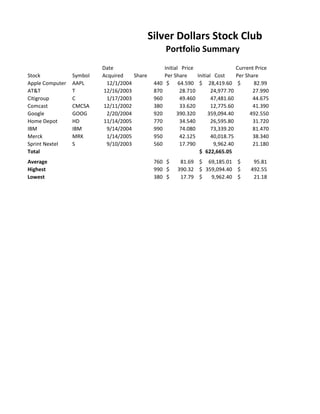
- 1. Silver Dollars Stock Club
Portfolio Summary
Date Initial Price Current Price
Stock Symbol Acquired Share Per Share Initial Cost Per Share
Apple Computer AAPL 12/1/2004 440 $ 64.590 $ 28,419.60 $ 82.99
AT&T T 12/16/2003 870 28.710 24,977.70 27.990
Citigroup C 1/17/2003 960 49.460 47,481.60 44.675
Comcast CMCSA 12/11/2002 380 33.620 12,775.60 41.390
Google GOOG 2/20/2004 920 390.320 359,094.40 492.550
Home Depot HD 11/14/2005 770 34.540 26,595.80 31.720
IBM IBM 9/14/2004 990 74.080 73,339.20 81.470
Merck MRK 1/14/2005 950 42.125 40,018.75 38.340
Sprint Nextel S 9/10/2003 560 17.790 9,962.40 21.180
Total $ 622,665.05
Average 760 $ 81.69 $ 69,185.01 $ 95.81
Highest 990 $ 390.32 $ 359,094.40 $ 492.55
Lowest 380 $ 17.79 $ 9,962.40 $ 21.18
- 2. Club
Percent
Current Value Gain/loss Gain/Loss
$ 36,515.60 $ 8,096.00 28.49%
24,351.30 -626.4 -2.51%
42,888.00 -4,593.60 -9.67%
15,728.20 2,952.60 23.11%
453,146.00 94,051.60 26.19%
24,424.40 -2,171.40 -8.16%
80,655.30 7,316.10 9.98%
36,423.00 -3,595.75 -8.99%
11,860.80 1,898.40 19.06%
$ 725,992.60 $ 103,327.55 16.59%
$ 80,665.84 $ 11,480.84
$ 453,146.00 $ 94,051.60 28.49%
$ 11,860.80 ($4,593.60) -9.67%