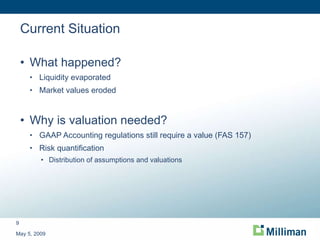
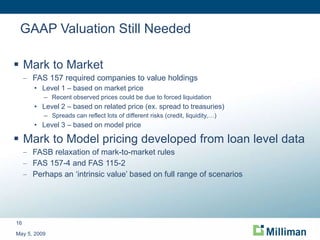
MORTGAGE BACKED SECURITIES  AN ACTUARIAL APPROACH TO CASH FLOW ANALYSIS  Kyle S. Mrotek, FCAS, MAAA Neal Dihora, ASA, CFA May 5, 2009 CAS Spring Meeting May 5, 2009
Agenda What is a Mortgage Backed Security (MBS)? Background on the MBS market Current situation Actuarial model presentation May 5, 2009
What is a Mortgage Backed Security? Investor B (XYZ Ins. Co.) Investor A (Pension Fund) MBS Issuer/ Trustee Originator A (Retains Servicing) Originator B Servicer Jack Sally Jane John Mortgage Payments Mortgage Payments Mortgage Mortgage Payments Payments Sells Servicing Rights Purchases Jane’s  Mortgage Purchases John’s  Mortgage Purchases Jack’s  Mortgage (Payments) Purchases Sally’s  Mortgage (Payments) Buys a Portion of MBS Buys a Portion of MBS Cash Flows Cash Flows Jane & John’s Payments May 5, 2009
MBS Valuation Flowchart May 5, 2009
Gross Issuance May 5, 2009
Agency vs. Non-Agency May 5, 2009
Non-Agency by Type May 5, 2009
Current Situation What happened? Liquidity evaporated Market values eroded Why is valuation needed? GAAP Accounting regulations still require a value (FAS 157) Risk quantification Distribution of assumptions and valuations May 5, 2009
Liquidity Evaporated Broker/Dealers of non-Agency MBS unwilling to provide liquidity  1 Forced liquidations of MBS set market prices   1 Pricing vendors find it difficult to obtain “real” prices Bid - Ask spread is 10-30 points depending on collateral and the depth of distress   2 May 5, 2009 1 AD&Co's 16th Annual Conference: The Times They Are A-Changin‘ 2 ”Getting Out of the Mess” by Dave Hurt at the Loan Performance Symposium March 11, 2009
Liquidity Evaporated May 5, 2009
Erosion of Market Values May 5, 2009
Erosion of Market Values ABX HE AAA 2007-2 Index Components May 5, 2009 Source: markit.com 3/16/09 ACE Securities Corp. Home Equity Loan Trust, Series 2007-HE4 Bear Stearns Asset Backed Securities I Trust 2007-HE3 Citigroup Mortgage Loan Trust 2007-AMC2 CWABS Asset-Backed Certificates Trust 2007-1  First Franklin Mortgage Loan Trust, Series 2007-FF1 GSAMP Trust 2007-NC1  Home Equity Asset Trust 2007-2  HSI Asset Securitization Corporation Trust 2007-NC1  J.P. MORGAN MORTGAGE ACQUISITION TRUST 2007-CH3 Merrill Lynch First Franklin Mortgage Loan Trust, Series 2007-2  MERRILL LYNCH MORTGAGE INVESTORS TRUST, SERIES 2007-MLN1  Morgan Stanley ABS Capital I Inc. Trust 2007-NC3  Nomura Home Equity Loan, Inc., Home Equity Loan Trust Series 2007-2  NovaStar Mortgage Funding Trust, Series 2007-2  OPTION ONE MORTGAGE LOAN TRUST 2007-5  RASC Series 2007-KS2 Trust  Securitized Asset Backed Receivables LLC Trust 2007-BR4  Structured Asset Securities Corporation Mortgage Loan Trust 2007-BC1  SOUNDVIEW HOME LOAN TRUST 2007-OPT1  WaMu Asset-Backed Certificates WaMu Series 2007-HE2
GAAP Valuation Still Needed Mark to Market  FAS 157 required companies to value holdings Level 1 – based on market price Recent observed prices could be due to forced liquidation Level 2 – based on related price (ex. spread to treasuries) Spreads can reflect lots of different risks (credit, liquidity,…) Level 3 – based on model price Mark to Model pricing developed from loan level data FASB relaxation of mark-to-market rules  FAS 157-4 and FAS 115-2 Perhaps an ‘intrinsic value’ based on full range of scenarios May 5, 2009
GAAP Valuation Still Needed FAS 157 –Level 3 assets as % of tangible common equity May 5, 2009
Risk Quantification The following table has daily percent changes of DJIA under a Normal Distribution assumption and reality May 5, 2009 Source:  Benoit Mandelbrot, Economist 1/24/2009 Percent Move  (1916-2003) Normal  Distribution Assumption Reality <>3.4% 58 1001 <>4.5% 6 366 <>7% 1 in 300,000 years 48
MBS Valuation Flowchart May 5, 2009
MBS Valuation Process Collateral Extensive history Utilize loan level experience Macro factors Home prices Interest rates Unemployment May 5, 2009
Model General Characteristics Transparent Credit Focus Prepay model Willingness Interest rate Ability Current LTV Lending standards/policies Federal government initiatives May 5, 2009
Credit Model Collateral ‘loss’ projection Amount and timing ‘ Loss’ is failure to pay timely P&I Methods ‘ Paid’ Loss Development Factor (LDF) ‘ Incurred’ LDF Adjusted ‘paid’ BF method ‘ Incurred’ BF Non-exhaustive May 5, 2009
Ultimate Loss Rate ‘Paid’ LDF Ultimate loss rate (ULR) ‘ Paid’ losses to date Can calculate from loan level data Data aggregators Cumulative loss curve by age of loan Reciprocal of cumulative LDF Examples on next slide What % of the losses should we expect to see at a certain loan age Ultimate loss = ‘paid’ losses / % expected to be ‘paid’ May 5, 2009
Ultimate Loss Rate ‘Paid’ LDF May 5, 2009
Ultimate Loss Rate “Incurred” LDF Incurred losses = ‘paid’ losses + estimate of loss on inventory of delinquent loans Roll rate model = Frequency/Severity method Frequency = Pr( default | status of delinquency) Severity (% of loan that is not recoverable) Utilize incurred loss curves to calculate ultimate loss rate Challenges/pitfalls May 5, 2009
Challenges/Pitfalls May 5, 2009 Source: Moody’s Subprime RMBS Loss Projection Update, March 5, 2009 Source:  Moody’s March 5, 2009
Challenges/Pitfalls May 5, 2009 Source: Moody’s Alt-A RMBS Loss Projection Update, January 22, 2009 Source:  Moody’s January 22, 2009
B/F Method A Priori ULR Development Frequency of default Severity given default Unadjusted a priori ultimate loss rate = frequency x severity Critical considerations for loan level collateral Underwriting characteristics (FICO, LTV, documentation, etc.) Economic factors May 5, 2009
A Priori Development - Frequency May 5, 2009
A Priori Development - Frequency May 5, 2009 Source: “Negative equity and foreclosure:  Theory and evidence”, Christopher L. Foote, Kristopher Gerardi, Paul S. Willen, Journal of Urban Economics 64 (2008), pp. 234-345
A Priori Development - Severity Severity of Default Home price changes Costs of foreclosure (realtor, legal, upkeep) Accrued interest Stressed sale Government intervention may impact severity May 5, 2009
A Priori Development - Severity May 5, 2009
Ultimate Loss Rate Adjusted Paid BF Paid losses to date A priori persistency adjustment Actual persistency = unpaid balance / original balance A priori persistency = anticipated unpaid balance / original balance Adjustment needed to allow for more/less losses based on actual vs. anticipated exposure duration Adjust a priori ultimate loss rate by persistency factor Use loss curve to estimate % yet to be paid May 5, 2009
Ultimate Loss Rate “Incurred” BF Utilize incurred loss curve Take a priori ultimate loss rate (from a priori development)  Utilize incurred loss curves to estimate % yet to be paid Incurred BF ultimate loss = incurred to date + estimate of yet to be incurred May 5, 2009
MBS Valuation Flowchart May 5, 2009
Cash Flow Waterfall MBS intrinsic value = NPV (future security CFs) Future security CFs = f(mortgage collateral performance, structure) Which security gets how much when depends on cash flow amounts and timing and triggers Various triggers May 5, 2009
Cash Flow Waterfall May 5, 2009 Illustrative NPV of Cash Flow Waterfall Output Net Present Value (NPV) RMBS Tranche Original Rating Scenario 1 Scenario 2 Scenario 3 A AAA 99.71 99.66 99.70 B AAA 77.63 78.52 69.03 C AA 79.09 7.81 1.64 D  AA 78.64 9.96 1.66 E A 80.16 2.79 0.70 F BBB 86.83 0.64 0.39 G BBB 85.62 0.49 0.39 H BB 0.94 0.40 0.39 I BB 0.78 0.40 0.39 J Not Rated 5.46 5.34 0.39 K Not Rated 0.40 0.40 0.39
MORTGAGE BACKED SECURITIES  AN ACTUARIAL APPROACH TO CASH FLOW ANALYSIS  May 5, 2009 Questions? [email_address] [email_address]

Actuarial Approach to MBS Valuation

  • 1.
    MORTGAGE BACKED SECURITIES AN ACTUARIAL APPROACH TO CASH FLOW ANALYSIS Kyle S. Mrotek, FCAS, MAAA Neal Dihora, ASA, CFA May 5, 2009 CAS Spring Meeting May 5, 2009
  • 2.
    Agenda What isa Mortgage Backed Security (MBS)? Background on the MBS market Current situation Actuarial model presentation May 5, 2009
  • 3.
    What is aMortgage Backed Security? Investor B (XYZ Ins. Co.) Investor A (Pension Fund) MBS Issuer/ Trustee Originator A (Retains Servicing) Originator B Servicer Jack Sally Jane John Mortgage Payments Mortgage Payments Mortgage Mortgage Payments Payments Sells Servicing Rights Purchases Jane’s Mortgage Purchases John’s Mortgage Purchases Jack’s Mortgage (Payments) Purchases Sally’s Mortgage (Payments) Buys a Portion of MBS Buys a Portion of MBS Cash Flows Cash Flows Jane & John’s Payments May 5, 2009
  • 4.
  • 5.
  • 6.
  • 7.
    Non-Agency by TypeMay 5, 2009
  • 8.
    Non-Agency by TypeMay 5, 2009
  • 9.
    Current Situation Whathappened? Liquidity evaporated Market values eroded Why is valuation needed? GAAP Accounting regulations still require a value (FAS 157) Risk quantification Distribution of assumptions and valuations May 5, 2009
  • 10.
    Liquidity Evaporated Broker/Dealersof non-Agency MBS unwilling to provide liquidity 1 Forced liquidations of MBS set market prices 1 Pricing vendors find it difficult to obtain “real” prices Bid - Ask spread is 10-30 points depending on collateral and the depth of distress 2 May 5, 2009 1 AD&Co's 16th Annual Conference: The Times They Are A-Changin‘ 2 ”Getting Out of the Mess” by Dave Hurt at the Loan Performance Symposium March 11, 2009
  • 11.
  • 12.
    Erosion of MarketValues May 5, 2009
  • 13.
    Erosion of MarketValues May 5, 2009
  • 14.
    Erosion of MarketValues May 5, 2009
  • 15.
    Erosion of MarketValues ABX HE AAA 2007-2 Index Components May 5, 2009 Source: markit.com 3/16/09 ACE Securities Corp. Home Equity Loan Trust, Series 2007-HE4 Bear Stearns Asset Backed Securities I Trust 2007-HE3 Citigroup Mortgage Loan Trust 2007-AMC2 CWABS Asset-Backed Certificates Trust 2007-1 First Franklin Mortgage Loan Trust, Series 2007-FF1 GSAMP Trust 2007-NC1 Home Equity Asset Trust 2007-2 HSI Asset Securitization Corporation Trust 2007-NC1 J.P. MORGAN MORTGAGE ACQUISITION TRUST 2007-CH3 Merrill Lynch First Franklin Mortgage Loan Trust, Series 2007-2 MERRILL LYNCH MORTGAGE INVESTORS TRUST, SERIES 2007-MLN1 Morgan Stanley ABS Capital I Inc. Trust 2007-NC3 Nomura Home Equity Loan, Inc., Home Equity Loan Trust Series 2007-2 NovaStar Mortgage Funding Trust, Series 2007-2 OPTION ONE MORTGAGE LOAN TRUST 2007-5 RASC Series 2007-KS2 Trust Securitized Asset Backed Receivables LLC Trust 2007-BR4 Structured Asset Securities Corporation Mortgage Loan Trust 2007-BC1 SOUNDVIEW HOME LOAN TRUST 2007-OPT1 WaMu Asset-Backed Certificates WaMu Series 2007-HE2
  • 16.
    GAAP Valuation StillNeeded Mark to Market FAS 157 required companies to value holdings Level 1 – based on market price Recent observed prices could be due to forced liquidation Level 2 – based on related price (ex. spread to treasuries) Spreads can reflect lots of different risks (credit, liquidity,…) Level 3 – based on model price Mark to Model pricing developed from loan level data FASB relaxation of mark-to-market rules FAS 157-4 and FAS 115-2 Perhaps an ‘intrinsic value’ based on full range of scenarios May 5, 2009
  • 17.
    GAAP Valuation StillNeeded FAS 157 –Level 3 assets as % of tangible common equity May 5, 2009
  • 18.
    Risk Quantification Thefollowing table has daily percent changes of DJIA under a Normal Distribution assumption and reality May 5, 2009 Source: Benoit Mandelbrot, Economist 1/24/2009 Percent Move (1916-2003) Normal Distribution Assumption Reality <>3.4% 58 1001 <>4.5% 6 366 <>7% 1 in 300,000 years 48
  • 19.
  • 20.
    MBS Valuation ProcessCollateral Extensive history Utilize loan level experience Macro factors Home prices Interest rates Unemployment May 5, 2009
  • 21.
    Model General CharacteristicsTransparent Credit Focus Prepay model Willingness Interest rate Ability Current LTV Lending standards/policies Federal government initiatives May 5, 2009
  • 22.
    Credit Model Collateral‘loss’ projection Amount and timing ‘ Loss’ is failure to pay timely P&I Methods ‘ Paid’ Loss Development Factor (LDF) ‘ Incurred’ LDF Adjusted ‘paid’ BF method ‘ Incurred’ BF Non-exhaustive May 5, 2009
  • 23.
    Ultimate Loss Rate‘Paid’ LDF Ultimate loss rate (ULR) ‘ Paid’ losses to date Can calculate from loan level data Data aggregators Cumulative loss curve by age of loan Reciprocal of cumulative LDF Examples on next slide What % of the losses should we expect to see at a certain loan age Ultimate loss = ‘paid’ losses / % expected to be ‘paid’ May 5, 2009
  • 24.
    Ultimate Loss Rate‘Paid’ LDF May 5, 2009
  • 25.
    Ultimate Loss Rate“Incurred” LDF Incurred losses = ‘paid’ losses + estimate of loss on inventory of delinquent loans Roll rate model = Frequency/Severity method Frequency = Pr( default | status of delinquency) Severity (% of loan that is not recoverable) Utilize incurred loss curves to calculate ultimate loss rate Challenges/pitfalls May 5, 2009
  • 26.
    Challenges/Pitfalls May 5,2009 Source: Moody’s Subprime RMBS Loss Projection Update, March 5, 2009 Source: Moody’s March 5, 2009
  • 27.
    Challenges/Pitfalls May 5,2009 Source: Moody’s Alt-A RMBS Loss Projection Update, January 22, 2009 Source: Moody’s January 22, 2009
  • 28.
    B/F Method APriori ULR Development Frequency of default Severity given default Unadjusted a priori ultimate loss rate = frequency x severity Critical considerations for loan level collateral Underwriting characteristics (FICO, LTV, documentation, etc.) Economic factors May 5, 2009
  • 29.
    A Priori Development- Frequency May 5, 2009
  • 30.
    A Priori Development- Frequency May 5, 2009 Source: “Negative equity and foreclosure: Theory and evidence”, Christopher L. Foote, Kristopher Gerardi, Paul S. Willen, Journal of Urban Economics 64 (2008), pp. 234-345
  • 31.
    A Priori Development- Severity Severity of Default Home price changes Costs of foreclosure (realtor, legal, upkeep) Accrued interest Stressed sale Government intervention may impact severity May 5, 2009
  • 32.
    A Priori Development- Severity May 5, 2009
  • 33.
    Ultimate Loss RateAdjusted Paid BF Paid losses to date A priori persistency adjustment Actual persistency = unpaid balance / original balance A priori persistency = anticipated unpaid balance / original balance Adjustment needed to allow for more/less losses based on actual vs. anticipated exposure duration Adjust a priori ultimate loss rate by persistency factor Use loss curve to estimate % yet to be paid May 5, 2009
  • 34.
    Ultimate Loss Rate“Incurred” BF Utilize incurred loss curve Take a priori ultimate loss rate (from a priori development) Utilize incurred loss curves to estimate % yet to be paid Incurred BF ultimate loss = incurred to date + estimate of yet to be incurred May 5, 2009
  • 35.
  • 36.
    Cash Flow WaterfallMBS intrinsic value = NPV (future security CFs) Future security CFs = f(mortgage collateral performance, structure) Which security gets how much when depends on cash flow amounts and timing and triggers Various triggers May 5, 2009
  • 37.
    Cash Flow WaterfallMay 5, 2009 Illustrative NPV of Cash Flow Waterfall Output Net Present Value (NPV) RMBS Tranche Original Rating Scenario 1 Scenario 2 Scenario 3 A AAA 99.71 99.66 99.70 B AAA 77.63 78.52 69.03 C AA 79.09 7.81 1.64 D AA 78.64 9.96 1.66 E A 80.16 2.79 0.70 F BBB 86.83 0.64 0.39 G BBB 85.62 0.49 0.39 H BB 0.94 0.40 0.39 I BB 0.78 0.40 0.39 J Not Rated 5.46 5.34 0.39 K Not Rated 0.40 0.40 0.39
  • 38.
    MORTGAGE BACKED SECURITIES AN ACTUARIAL APPROACH TO CASH FLOW ANALYSIS May 5, 2009 Questions? [email_address] [email_address]

Editor's Notes