Series A OnlyVC Method Practice Problem
Solution
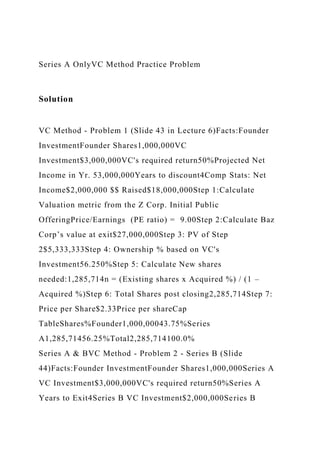
VC Method - Problem 1 (Slide 43 in Lecture 6)Facts:Founder InvestmentFounder Shares1,000,000VC Investment$3,000,000VC's required return50%Projected Net Income in Yr. 53,000,000Years to discount4Comp Stats: Net Income$2,000,000 $$ Raised$18,000,000Step 1:Calculate Valuation metric from the Z Corp. Initial Public OfferingPrice/Earnings (PE ratio) = 9.00Step 2:Calculate Baz Corp’s value at exit$27,000,000Step 3: PV of Step 2$5,333,333Step 4: Ownership % based on VC's Investment56.250%Step 5: Calculate New shares needed:1,285,714n = (Existing shares x Acquired %) / (1 – Acquired %)Step 6: Total Shares post closing2,285,714Step 7: Price per Share$2.33Price per shareCap TableShares%Founder1,000,00043.75%Series A1,285,71456.25%Total2,285,714100.0%
Series A & BVC Method - Problem 2 - Series B (Slide 44)Facts:Founder InvestmentFounder Shares1,000,000Series A VC Investment$3,000,000VC's required return50%Series A Years to Exit4Series B VC Investment$2,000,000Series B Required Return25%Series B Years to Exit2Projected Net Income in Yr. 53,000,000Comp Stats: Net Income$2,000,000 $$ Raised$18,000,000Step 1:Calculate the required Future Value of Series B VC’s investment using the 25% required rate of return: 2,000,000 x (1.25)2 3,125,000.00Step 2: Calculate Series B Required Ownership % Series B FV / Exit Valuaion from Problem 111.5741%0.562567.8241%Step 3: Calculate Required Shares to be issued to Series A VC to ensure that it owns 56.25% at exit n = (Existing shares x Acquired %) / (1 – Acquired %)2,107,914Step 4: Total Shares3,107,914Step 5: Series A Required Ownership % based on VC's Investment67.824%Step 6: Price per Share$1.42Cap TableShares%Founder1,000,00032.2%Series A2,107,91467.8%Total3,107,914100.0%
Name ;
- SECOND EXAM SPRING 2020
1. Mark Price the marketing manager for Speakers needs to find which variable most affects the demand for a line of speakers. He is uncertain whether the price of speakers of the advertising expenditures drive the sale of speakers. He plans to use the regression analysis to determine the relative impact price an advertising. He used 12 years of data which is given below. The output from his regression analysis also give:
Sales
(000)
Price Per Unit
Advertising
($000)
400
280
600
700
215
835
900
211
1100
1300
210
1400
1150
215
1200
1200
200
1300
900
225
900
1100
207
1100
980
220
700
1234
211
900
925
227
700
800
245
690
Regression Statistics
Multiple R
0.8550
R Square
0.7310
Adjusted R Square
0.6712
Standard Error
146.6234
Observations
12
ANOVA
df
SS
MS
F
Significance F
Regression
2
525718.3339
262859.1669
12.2269
0.0027
Residual
9
193485.9161
21498.4351
Total
11
719204.2500
Coefficients
Standard Error
t Stat
P-value
Lower 95%
Intercept
2191.34
826.08
2.65
0.03
322.61
Price
-6.91
2.92
-2.37
0.04
-13.51
Advertising
0.33
0.24
1.36
0.21
-0.21
a. Interpret the output from the regression analysis given above.
Measures of Central Tendency: Mean, Median and Mode
Series A OnlyVC Method Practice Problem SolutionVC Method - Proble.docx
1. Series A OnlyVC Method Practice Problem
Solution
VC Method - Problem 1 (Slide 43 in Lecture 6)Facts:Founder
InvestmentFounder Shares1,000,000VC
Investment$3,000,000VC's required return50%Projected Net
Income in Yr. 53,000,000Years to discount4Comp Stats: Net
Income$2,000,000 $$ Raised$18,000,000Step 1:Calculate
Valuation metric from the Z Corp. Initial Public
OfferingPrice/Earnings (PE ratio) = 9.00Step 2:Calculate Baz
Corp’s value at exit$27,000,000Step 3: PV of Step
2$5,333,333Step 4: Ownership % based on VC's
Investment56.250%Step 5: Calculate New shares
needed:1,285,714n = (Existing shares x Acquired %) / (1 –
Acquired %)Step 6: Total Shares post closing2,285,714Step 7:
Price per Share$2.33Price per shareCap
TableShares%Founder1,000,00043.75%Series
A1,285,71456.25%Total2,285,714100.0%
Series A & BVC Method - Problem 2 - Series B (Slide
44)Facts:Founder InvestmentFounder Shares1,000,000Series A
VC Investment$3,000,000VC's required return50%Series A
Years to Exit4Series B VC Investment$2,000,000Series B
2. Required Return25%Series B Years to Exit2Projected Net
Income in Yr. 53,000,000Comp Stats: Net Income$2,000,000 $$
Raised$18,000,000Step 1:Calculate the required Future Value of
Series B VC’s investment using the 25% required rate of
return: 2,000,000 x (1.25)2 3,125,000.00Step 2: Calculate
Series B Required Ownership % Series B FV / Exit Valuaion
from Problem 111.5741%0.562567.8241%Step 3: Calculate
Required Shares to be issued to Series A VC to ensure that it
owns 56.25% at exit n = (Existing shares x Acquired %) / (1 –
Acquired %)2,107,914Step 4: Total Shares3,107,914Step 5:
Series A Required Ownership % based on VC's
Investment67.824%Step 6: Price per Share$1.42Cap
TableShares%Founder1,000,00032.2%Series
A2,107,91467.8%Total3,107,914100.0%
Name ;
- SECOND EXAM SPRING 2020
1. Mark Price the marketing manager for Speakers needs to find
which variable most affects the demand for a line of speakers.
He is uncertain whether the price of speakers of the advertising
expenditures drive the sale of speakers. He plans to use the
regression analysis to determine the relative impact price an
3. advertising. He used 12 years of data which is given below. The
output from his regression analysis also give:
Sales
(000)
Price Per Unit
Advertising
($000)
400
280
600
700
215
835
900
211
1100
1300
210
1400
1150
215
1200
1200
200
1300
9. 2.92
-2.37
0.04
-13.51
Advertising
0.33
0.24
1.36
0.21
-0.21
a. Interpret the output from the regression analysis given above
– is this a good regression model to forecast sales
b. Evaluate the regression model. Also, comment on the sample
size (observations)
c. Write the regression equation showing the relationship
between Sales versus Advertising and Price
d. Determine whether Price or Advertising has more impact on
the forecast of Sales
e. Predict average yearly speaker sales the price was $300 per
unit and Mark is planning to spend $900 thousand in
Advertising.
2. Assume the network and data as follows:
10. a. Construct the network diagram
b. Indicate the critical path when normal activity times are used
c. Explain the procedure you would use to crash this project if
you had a penalty cost per week above 15 weeks as well you
had indirect costs per week
3. Ace Steel Mill estimates the Demand for steel in millions of
tons per year as follows
Millions of t tons
Probability
10
10
12
25
14
30
16
20
18
15
11. a. If capacity is set at 18 Million tons what is the capacity
cushion
b. What is the probability of Idle capacity
c. What is the average utilization of the plant at 18 million ton
capacity
d. If it costs $8 million per ton of lost business and $80 million
to build a million ton of capacity how much capacity should be
built to minimize the total cost
4. Explain the reasons for
a. Carrying large levels of inventories
b. Carrying Small Levels of Inventories
5. We discussed in class how MRP (Materials Planning System)
works we examined an example of the a Table with four legs
and a leg assembly. We discussed the following charts.
Please explain how the Bill of Materials Explosion takes place
12. in these charts
6.
7. Explain the following as discussed in class
Thompson manufacturing produces industrial scales for the
13. electronics industry. Management is considering outsourcing the
shipping operation to a logistics provider experienced in the
electronics industry.
a. Thompson’s annual fixed costs of the shipping operation are
$1,650,000, which includes costs of the equipment and
infrastructure for the operation. The estimated variable cost of
shipping the scales with the in-house operation is $4.70 per ton-
mile.
b. If Thompson outsourced the operation to Carter Trucking, the
annual fixed costs of the infrastructure and management time
needed to manage the contract would be $560,000. Carter would
charge $8.50 per ton-mile.
c. Currently Thompson shipped 255,000 ton-miles this year and
his shipments in the last five years have increased at the rate of
18,000 ton-miles a year.
What would you recommend Thompson to do and why?
2
Entrepreneurial Finance
Lecture 6
14. Valuing Entrepreneurial Ventures 2
Housekeeping:
This Tuesday we have an In-class exercise where you will apply
the valuation techniques that you are currently learning. To
complete this you will need to purchase the case. I have put
together a Course Pack at Harvard Business Publishing that has
the case you will need, and two other cases for later in the
course. The cases will cost $12.75. I have also added some
suggested reading that is optional and won't be directly tested
on. These cost an additional $32.90. The link for theses
purchases was sent by email and is posted on BlackBoard.
Cash, Build, Burn & Runway and Cash Conversion Cycle
Homework - Still waiting for one more student to submit the
assignment so I can't post the answer yet. Most of you did very
well. Here are two common errors that you should fix so that
you get it right for the test. For Cash Build, Burn and Runway,
be careful with the Cash Burn from Balance Sheet. You are
looking at the change in balances from one year to the next.
Also, review the slides on whether in increase or decrease in a
balance item is a cash inflow or outflow.
For Cash Conversion Cycle, there is no such thing a negative
15. days. Use absolute values. Also, your answer is in days, not
dollars. You are trying to understand how long it takes from the
time that you first invest in Raw Materials to make your product
to the date when you receive the cash from a completed sale.
1
2
Adjusted Present Value Example
3
APV formula steps
Estimate the value of the firm in three steps:
Calculate the value of the unlevered firm
Discount equity CF’s at unlevered re
Calculate interest tax savings generated from debt (tax shield),
if any
Tax rate x Debt
Sum up steps 1 and 2 and add back starting cash
Step 1:
Calculate the value of the unlevered firm
16. Calculate free-cash flows from operations:
FCF = EBIT (1 – t) + Depreciation – CAPEX – Δ NWC
Calculate the Terminal Value (future value of all steady state
firm cash flows):
Terminal Value = FCF (1 + g) / (re – g)
where g is the steady state (stable) growth rate of the firm, and
re is the unlevered cost of equity
Discount FCF and terminal value to present time using re
4
5
APV Method Example – Crunch Co.Facts:Crunch Co. is a start-
up fitness equipment company founded by Bob “Crunch”
Borkowski. Crunch Co. received a $300,000 investment from
Golden Venture Partners (GVP). After 3 years, Crunch Co. has
finally begun to generate positive earnings and free cash
flow.GVP is now considering its exit options and asks you to
help value Crunch Co. They have provided financial projections
and other information below. Value the company using the
Adjusted Present Value Method.Unlevered Cost of
Equity14%Perpetual Growth Rate4.50%Debt (US$
000’s)$200Cost of Debt10%Tax Rate22%
17. APV Method Example – Crunch Co.
Crunch Co. Selected Financial Projections (US$ 000’s)
6YearActual 1 2 3 4 5Sales$220.0 $231.0 $242.6
$254.7 $267.4 $280.8 Cost of Goods Sold132.0 138.6 145.5
152.8 160.4 168.5 General & Administrative Expenses20.0 20.0
20.0 20.0 20.0 20.0 Depreciation15.0 15.0 16.0 17.0 18.0 19.0
EBIT53.0 57.4 61.0 64.9 69.0 73.3 Interest Expense20.0 20.0
20.0 20.0 20.0 20.0 Pre-tax Income33.0 37.4 41.0 44.9 49.0 53.3
Taxes7.3 8.2 9.0 9.9 10.8 11.7 Net Income$25.7 $29.2 $32.0
$35.0 $38.2 $41.6 Selected Balance Sheet Information:Cash &
Marketable Securities24.0 33.8 37.6 45.6 47.8 53.2 Gross
Property Plant and Equipment10.0 15.0 19.0 22.0 25.0 27.0 Net
Working Capital 6.0 7.0 9.0 8.0 9.0 10.0
Time 0
YearUnlevered Free Cash Flow Calculation: 1 2
3 4 5NOPLAT (EBIT x (1 - tax rate))44.8 47.6 50.6
53.8 57.2 + Depreciation15.0 16.0 17.0 18.0 19.0 - Capital
Expenditures5.0 4.0 3.0 3.0 2.0 - Change in New Working
Capital1.0 2.0 (1.0)1.0 1.0 Unlevered Free Cash Flow$53.8
$57.6 $65.6 $67.8 $73.2 Present Value @re of 14%47.2 44.3
44.3 40.1 38.0 Cumulative PV of Forecast Period$213.9
Terminal Value Calculation$805.0 Present Value of Terminal
18. Value418.1 Crunch Co. Unlevered Value $632.0
Crunch Co. APV – Calculate Unlevered Value
7
Step 1: Calculate Unlevered Value of Crunch Co.
YearUnlevered Free Cash Flow Calculation: 1 2
3 4 5NOPLAT (EBIT x (1 - tax rate))44.8 47.6 50.6
53.8 57.2 + Depreciation15.0 16.0 17.0 18.0 19.0 - Capital
Expenditures5.0 4.0 3.0 3.0 2.0 - Change in Net Working
Capital1.0 2.0 (1.0)1.0 1.0 Unlevered Free Cash Flow$53.8
$57.6 $65.6 $67.8 $73.2 Present Value @re of 14%47.2 44.3
44.3 40.1 38.0 Cumulative PV of Forecast Period$213.9
Terminal Value Calculation$805.0 Present Value of Terminal
Value418.1 Crunch Co. Unlevered Value $632.0
Crunch Co. APV – Calculate Unlevered Value
8
Step 1: Calculate Unlevered Value of Crunch Co.
NOPLAT =
EBIT x (1 – tax rate
$57.4 x (1 – .22) = $44.8
CAPEX =
Gross PPE Yr. 1 – Gross PPE Yr. 0
$15 – $10 = $5
19. Change in NWC =
NWC Year 2 – NWC Year 1
$9.0 – $7 = $2
Present Value =
CF4 / (1 + re)4
$67.8 / (1 + .14)4 = $40.1
Terminal Value =
CF5 x (1 + g) / (r – g)
$73.2 x (1 + .045) / (.14 - .045) = $805.0
Present Value =
TV / (1 + re)5
$805.0 / (1 + .14)5 = $418.1
Keep this slide handy for the exam.
8
Crunch Co. APV – Interest Tax Shield
9
Interest Tax Shield Formula:Tax Rate x Debt