Annual Economic Costs of Rapid Curtailment of Groundwater Pumping in Kern County, by Highland Economics, commissioned by the Kern County Taxpayers Association
•Download as DOCX, PDF•
0 likes•245 views

An economic study to measure the groundwater crisis in Kern County

Recommended
Recommended
More Related Content
Viewers also liked
Viewers also liked (16)
Similar to Annual Economic Costs of Rapid Curtailment of Groundwater Pumping in Kern County, by Highland Economics, commissioned by the Kern County Taxpayers Association
Similar to Annual Economic Costs of Rapid Curtailment of Groundwater Pumping in Kern County, by Highland Economics, commissioned by the Kern County Taxpayers Association (20)
More from KernTax
More from KernTax (20)
Recently uploaded
Recently uploaded (20)
Annual Economic Costs of Rapid Curtailment of Groundwater Pumping in Kern County, by Highland Economics, commissioned by the Kern County Taxpayers Association
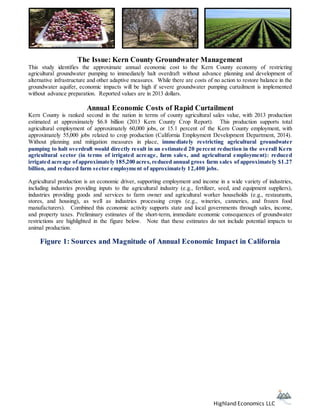
- 1. The Issue: Kern County Groundwater Management This study identifies the approximate annual economic cost to the Kern County economy of restricting agricultural groundwater pumping to immediately halt overdraft without advance planning and development of alternative infrastructure and other adaptive measures. While there are costs of no action to restore balance in the groundwater aquifer, economic impacts will be high if severe groundwater pumping curtailment is implemented without advance preparation. Reported values are in 2013 dollars. Annual Economic Costs of Rapid Curtailment Kern County is ranked second in the nation in terms of county agricultural sales value, with 2013 production estimated at approximately $6.8 billion (2013 Kern County Crop Report). This production supports total agricultural employment of approximately 60,000 jobs, or 15.1 percent of the Kern County employment, with approximately 55,000 jobs related to crop production (California Employment Development Department, 2014). Without planning and mitigation measures in place, immediately restricting agricultural groundwater pumping to halt overdraft would directly result in an estimated 20 percent reduction in the overall Kern agricultural sector (in terms of irrigated acreage, farm sales, and agricultural employment): reduced irrigated acreage of approximately 185,200 acres, reduced annual gross farm sales of approximately $1.27 billion, and reduced farm sector employment of approximately 12,400 jobs. Agricultural production is an economic driver, supporting employment and income in a wide variety of industries, including industries providing inputs to the agricultural industry (e.g., fertilizer, seed, and equipment suppliers), industries providing goods and services to farm owner and agricultural worker households (e.g., restaurants, stores, and housing), as well as industries processing crops (e.g., wineries, canneries, and frozen food manufacturers). Combined this economic activity supports state and local governments through sales, income, and property taxes. Preliminary estimates of the short-term, immediate economic consequences of groundwater restrictions are highlighted in the figure below. Note that these estimates do not include potential impacts to animal production. Figure 1: Sources and Magnitude of Annual Economic Impact in California Highland Economics LLC
- 2. There is inherent uncertainty in estimating economic impacts, from the estimates of acreage impact; to direct farm output, income, and employment; to multiplier effects in related industries. Change in agricultural acreage was estimated by Kern County water districts and farming stakeholders using an economic model of water use and agricultural acreage in Kern County, while all other impacts were estimated by Highland Economics using a combination of crop enterprise budgets, county employment data, county assessor reports, and a Kern County IMPLAN input-output model. Table 1 below summarizes economic impacts and provides a range of values (the mid-point of which is summarized in Figure 1 above). Mid-point impact estimates by sector are also summarized in Figure 2. Table 1: Summary Range of Annual Economic Impacts in California Highland Economics LLC Type of Impact Employment (Full & Part Time Jobs) Labor Income1 (Millions $) Output (Millions $) Sales, Income, and Property Taxes2 (Millions $) Crop Production Impact Direct (Agriculture Sector) 9,700 - 15,100 $421 - $841 $1,143 - $1,390 $26 - $55 Indirect (Other Industries) 5,300 – 7,600 $317 - $439 $1,214 - $1,757 $22 - $33 Subtotal 14,900 - 22,700 $738 - $1,281 $2,357 - $3,148 $48 - $88 Crop Processing Impact Direct (Food Manufacturing) 1,500 - 2,200 $109 - $182 $623 - $825 $4 - $7 1 Includes farm proprietor income, farm labor income (including contract labor and custom services), but does not include other property income from rents, dividends, interest, etc. 2 Note that property tax is only estimated for the agricultural sector (direct crop production impact). State and local sales tax is estimated based on estimated local sales of retail goods (excluding groceries and gasoline) supported indirectly by crop production and crop processing State income tax is based on labor income generated within Kern County.
- 3. Indirect (Other Industries) 3,100 – 4,100 $209 - $272 $656 - $826 $12 - $16 Subtotal 4,600 -6,300 $318 - $454 $1,279 - $1,651 $17 - $24 Total Impacts 19,600 – 29,000 $1,057 – $1,734 $3,636 – $4,799 $65 - $112 Mid-Point estimate 24,300 $1,396 $4,217 $88 Note: Figures may not sum due to rounding. Agricultural support industry employment and labor income, but not output, are included as direct effects. Figure 2: Mid-Point Annual Employment and Labor Income Impacts by Sector Highland Economics LLC 30,000 25,000 20,000 15,000 10,000 5,000 - Employment by Sector, Jobs Direct Employment Indirect and Induced Employment $1,600,000,000 $1,400,000,000 $1,200,000,000 $1,000,000,000 $800,000,000 $600,000,000 $400,000,000 $200,000,000 $0 Labor Income by Sector, $ Direct Income Indirect and Induced Income