
Recommended
Recommended
More Related Content
What's hot
What's hot (16)
Similar to Kb star factsheet apr 2019 201905
Similar to Kb star factsheet apr 2019 201905 (20)
Recently uploaded
Recently uploaded (20)
Kb star factsheet apr 2019 201905
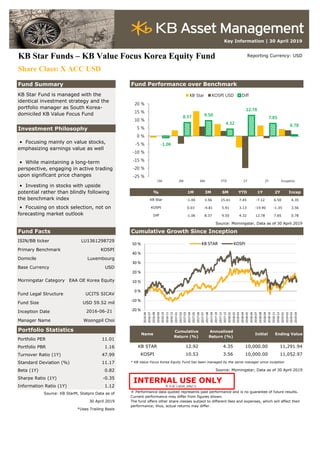
- 1. Key Information | 30 April 2019 KB Star Funds – KB Value Focus Korea Equity Fund Reporting Currency: USD Share Class: X ACC USD Fund Summary Investment Philosophy % 1M 3M 6M YTD 1Y 2Y Incep -1.04 3.56 15.41 7.45 -7.12 6.50 4.35 0.03 -4.81 5.91 3.13 -19.90 -1.35 3.56 -1.06 8.37 9.50 4.32 12.78 7.85 0.78 Source: Morningstar, Data as of 30 April 2019 Fund Facts Cumulative Growth Since Inception ISIN/BB ticker LU1361298729 Primary Benchmark KOSPI Domicile Luxembourg Base Currency USD Fund Legal Structure UCITS SICAV Fund Size USD 59.52 mil Inception Date Manager Name Woongpil Choi Portfolio Statistics Portfolio PER 11.01 Portfolio PBR 1.16 Turnover Ratio (1Y) 47.99 Standard Deviation (%) 11.17 * KB Value Focus Korea Equity Fund has been managed by the same manager since inception Beta (1Y) 0.82 Source: Morningstar, Data as of 30 April 2019 Sharpe Ratio (1Y) -0.35 Information Ratio (1Y) 1.12 투자광고2019_195(다) Source: KB StarM, Statpro Data as of 30 April 2019 *Uses Trailing Basis • Focusing on stock selection, not on forecasting market outlook Fund Performance over Benchmark KB Star Fund is managed with the identical investment strategy and the portfolio manager as South Korea- domiciled KB Value Focus Fund • Focusing mainly on value stocks, emphasizing earnings value as well • While maintaining a long-term perspective, engaging in active trading upon significant price changes • Investing in stocks with upside potential rather than blindly following the benchmark index Morningstar Category EAA OE Korea Equity 2016-06-21 Name Cumulative Return (%) ※ Performance data quoted represents past performance and is no guarantee of future results. Current performance may differ from figures shown. The fund offers other share classes subject to different fees and expenses, which will affect their performance; thus, actual returns may differ. Initial Ending Value KB STAR 12.92 4.35 10,000.00 11,291.94 Annualized Return (%) KOSPI 10.53 3.56 10,000.00 11,052.97 KB Star KOSPI Diff -1.06 8.37 9.50 4.32 12.78 7.85 0.78 -25 % -20 % -15 % -10 % -5 % 0 % 5 % 10 % 15 % 20 % 1M 3M 6M YTD 1Y 2Y Inception KB Star KOSPI USD Diff -20 % -10 % 0 % 10 % 20 % 30 % 40 % 50 % 2016-06 2016-07 2016-08 2016-09 2016-10 2016-11 2016-12 2017-01 2017-02 2017-03 2017-04 2017-05 2017-06 2017-07 2017-08 2017-09 2017-10 2017-11 2017-12 2018-01 2018-02 2018-03 2018-04 2018-05 2018-06 2018-07 2018-08 2018-09 2018-10 2018-11 2018-12 2019-01 2019-02 2019-03 2019-04 KB STAR KOSPI INTERNAL USE ONLY
- 2. Key Information | 30 April 2019 Breakdown by Cap Size Bottom-up Performance Attribution Decomposition Source: KB StarM, Data as of 31 March 2019 Top 10 Holdings % Portfolio BM Source: Statpro, 01 April 2018 ~ 31 March 2019 HANSOL CHEMICAL CO. LTD. 6.97 0.06 Bottom-up Stock Picking Effect Decomposition Y G 1 COMPANY 6.50 0.00 KOREA ZINC 6.46 0.55 FILA KOREA LTD 6.35 0.18 SK HOLDINGS CO. LTD 6.33 1.33 SOUTH KOREAN WON 5.84 0.00 COM2US CORPORATION 4.29 0.00 MERITZ FIRE & MARINE INS CO 3.17 0.16 DOOSAN BOBCAT INC 2.93 0.23 DONG - A PHARMTECH CO LTD 2.57 0.00 Sector Allocation % Source: Statpro, 01 April 2018 ~ 31 March 2019 Portfolio BM Fund Contribution by Sector Materials 25.30 9.10 Industrials 18.57 13.95 Consumer Discretionary 15.21 11.70 Cash 9.05 0.00 Financials 9.02 11.74 Telecommunication Services 6.22 6.97 Health Care 5.54 6.07 Information Technology 4.20 28.09 Consumer Staples 3.64 7.84 Real Estate 3.24 0.18 Energy 0.00 2.45 Utilities 0.00 1.92 Source: KB StarM, Data as of 31 March 2019 Source: Statpro, 01 April 2018 ~ 31 March 2019 Important Information 22.89 Weight (%) KOSPI KOSDAQ Large Cap 26.09 0.00 ※ Prior to investing in the Fund, an investor should read and understand the prospectus in full. The past performance of the collective investment scheme does not guarantee a return on investment for the future. Changes in the rates of exchange between currencies may cause the value of investment to fluctuate or result in loss of principal. There is a risk of loss of the invested principal in the collective investment scheme depending upon the result of its management and that such loss shall be imputed to investors. The portfolio information is shown for illustrative purposes only. The inclusion of the securities mentioned above is not to be interpreted as solicitations or recommendations to buy or sell. It is subject to be changed without notice. Stock GICS Sector Middle Cap 27.36 9.55 Small Cap 14.11 Stock Timing and Trading Effect Stock Picking Effect 0.58 % -0.39 % 9.49 % 0.68 % -2 % 0 % 2 % 4 % 6 % 8 % 10 % Stock Exclusion Effect Underweight Stock Effect Overweight Stock Effect Stock Addition Effect 10.35 % -0.55 % 10.90 % -2 % 0 % 2 % 4 % 6 % 8 % 10 % 12 % Stock Picking Effect Stock Timing and Trading Effect Stock Allocation Effect 7.68 % 1.21 % 1.02 % 0.38 % 0.02 % 0.00 % 0.00 % 0.00 % -0.08 % -0.09 % -0.36 % -3.78 % -7.63 % -15 % -5 % 5 % 15 % Consumer Discretionary Health Care Financials Information Technology Materials Unclassified Utilities Cash Energy Real Estate Consumer Staples Telecommunication Services Industrials KBVF Benchmark
- 3. Key Information | 30 April 2019 BEST Additions BEST Exclusions BEST Overweighed Securities WORST Overweighed Securities Source: Statpro, 01 April 2018 ~ 31 March 2019 Monthly Fund Commentary Contact Information KB Asset Management Global Investment Division Global Business Team kbgm@kbfg.com Jaesub, Lee E-Mail: jaesub.lee@kbfg.com Tel: +82-2-2167-8736 Seunghwan, Lim E-mail: seunghwan.lim@kbfg.com Tel: +82-2-2167-8204 Outlook In a situation where variables surrounding global economic conditions, including the US-China trade negotiations are growing, corporate fundamentals will be the most important determinant of share performance. In particular, we believe that there are differences in measuring fundamentals based on expectations, such as bottoming out earnings and re- valuation of some sectors based on leading stocks. Naturally, based on these expectations, stocks will be divided between those who show a rise in stock prices and those who don't. In this situation, we may be able to expect a rise in the fund's return on the back of expectation, but we believe that the bubble has not yet formed in the valuation. Accordingly, we plan to manage the fund through portfolio adjustment, such as reduction of the portion of stocks whose stock price has risen and expansion of the proportion of stocks that are significantly undervalued against corporate value, even under conservative assumptions. We believe it is important to manage the fund by looking at long-term rather than short-term volatility. Two big trends dominated the market. The first was that the pace of economic growth in Europe, China and Japan, excluding the United States, is clearly slowing, the supply of liquidity in these countries and expectations of slower rate hike in the United States are reflected in the market. The second was the volatility of the market as companies reported their first-quarter earnings. Noteworthy was that some companies, especially semiconductors, have risen due to the consensus that semiconductor has bottomed out. In addition, the possibility of investment expansion can be seen and related stocks are showing a rebound. However, uncertainty about the timing and the variation has also increased. Value focus fell by 1.04% during the month and underperformed the KOSPI by 1.06% while the KOSPI rose by 0.03%. Dong Pharmtech, Fila Korea and Hansol Chemical contributed to the rise, while Meritz Financial Group, Com2us and Hyosung Corp. contributed to the decline. 41F, Three IFC 10, Gukjegeumyung-ro, Yeongdeungpo-Gu, Seoul 07326, Korea 2.15 % 1.30 % 0.76 % 0.25 % 0.21 % 0 0.5 1 1.5 2 2.5 DONG - A PHARMTECH CO LTD SBI FINTECH SOLUTIONS CO.… SEOUL AUCTION CO LTD DAIBECK ADVANCED… SOUTH KOREAN WON 0.67 % 0.42 % 0.30 % 0.29 % 0.26 % 0 0.2 0.4 0.6 0.8 ORCHEM CO LTD SAMSUNG BIOLOGICS CO LTD AMOREPACIFIC CORP (NEW) KB FINANCIAL GROUP INC. AMOREPACIFIC GROUP INC 7.07 % 1.75 % 0.91 % 0.81 % 0.68 % -2 0 2 4 6 FILA KOREA LTD HANSOL CHEMICAL CO. LTD. MERITZ FIRE & MARINE INS… KOREA ZINC DOOSAN BOBCAT INC -1.76 % -0.64 % -0.29 % -0.24 % -0.23 % -2 -1.5 -1 -0.5 0 HYOSUNG CORP WOONGJIN THINKBIG CO LTD (NEW) HANKOOK TIRE CO LTD (NEW) KCTECH CO. LTD. LUCKY-GOLDSTAR % % % %