SlideShare a Scribd company logo
1 of 14
Download to read offline
1
Vol.:(0123456789)
Scientific Reports | (2022) 12:4280 | https://doi.org/10.1038/s41598-022-07922-w
www.nature.com/scientificreports
Heterogeneous climate change
impacts on electricity demand
in world cities circa mid‑century
Yasmin Romitti*
& Ian Sue Wing
Rising ambient temperatures due to climate change will increase urban populations’ exposures
to extreme heat. During hot hours, a key protective adaptation is increased air conditioning and
associated consumption of electricity for cooling. But during cold hours, milder temperatures have the
offsetting effect of reducing consumption of electricity and other fuels for heating. We elucidate the
net consequences of these opposing effects in 36 cities in different world regions. We couple reduced-
form statistical models of cities’ hourly responses of electric load to temperature with temporally
downscaled projections of temperatures simulated by 21 global climate models (GCMs), projecting the
effects of warming on the demand for electricity circa 2050. Cities’ responses, temperature exposures
and impacts are heterogeneous, with changes in total annual consumption ranging from−2.7 to
5.7%, and peak power demand increasing by as much as 9.5% at the multi-GCM median.The largest
increases are concentrated in more economically developed mid-latitude cities, with less developed
urban areas in the tropics exhibiting relatively small changes.The results highlight the important role
of the structure of electricity demand: large temperature increases in tropical cities are offset by their
inelastic responses, which can be attributed to lower air-conditioning penetration.
Climate change is projected to increase the frequency and intensity of populations’ exposure to extreme high
temperatures, particularly in urban ­
areas1
. Adaptation to such impacts will differ in cities across the world.
Higher temperatures will adversely affect the health of urban ­
populations2
, and trigger adaptations that affect
the demand for energy. The link between ambient temperature and mortality or morbidity is well ­
understood3,4
and averting behavior via heating and cooling are a major driver of diurnal and seasonal variability in electricity
­demand5,6
. Peak and total electricity demand are anticipated to increase worldwide as future warming increases
demand for space cooling as an adaptation to more frequent and intense spells of high ­
temperature7
. Simultane-
ously, climate warming is projected to moderate cold-season low-temperature extremes, inducing reductions in
the demand for electricity for space ­
heating8
. The relative magnitudes of these opposing effects will vary across
locations and warming ­
scenarios9
. These stylized facts highlight the importance of quantifying (i) the impact on
net energy demand of simultaneous increases in demand for cooling and decreases in demand for heating, (ii)
the effectiveness of additional electricity use for cooling in moderating adverse heat-related health outcomes,
and (iii) the environmental health, and welfare impacts associated with potential increases in greenhouse gases
and other air pollutants emitted by the electric generation necessary to satisfy increased demand.
It has been estimated that climate change will stimulate a 25–58% increase global energy demand by mid-
century10
, but a key caveat is that this result is derived using coarse spatial (national) and temporal (annual) scale
measures of both energy and ­
temperature11
. By contrast, populations’ exposures to extreme heat, and their deci-
sions to consume energy as a means of shielding themselves from associated adverse health consequences, occur
over finer time scales (hours to days) and geographic domains with a diversity of built environment contexts.
Nationwide estimates are thus unlikely to capture the heterogeneity in demand response inherent across urban
geographies resulting from distinct local structures of electricity demand and local climates. Global sub-national
differences in urbanization and population growth further underpin the significance of evaluating the energy
implications of local climate adaptation decisions that may be masked by national scale ­
estimates12
. Here we
characterize heterogeneous local climate adaptation by leveraging fine spatial and temporal scale data to model
the transient response of electricity to temperature. Our approach draws on substantial empirical literature on
the effect of temperature on the demand for energy ­
generally11,13,14
, and electricity ­
specifically9,15–20
to character-
ize the response of electric power consumption to temperature in 36 global cities on an hourly time step, and
quantify the impact on high-frequency electricity demand of mid-century climate warming.
OPEN
Boston University, Earth and Environment, Boston 02215, USA. *
email: yromitti@bu.edu
2
Vol:.(1234567890)
Scientific Reports | (2022) 12:4280 | https://doi.org/10.1038/s41598-022-07922-w
www.nature.com/scientificreports/
We make three contributions. First, data storage limitations have precluded archiving of global climate model
(GCM) outputs at the hourly frequencies on which electricity load data have become available. Estimates of
future heat ­
exposures12,21–25
have largely relied on spatially downscaled GCM simulations of daily temperatures,
but less attention has been paid to temporal downscaling to understand the transient impacts of warming
temperatures. We address this gap by combining hourly temperatures from reanalysis data with daily mid-
century temperature projections from the NASA Earth Exchange Global Daily Downscaled Climate Projections
(NEX-GDDP) under two representative concentration scenarios (RCPs) of warming, 4.5 and 8.5, and applying
a delta correction ­
method26,27
to produce hourly current and mid-century climate temperature series. Second,
we show that the hourly response of electricity demand to current and lagged temperatures leveraged in elec-
tricity market ­
forecasting28
has important implications for adaptation, owing to varying thermal properties of
the built ­
environment16
. Our statistical model incorporates a distributed lag structure similar to that employed
in epidemiological investigations of temperature on ­
mortality29
. Our third contribution is bridging separate
literatures that estimate climate impacts using differing techniques and scales. Econometric models of the non-
linear response of electric load to daily temperatures have been developed over broad spatial ­
domains18,30
while
recent estimates of high frequency cooling demand have combined high-resolution meteorological simulations
with land use maps and simple transformations of load data for individual ­
cities31
. We improve upon these
approaches by using hourly temperature observations to scale climate projections, and combining the results with
empirically-derived impact response surfaces to estimate mid-century warming effects on electricity demand.
Specifically, we employ hourly electricity data to econometrically estimate reduced-form statistical response
surfaces of electricity demand to temperature in 36 global cities. We next temporally downscale GCM simulated
future temperature projections by combining the diurnal cycle of hourly temperatures from ­
ERA532
with daily
maximum and minimum temperatures from 21 GCMs in NEX-GDDP to construct hourly temperature series for
current (2006-2020) and mid-century (2046–2060) climates that shed light on climatically-induced increases in
urban extreme heat exposures and the demand for adaptation through cooling and electricity use. We combine
these projections with our response surfaces to produce estimates of hourly impacts to electricity demand in 2050.
The resulting heterogeneity in the transient response of electricity to temperature, and impact of future
climate change on electricity demand among urban populations, differs with respect to both latitude and the
structure of final demand for energy. Temperate cities largely exhibit “V”-shaped response functions: referring
to the non-linear shape of the temperature-demand relationship that is well-documented in the empirical and
engineering ­literatures14,17,18,30,33
. Electricity demand for space cooling (heating) increases as temperatures rise
above (fall below) the “set point” temperature,T∗, where weather-sensitive electric load, L∗, is minimized—typi-
cally between 10–30◦
C. Tropical cities’ response functions range from increasing to unresponsive, as can be
seen in Fig. 1, reflecting underlying differences in built environment characteristics and social and economic
contexts across world cities. Furthermore, cities in mid-latitude temperate climates that currently experience cold
winters and mild summers see reduced demand for a mix of fuels for heating but more electricity for cooling,
with peak per-capita demand increases of up to 9.5% under future warming. Conversely, cities in the tropics that
experience warm temperatures year-round vary in their responses, exhibiting both increased consumption of
electricity for cooling and overall reductions in demand, resulting in median per capita annual impacts ranging
from−2.7 to 5.7% across GCMs. Projections of impacts under both future temperature shifts and demographic
change represent−4 to 21% of mean annual historical demand across cities with the largest effects found in both
the tropics and mid-latitudes. Annual impacts on electricity load further indicate that peak demand for cooling
during warm periods may not be entirely offset by cool period reductions in demand. The diversity of responses
in our results indicates a reversal of the north-south gradient of electricity demand impacts demonstrated in
previous ­research30
, which suggests the need for caution extrapolating impact responses derived for the mid-
latitudes to locations in the tropics. While we are not able to observe additional attributes that may be responsible
for intra-urban variation in energy demand (e.g., built environment heat transfer characteristics, prevalence of
air conditioning), nor how developing cities may evolve in the future with urbanization, our results identify and
characterize distinct patterns of temperature-responsive demand across cities, indicating these these areas are
intriguing and merit further investigation.
Results
Heterogeneous demand response profiles. Figure S1 summarizes the responses of hourly electric load
to current and lagged hourly temperatures as three-dimensional response surfaces (see Supplementary Infor-
mation—SI for figure and details regarding basis for lag structure). Figure 2 illustrates the integrated response
over contemporaneous and lagged temperatures, which falls into three broad categories: “V”-shaped, increasing,
and unresponsive. “V”-shaped responses are characteristic of the mid-latitude temperate cities in our sample.
For urban areas exhibiting this response, demand is generally largest for contemporaneous temperatures, is less
responsive to temperatures experienced up to 4 hours prior, and, relative to this minimum point, is somewhat
more responsive to temperatures further removed in time. These cities experience the widest range of seasonal
temperatures (−20 to +45 ◦
C). By contrast, for most cities in the tropics, electricity demand increases with tem-
perature—in some cases slightly non-monotonically (e.g., Abidjan, Accra, Mindelo). These climates are warm
with small annual temperature ranges (17–30 ◦
C), which obviates the need for heating, with the result that T∗
coincides with the lower support of the temperature distribution. Here too, demand tends to be most responsive
to contemporaneous temperatures, with temperatures at previous hours having impacts that are smaller in mag-
nitude but vary considerably. Finally, three tropical cities (Mbabane City, Kupang, and Nairobi) exhibit patterns
of electricity demand that are largely unresponsive to temperature, likely because of idiosyncratic geographic
factors. (These areas experience a wide range of seasonal temperatures (5–35 ◦
C) and Mbabane and Nairobi
are located at high altitudes with relatively mild climates, which may obviate the need for substantial cooling,
3
Vol.:(0123456789)
Scientific Reports | (2022) 12:4280 | https://doi.org/10.1038/s41598-022-07922-w
www.nature.com/scientificreports/
whereas Kupang is located in the eastern portion of the Indonesian archipelago where electrification rates tend
to be ­
lowest34
.)
Climate change impacts, and drivers. Shifts in cities’ hourly temperature distributions due to climate
change circa 2050 are constructed via the delta correction method by combining patterns of hourly temperature
responses to diurnal extrema that we empirically estimate from reanalysis data with daily temperature extremes
projected by 21 GCMs (see “Methods”). Figure S2 summarizes the resulting changes in mid-century cold- and
hot-season temperature distributions for the RCP 8.5 warming scenario. (Distributions for RCP 4.5 are shown
in Fig. S3.) Across GCMs, summer and winter hourly temperatures both increase for the majority of cities. The
rightward movement in the upper support of the distribution of summer temperatures exceeds the shift in the
median, indicating a lengthening of the tail of extreme high temperature exposures. Importantly, vigorous (RCP
8.5) warming’s induced shifts are larger for cities in the mid-latitudes (6–8◦
C) compared to the tropics (5–6◦
C), a
result that contrasts with prior characterizations of climatic exposure such as the increase in the number of days
with average temperatures above a pre-defined ­
threshold10
.
To quantify the impact of mid-century warming on hourly electricity demand in each city, we force our
estimated demand responses with projected temperature shifts and sum the resulting changes in hourly elec-
tricity demand per capita to project changes in electricity consumption on annual and sub-annual time-scales.
Figure 3 decomposes shifts in total annual demand into the effect of climate change on the fractional change in
total electricity demand for hours above and below T∗, and distinguishes the contribution of the structure of
electricity demand (i.e., the magnitude of the average temperature semi-elasticity of demand) from the effects
of the shift in temperature exposures (see “Methods”). In Panel a, populous mid-latitude cities such as Tokyo
have historically large annual per capita load as well as a demand structure that is sensitive to both heating
and cooling. Populous tropical developing-country cities such as Manila consume less electricity and exhibit
temperature-inelastic heating electricity demand but highly elastic cooling electricity demand (see Table S1.)
Panel b’s summary of the changes in annual hours above and below T∗ reveals a tendency toward increases in
hot hours alongside commensurate or slightly smaller reductions in cold hours. (Exceptions tend to be tropical
cities such as Abidjan, Dakar and Kupang whereT∗ lies at the lower support of the temperature distribution in
the current climate and remains there as the climate warms.) These influences drive the structure and exposure
effects summarized in Panels c and d, for which the impacts of future temperature exposures dominate those
of demand structure by an order of magnitude for many urban areas in our sample, primarily those in the mid-
latitudes. In tropical cities where the vast majority of hours are hot, the structure and exposure effects are of
similar magnitude—a phenomenon that is the key driver of net impact, to which we now turn.
Figure 1.  
Geographical distribution of sample cities. Point color corresponds to category of demand response
function: turquoise—“V”-shaped response, purple—increasing response, cyan—unresponsive.
4
Vol:.(1234567890)
Scientific Reports | (2022) 12:4280 | https://doi.org/10.1038/s41598-022-07922-w
www.nature.com/scientificreports/
Figure 4 summarizes the consequent net impacts of climate change on the total and peak demand for electric-
ity (Fig. S8 illustrates these impacts under RCP 4.5. Relative to the current climate, the change in annual demand
per capita at the multi-model median ranges from−2.7 to+5.7% (Panel a), while the change in the multi-model
median of the 95th percentile of hourly demand ranges from −3.4 to +9.5% (Panel b). In the majority of our
sample of cities, the amplifying effect of the semi-elasticity of demand to hot temperatures (T > T∗) in conjunc-
tion with climatically-induced increases in hot hours outweighs the attenuating effect of the semi-elasticity of
Figure 2.  
Response of hourly electric load to hourly temperature in 36 cities.
5
Vol.:(0123456789)
Scientific Reports | (2022) 12:4280 | https://doi.org/10.1038/s41598-022-07922-w
www.nature.com/scientificreports/
Figure 3.  
(a) Average fractional response of per capital urban electricity demand to temperatures above and
below the set point temperature,T∗. Colors indicate type of demand response (turquoise—“V”-shaped, purple—
increasing, cyan—unresponsive. (b) Change in hours over the year with temperatures above (red) and below
(cyan)T∗. (c,d) Decomposition of the change in annual total electricity demand into the effects of demand
response and shifts in the distribution of hourly temperatures.
6
Vol:.(1234567890)
Scientific Reports | (2022) 12:4280 | https://doi.org/10.1038/s41598-022-07922-w
www.nature.com/scientificreports/
demand to cold temperatures (T < T∗) in conjunction with decreases in cold hours. The net of these effects is
changes in demand of 0% up to +6% in 32 cities, and reductions of up to −2.7% in the remaining four cities.
Within this latter group, mid-latitude cities (e.g., Tokyo, Eugene, and Tacoma) experience increases in hot hours
that reduce electricity demand for heating by a larger amount than they increase demand for cooling, lowering
net annual consumption. In Mbabane City, warming shifts hours from temperatures at which demand peaks to
those where demand is actually smaller due to the decreasing monotonicity of its response.
These effects underlie changes in the 95th percentile of per capita demand (Panel b), which exceed +5% in
nearly half of our sample, typically mid-latitude temperate cities in North America (e.g., Detroit: 9.5%, Philadel-
phia: 8.9%, North Little Rock: 8.8%), while among tropical cities, the largest increases are substantially smaller
(e.g., Manila:+5.9%). By contrast, one fifth of the sample experiences declines in peak demand. Over-represented
in this group are mid-latitude cities whose peak electricity demand occurs during the cold season, and the “unre-
sponsive” tropical city of Mbabane. The surprising upshot is that the substantial increases in demand appear
concentrated in mid-latitude cities, while demand changes experienced by urban areas in the tropics tend to be
either increases or decreases of much smaller magnitude.
Heterogeneity in demand impacts also reflects the differing contributions of lagged versus current peak
(> 95th percentile) hourly temperatures in cities. Decomposing the cumulative effect of the prior 6 hours of peak
temperature exposure on mean demand (lagged response) against the effect of current hourly peak temperatures
(contemporaneous response) reveals that the latter is more influential in most cities in the mid-latitudes under
both the current and 2050 climates, but generally not in the tropics, where instead the lagged response tends to
dominate (Fig. 5, for RCP 4.5 see Fig. S9). For almost half of cities, climate change increases the effects of both
the contemporaneous and the lagged response (upward pointing arrows). The remaining cities largely display
simultaneous increases in the effect of the contemporaneous response and decreases in the effect of the lagged
response (rightward pointing arrows), a divergence that arises from differences in the slopes of the demand
response surface along the temporal dimension (Fig. S1).
Daily load profiles summarize the impact of climate change on hourly demand (Figs. S4 and S5). Mid-latitude
cities experience up to a 20% (Philadelphia) increase in peak demand at certain hours. Load duration curves
(LDCs) illustrate warming impacts to hourly demand and its seasonal dependence, a subset of which are shown
in Fig. 6 (remaining city LDCs for RCP 8.5 are in Fig. S10, and for RCP 4.5 are in Fig. S11). Urban areas whose
peak electricity consumption occurs during the hot season tend to experience amplification of peak demand (on
the order of 0.02–0.42 kWh per capita), while those with cold- or shoulder-season peaks tend to experience peak
demand attenuation. In locations such as Tacoma and Tokyo, the latter effect arises from the decline in winter
peak demand with warming. In the tropics, cities such as Antigua, Honolulu and Manila experience amplifica-
tion in load demand across all hours, while the remaining cities (which mostly belong to the “unresponsive”
group) show either partial or almost complete reductions in demand over the course of the year (e.g., Mindelo
and Mbabane City, respectively). For half of our sample of cities, concentrated in the mid-latitudes, cold-season
hours shift lower in the rank-ordering of hourly demand. Only in a few of these locations is there a perceptible
reverse shift of hot-season hours higher in the ordering (e.g., N. Little Rock). While in many cities, loads that
correspond to hours in the shoulder seasons occur at all percentiles ranks, there is a slight tendency toward hours
Figure 4.  
Percentage change in (a) total annual and (b) 95th percentile demand due to changes in hourly
temperatures circa 2050, 21 GCM simulations of RCP 8.5 warming.
7
Vol.:(0123456789)
Scientific Reports | (2022) 12:4280 | https://doi.org/10.1038/s41598-022-07922-w
www.nature.com/scientificreports/
Figure 5.  
Change in demand components attributable to contemporaneous peak (> 95th percentile)
temperatures (horizontal axis) and the cumulative effects of peak temperature exposures 1–6 h prior (vertical
axis). Gray circles indicate mean MWh per capita demand during the historical period, hollow squares indicate
median multi-model mean MWh per capita demand in 2050 under RCP 8.5, arrows indicate direction of
change.
Figure 6.  
Current and projected 2050 load duration curves (LDCs) and seasonal distribution of load for a
subset of cities. For each city, LDCs are shown for the current climate (blue), individual GCM simulations of
RCP 8.5 warming (yellow), and the multi-GCM median (red). Colored panels illustrates each city’s seasonal
distribution of hourly demand in the current climate (bottom) and RCP 8.5 warming (top), blue: winter, red:
summer, green: spring, orange: fall.
8
Vol:.(1234567890)
Scientific Reports | (2022) 12:4280 | https://doi.org/10.1038/s41598-022-07922-w
www.nature.com/scientificreports/
in spring (autumn) moving lower (higher) in the demand order, consistent with warming-induced electricity
demand reductions for heating demand and increases for cooling.
Finally, we assess the implications of the foregoing impacts for urban areas’ absolute electricity consumption
circa mid-century. Coupling our climatically-driven shifts in annual per capita load with 2050 population projec-
tions under two shared socioeconomic pathway (SSP) scenarios—SSP3 and SSP5 (see “Methods”)35,36
, allows us
to account for the additional influence of future population expansion (Table 1, RCP 4.5 Table S2). The RCP 8.5
multi-model median impact on annual load exceeds 500 GWh for a fifth of our sample of cities under both SSPs,
with the largest load level increases in Manila, Singapore, Chandigarh, and Detroit—representing 7.2 (7.6)%,
2.5 (2.7)%, 20.8 (21.4)%, and 2.2 (3)% of annual demand for SSP3 (SSP5), respectively. The patterns of change in
cities’ levels of annual demand are broadly consistent across both SSP scenarios, but larger in magnitude under
SSP5. Effects are concentrated in mid-latitude temperate cities and electricity-intensive cities in the tropics (e.g.,
Manila, Singapore). At the 95th percentile across GCMs, amplification of load over hot hours will require an
additional 1000–3000 GWh in 8 cities.
Discussion
Across 36 cities, mid-century climate change will exert heterogeneous impacts on electric power consumption,
driven by the interaction between shifts in cities’ distributions of hourly temperatures and the structure of their
temperature-sensitive electricity demands. Increases in peak demand are concentrated in the mid-latitude, tem-
perate, mostly North American cities in our sample, resulting in up to a 9.5% amplification at the 95th percentile
of annual demand, while tropical cities’ peaks see comparatively modest increases (0–5.9%) and even declines
(up to 0.6%). This pattern is corroborated by mid-century shifts in load duration curves, leading to increases in
peak-hours of as much as 0.42 kW per person in North American cities—a substantial fraction of non-weather
sensitive demand. The largest absolute increases in urban electricity demand are projected to occur in the trop-
ics as well as the mid-latitudes, reflecting the importance of population expansion in addition to temperature-
dependent per-person demand.
Our findings constitute an important qualification to the previously-discovered north-south polarization of
electricity demand under climate ­
warming30
. Specifically, our results for the tropics suggest that this latitudinal
gradient of impact severity is unlikely to extend all the way to the equator. The substantial temperature increases
experienced by tropical cities induce shifts in demand that are much smaller than the impacts of only moder-
ately larger temperature changes on mid-latitude urban areas, in contrast to prior empirically-based estimates
of energy demand amplification under similar temperature ­
change10,18
. The difference is accounted for by prior
studies’ coarser temporal resolution of temperature shifts and associated electricity demand (daily, annual),
and is particularly an artifact of the thresholds used to bin daily temperatures in order to empirically establish
their effects on temporally aggregated energy demand. Using our hourly temperatures to construct counts of
hot (T ≥ 27.5 ◦C) ­days10
, the apparent heat exposure gradient reverses to become substantially larger in the
tropics (up to 149 additional hot days) in comparison to the mid-latitudes (a maximum of only 93 additional
hot days) (Figs. S6 and S7). Although the magnitude of electricity demand responses to hot days for temperate
regions has been found to exceed those for the ­
tropics11
, consistent with our results, their combination with
binned temperatures leads to different patterns of impact across the ­
globe10
. Notwithstanding, our estimated
increases in peak and total per capita energy demand for mid-latitude temperate cities mirror the findings of
prior electricity-focused ­
studies18,37–39
.
We demonstrate that the character of the demand response to temperature, rather than solely the projected
shift in the distribution of temperatures, is an important driver of heterogeneity in electricity demand amplifica-
tion due to climate change. Despite the small size of our city sample, our results raise the caution that the “V”-
shaped splines found by previous ­
studies11,40–43
should not be considered universal, but instead tend to reflect the
patterns of demand that prevail in richer, temperate, mid-latitude cities. The latter exhibit highly elastic responses
to changes in temperature above and belowT∗ that reflect built environment thermal properties different from
those likely to prevail in the tropics. The corresponding 3D response surfaces (Fig. S1) consistently show high
demand occurring at the hottest contemporaneous temperatures as well as the highest temperatures 6 hours
prior, suggesting that buildings in these climates tend to hold heat very well. Tropical cities whose overall demand
responses are linear and increasing exhibit a diversity of lag structures. This may be a feature of the quality of
hourly demand data available in these cities (limited in temporal range and age of observations), though in addi-
tion, likely reflects not only climatic differences in built environment characteristics but also electrification and
appliance availability that are correlated with economic development. Cities in countries further from the world
technological frontier with less developed infrastructure tend to exhibit demand responses that are relatively
temperature-inelastic at all lags, resulting in only moderate electricity consumption increases with warming,
­corroborating42
. We also find moderate electricity demand impacts of future warming in most tropical cities, and
show that they are attributable to relatively modest shifts in the temperature distribution on hourly scales. The
tropics are home to a plethora of large cities whose income and population are projected to grow rapidly over
the coming decades, but are under-represented in our sample. To understand how pervasive modest impacts
might be, and establish the implications for future energy demand adaptation to climate change globally, will
require concerted efforts to collect fine spatial and temporal scale data on energy demand in developing countries.
There are additional caveats to our findings. Perhaps the most important is our limited understanding of
how the structure of electricity demand might change in the future. Evidence from India on the sensitivity of
the shape of the demand response to increasing ­
income44
, reinforces the importance of this phenomenon. In
view of the short periods over which our temperature-load relationships are estimated, we are unable to draw
inferences about the manner in which these responses are likely to shift over time with economic development
and technological ­
progress11
. Our projections thus indicate how temperature changes might influence electricity
9
Vol.:(0123456789)
Scientific Reports | (2022) 12:4280 | https://doi.org/10.1038/s41598-022-07922-w
www.nature.com/scientificreports/
SSP3
Annual T ≥ T∗ T < T∗
Median Low High Median Low High Median Low High
Abidjan 149.17 114.42 212.81 149.17 114.42 212.81
Accra 285.67 208.74 385.25 285.67 208.74 385.25
Amman 215.35 147.36 407.00 398.34 294.30 632.36 − 200.62 − 240.66 − 100.39
Antigua 18.04 13.56 26.35 18.04 13.56 26.35
Beirut 7.26 5.37 10.32 7.13 5.55 10.24 − 0.08 − 0.25 0.15
Boston 196.56 71.57 332.30 357.80 185.20 516.34 − 153.84 − 274.21 − 51.45
Chandigarh 1248.60 669.16 1860.64 1241.10 668.98 1852.70 6.46 0.60 11.52
Chattanooga 78.27 − 1.45 122.43 160.82 116.24 193.83 − 85.27 − 145.77 − 20.71
Colorado Springs 7.19 − 4.41 28.61 41.41 25.40 62.59 − 33.98 − 47.54 − 19.71
Dakar 157.37 114.48 199.17 157.37 114.48 199.17
Delhi 892.60 437.20 1344.47 865.22 417.48 1311.75 26.76 10.27 37.60
Detroit 1214.30 640.32 1526.11 1384.76 755.75 1645.97 − 133.07 − 260.83 − 67.80
El Paso 244.86 137.90 322.87 279.08 164.49 369.33 − 36.82 − 46.81 − 26.14
Eugene − 43.19 − 71.62 − 24.92 4.87 1.96 8.01 − 47.91 − 79.00 − 26.93
Honolulu 262.45 127.59 380.82 262.45 127.59 380.82
Indianapolis 121.04 32.31 205.56 291.84 168.20 421.35 − 162.77 − 296.45 − 70.78
Isla Sao Nicolau 0.63 0.44 0.91 0.58 0.35 0.88 0.06 0.01 0.09
Kansas City 38.03 17.06 66.60 55.97 33.35 96.88 − 17.23 − 30.11 − 10.14
Kupang 1.85 1.33 2.19 1.85 1.33 2.19
Los Angeles 358.34 236.67 488.30 439.35 310.68 577.98 − 80.16 − 99.46 − 47.94
Louisville 359.80 71.39 643.23 838.94 572.27 1164.78 − 498.11 − 801.49 − 176.00
Manila 3712.61 2515.98 6016.88 3712.61 2515.98 6016.88
Mbabane City − 3.17 − 3.88 − 2.51 − 3.17 − 3.88 − 2.51
Memphis 317.27 132.76 542.01 415.88 241.83 680.49 − 101.67 − 156.00 − 31.01
Mindelo 1.40 0.96 1.95 1.40 0.96 1.95
Nairobi 109.36 75.14 143.69 109.36 75.14 143.69
New York City 937.79 554.71 1240.60 1030.00 585.30 1345.79 − 105.19 − 168.62 − 23.00
North Little Rock 17.10 8.17 27.45 23.15 13.73 35.85 − 5.23 − 7.82 − 2.31
Omaha 182.35 102.09 287.89 267.05 161.20 411.02 − 87.23 − 167.42 − 50.61
Philadelphia 164.18 12.76 336.56 461.03 261.40 555.25 − 265.09 − 424.85 − 45.73
Sacramento 163.16 100.00 230.45 205.34 137.64 316.86 − 56.70 − 79.81 − 28.30
San Diego 500.05 307.01 748.94 545.38 336.90 803.31 − 45.88 − 56.02 − 30.84
Singapore 2442.06 1617.88 3618.70 2442.06 1617.88 3618.70
Springfield 27.73 − 1.41 47.16 58.66 36.27 102.88 − 36.65 − 68.23 − 18.29
Tacoma − 42.26 − 71.35 − 25.56 0.27 − 0.44 1.77 − 42.10 − 71.62 − 25.73
Tokyo − 2511.20 − 4297.67 − 1488.13 1402.82 761.27 2446.62 − 3739.96 − 6744.29 − 2625.65
SSP5
Annual T ≥ T∗ T < hT∗
Median Low High Median Low High Median Low High
Abidjan 126.10 96.73 179.90 126.10 96.73 179.90
Accra 267.09 195.17 360.20 267.09 195.17 360.20
Amman 211.47 144.70 399.66 391.15 288.99 620.95 − 197.00 − 236.32 − 98.58
Antigua 18.04 13.56 26.35 18.04 13.56 26.35
Beirut 6.44 4.76 9.16 6.33 4.93 9.09 − 0.07 − 0.22 0.13
Boston 267.79 97.51 452.73 487.46 252.31 703.46 − 209.59 − 373.59 − 70.09
Chandigarh 1280.43 686.22 1908.07 1272.74 686.03 1899.93 6.62 0.62 11.81
Chattanooga 110.06 − 2.03 172.17 226.15 163.47 272.58 − 119.92 − 205.00 − 29.12
Colorado Springs 10.08 − 6.17 40.08 58.00 35.58 87.68 − 47.60 − 66.60 − 27.61
Dakar 158.19 115.08 200.21 158.19 115.08 200.21
Delhi 1031.99 505.47 1554.44 1000.34 482.68 1516.61 30.94 11.87 43.47
Detroit 1676.49 884.04 2106.98 1911.82 1043.41 2272.46 − 183.72 − 360.10 − 93.60
El Paso 255.46 143.87 336.85 291.16 171.61 385.32 − 38.42 − 48.84 − 27.27
Eugene − 59.85 − 99.24 − 34.54 6.75 2.72 11.10 − 66.39 − 109.47 − 37.32
Honolulu 353.15 171.69 512.43 353.15 171.69 512.43
Continued
10
Vol:.(1234567890)
Scientific Reports | (2022) 12:4280 | https://doi.org/10.1038/s41598-022-07922-w
www.nature.com/scientificreports/
demand, holding the characteristics of urban areas constant as they are today. An alternative approach could be
to utilize the response of mid-latitude cities in developed nations as models for the future, on the assumption
that they reflect the manner in which tropical cities might evolve on the time frames over which the climate
is anticipated to ­
change30
. If tropical cities with relatively inelastic demand responses are endowed with the
response function of the tropical city with the most weather-sensitive demand in our sample (Manila), future
warming induces larger percentage (up to +5.3%) and absolute (up to 798 GW under SSP5) changes in peak
load (Fig. S12 and Table S3). Nevertheless, whether tropical developing urban areas at mid-century will behave
similarly to their mid-latitude developed counterparts today is highly uncertain. Temperate cities may provide
an indication for how the set point of the temperature-responsive components of demand may shift, however,
this assumption does not indicate how the overall shape of cities’ demand responses might shift with economic
and technological development. To address this gap, one potential avenue for future research is analyzing how
the shape of the temperature-load relationship shifts with proxies for structural and technological change in
energy systems that can be linked to scenarios of socioeconomic ­
futures45
. Given the dependence of demand in
the least developed regions on the diffusion of ­
electrification46
, the challenge will be to develop sufficiently long
load time series from which to infer how demand responses to temperature might be influenced by development,
and use the results as archetypes that can be applied to electrifying locations.
A related shortcoming, shared with prior empirical ­
work10,11,18,30
, is our model’s implicit focus on adapta-
tion at the intensive margin—the temperature responsiveness of energy demand conditional on the stock of
electricity-using durable goods, without explicit consideration of the extensive margin—temperature-induced
technology adoption, particularly air conditioning (AC) ­
capital47
. The latter has been quantified by exploiting
variation in stocks of energy-using durables across locations with different climates and incomes, in conjunction
with spatially and temporally varying data on electricity demand and ­
weather48
. This approach has leveraged
observations of multiple locations within a country, but given the large differences in the levels of economic
development among our cities and in particular the paucity of data on appliance holdings, its relevance to the
current analysis remains open to question. A potential way forward is characterizing the joint dependence of AC
penetration on temperature, income and other indicators of development leveraging census data for temperate
and tropical countries. This is an active area of our research in progress.
Despite these limitations, our contribution is to highlight new implications for climate change impacts and
adaptation of the fine temporal and spatial scale structure of electricity demand. Our results suggest that prior
demand responses estimated for developed, temperate areas are unlikely to reflect the temperature dependence
of electricity consumption in developing, tropical areas. Naive extrapolation of patterns of energy demand
adaptation to warming observed in the mid-latitudes could thus potentially over-estimate the magnitude of
climate change impacts, both in the tropics and globally. Even so, we urge caution in drawing broad conclusions
from the current small sample of cities. As primary data collection makes available additional hourly load series
SSP5
Annual T ≥ T∗ T < hT∗
Median Low High Median Low High Median Low High
Indianapolis 166.90 44.54 283.43 402.39 231.92 580.97 − 224.44 − 408.75 − 97.60
Isla Sao Nicolau 0.35 0.24 0.50 0.32 0.19 0.48 0.03 0.00 0.05
Kansas City 52.49 23.55 91.93 77.25 46.03 133.72 − 23.78 − 41.56 − 14.00
Kupang 2.03 1.46 2.41 2.03 1.46 2.41
Los Angeles 490.70 324.10 668.67 601.63 425.44 791.48 − 109.77 − 136.20 − 65.66
Louisville 501.08 99.43 895.81 1168.37 796.98 1622.16 − 693.70 − 1116.21 − 245.12
Manila 3913.29 2651.98 6342.12 3913.29 2651.98 6342.12
Mbabane City − 3.12 − 3.82 − 2.47 − 3.12 − 3.82 − 2.47
Memphis 439.13 183.75 750.19 575.62 334.72 941.86 − 140.72 − 215.91 − 42.93
Mindelo 0.85 0.59 1.19 0.85 0.59 1.19
Nairobi 126.43 86.87 166.11 126.43 86.87 166.11
New York City 1270.88 751.74 1681.26 1395.85 793.19 1823.81 − 142.55 − 228.51 − 31.17
North Little Rock 23.73 11.34 38.08 32.12 19.06 49.74 − 7.25 − 10.85 − 3.21
Omaha 251.48 140.80 397.03 368.30 222.31 566.84 − 120.29 − 230.89 − 69.79
Philadelphia 223.92 17.40 459.03 628.78 356.51 757.29 − 361.55 − 579.45 − 62.37
Sacramento 224.58 137.64 317.21 282.64 189.45 436.14 − 78.04 − 109.86 − 38.96
San Diego 620.19 380.77 928.88 676.41 417.85 996.31 − 56.91 − 69.48 − 38.25
Singapore 2607.53 1727.51 3863.91 2607.53 1727.51 3863.91
Springfield 39.56 − 2.01 67.27 83.67 51.74 146.75 − 52.28 − 97.33 − 26.09
Tacoma − 57.86 − 97.70 − 35.00 0.37 − 0.60 2.43 − 57.64 − 98.07 − 35.23
Tokyo − 3669.57 − 6280.11 − 2174.58 2049.91 1112.43 3575.20 − 5465.14 − 9855.31 − 3836.82
Table 1.  Change in total annual GWh across GCMs under RCP 8.5 at the median, 5th (low) and 95th (high)
percentiles under SSP3 and SSP5. Median, 5th (low) and 95th (high) percentiles of change under both SSPs are
also presented for future temperatures≥ T∗ and< T∗.
11
Vol.:(0123456789)
Scientific Reports | (2022) 12:4280 | https://doi.org/10.1038/s41598-022-07922-w
www.nature.com/scientificreports/
in diverse areas that have not been previously observed, our bottom-up methodology serves as a template that
facilitates quantification of the net effects of temperature on electricity demand associated with heterogene-
ous climatically-induced rightward shifts in local temperature distributions. Over time, expanding the slate of
observations to a more diverse array of urban areas will enhance understanding of the extent to which top-down
estimates of the energy demand impacts of climate change might be constrained by fine-scale heterogeneity in
climatic and socioeconomic conditions.
Methods
We empirically project the changes in electricity demand in urban areas as a consequence of mid-century climate
change by first using hourly observations of temperature and electricity load to model urban electricity demand
response functions. Separately, we use daily temperature series simulated by 21 GCMs and observed historical
hourly temperature series in conjunction with a temporal downscaling algorithm to calculate the shifts in extreme
low and high temperature exposures that will be experienced by these 36 global cities to 2050. The projected
shifts in temperature distribution are combined with results from the demand response functions to construct
projections of climate-change driven shifts in hourly electricity demand.
Data. For use in our empirical model, we first combine data of hourly electricity demand with meteorological
data and population estimates across 36 global cities. Hourly electricity consumption profiles for the majority
of cities in this data sample were taken from Cohen et al.49
converted to Universal Coordinated Time (UTC)
and matched with corresponding temperature values. The dataset provides hourly electric load series in mega-
watts (MW) for various years spanning the period 2003-2018 across different urban areas in North America,
Africa, and (primarily southern) Asia (Table S4). While its geographic coverage is limited, the dataset’s fine spa-
tial (city) and temporal (hourly) resolution distinguishes it from similar datasets of hourly electric load that are
only available for broad spatial domains (e.g., U.S. load balancing areas or European countries).
As described ­
in42
, hourly electricity demand was collected from electric utilities, system operators and regula-
tory bodies serving sample cities for the most recent years for which data were available at the time, as such these
data may not reflect the most current state of these urban energy systems. For India’s National Capital Territory
of Delhi, load was disaggregated into five “cities”, each served by a distinct and non-overlapping electricity dis-
tribution company (details ­
in42
, Supplementary Information). We re-aggregate these series to provide summed
hourly profiles of electricity consumption for the entire Delhi urban area. Further information describing load
data and quality are available in the SI.
Meterological data are obtained from the European Centre for Medium-Range Weather Forecasts’ (ECMWF)
ERA5 ­dataset32
. Centroids of cities’ central business districts or financial districts (where available) were taken to
be representative of their encompassing urban area, and used to query ERA5 raster datasets. We extracted hourly
series for 2 m air temperature, dew point temperature, wind speed, and downward shortwave radiation for years
matching our electricity load data. To construct hourly measurements from GCM daily minimum and maximum
temperature projections, hourly air temperatures were extracted for all cities for the 15 year period 2004–2018.
We utilize the NASA Earth Exchange Global Daily Downscaled Projections (NEX-GDDP) to calculate the
effects of mid-century temperature projections relative to those in the historical ­
period50
. NEX-GDDP contain
bias-corrected and spatially downscaled daily maximum and minimum temperatures on a 0.25◦
grid over the
2006-2100 period for RCP 4.5 and RCP 8.5 scenarios derived from 21 GCMs participating in the global Climate
Model Intercomparison Project phase 5 (CMIP5)51
. Detailed information on NASA NEX-GDDP is available
at https://​cds.​nccs.​nasa.​gov/​nex-​gddp/ and described in both https://​esgf.​nccs.​nasa.​gov/​esgdoc/​NEX-​GDDP_​
Tech_​Note_​v0.​pdf ­and50
.
Population data were collected from the U.S. Bureau of Economic Analysis (BEA) Personal Income, Popula-
tion, Per Capita Personal Income (CAINC1) tables for all U.S. cities in our sample by metropolitan statistical
area (MSA)52
. For cities with populations >300,000, population estimates were obtained from the United Nations
World Urbanization Prospects 2018 ­
revision53
. Estimates for Antigua, Isla Sao Nicolau, Kupang, Mbabane City,
and Mindelo were gathered from both national and international sources; described in Table S8. Spatially explicit
global population projections consistent with the Shared Socioeconomic Pathways (SSPs) are available ­
from54
.
These projections cover the period 2010–2100 in ten year time intervals on a 0.125◦
grid. We extract mid-century
population projections for SSP3 (high challenges to mitigation and adaptation) and SSP5 (high challenges to
mitigation, low challenges to adaptation) to scale our projections of average hourly per capita impact to electric-
ity demand. SSP3 describes a demographic trajectory characterized by high population growth rates in the high
fertility countries and declining population in low fertility countries with slow rates of urbanization, while SSP5
describes a scenario of accelerated demographic transition with low population growth in high fertility countries,
high levels of growth in low fertility countries, and rapid ­
urbanization36,54
.
Empirical approach. We estimate the nonlinear response of cities’ electricity load to temperature using a
generalized additive model (GAM)55
. Letting h index hours of the year, electric load (Lh) for each of 36 cities
is modeled as a crossbasis function of matched hourly current and lagged local temperatures (Th) from ERA5
using the regression
where [·] denotes a smooth tensor product parameterized by a vector of estimated coefficients, θ, and uh is a
random disturbance term. We set the maximum lag length, ℓ, to six hours to capture the effects of unobserved
heat fluxes in the built environment and the thermal properties of buildings and ­
structures56
. (See SI: Methods
and Data for a detailed explanation of the theoretical basis for lag structures in building energy use.) Statistical
(1)
ln Lh = �[Th, Th−1, . . . , Th−ℓ; θ] + controls + uh
12
Vol:.(1234567890)
Scientific Reports | (2022) 12:4280 | https://doi.org/10.1038/s41598-022-07922-w
www.nature.com/scientificreports/
controls include meteorological predictors of built environment heat transport and thermal performance (ERA5
hourly downward solar radiation, dew point temperature, and wind speed), as well as parsimonious proxies for
unobserved non-meteorological determinants of demand (including a smooth function for time and a categorical
year dummy that captures the energy consumption impacts of households’ and firms’ routines on various time
scales). The fitted response, 
 = [·; 
θ], exhibits its lowest point at the “set point” temperature, T∗, at which
weather-sensitive electricity consumption is minimized, L∗. Following from results ­
in30,42
, we offset 
 by the
amount min(ln L(T))for10 ◦C ≤ T ≤ 30 ◦C. This allows us to interpret 
 as the fractional increase in electricity
demand above L∗ per ◦
C ambient temperature above or belowT∗. For most cities,  is approximately linear on
either side ofT∗ (Fig. 2)18
, which allows us to represent the average slopes of the responses as the parameters βC
and βH forT  T∗ and/orT  T∗, respectively.
Hourly temperature projections. Projections of current and future electric load utilize daily maximum
and minimum temperatures simulated by 21 GCMs from the NASA NEX-GDDP for RCPs 4.5 and 8.5 scenarios.
We use ERA5 observed temperatures to estimate the hourly pattern corresponding to diurnal extrema,TMax
d and
TMin
d , where d indexes the day of year. We assume a stable relationship between hourly temperatures and daily
extremes, representingTh as the convex combination of the maximum and minimum:
in which the hour-specific weight, ωh, is to be determined. Our empirical implementation of this approach is
the linear regression
where v is a Gaussian error term. Equation (3) is estimated separately for each hour of the day for individual
months, to fully account for interannual variation in climate. The fitted values of the weights, 
ωh, are then used to
temporally downscale NEX-GDDP daily temperature extremes (TMin,k
d andTMax,k
d , where k ∈ {Current, Future}
is an index of current (2006–2020) and future (2045–2059) periods). The result is the synthetic hourly tempera-
ture series:
We then apply the delta correction ­
technique57
: taking the difference in the period-means of synthetic tempera-
ture at each hour of the year (
Tk
h,d), and adding the result to the mean of the temperature at each hour of the
year in the current period from ERA5(Th),yields our estimate of average hourly temperature under warming:
Climate change impacts. Our primary metric of the impact of climate change on hourly electricity
demand is
the results of which are summarized in Figs. 4 and 5. We sum the average hourly per capita impact over all
hours and scale the result by future population in the SSP3 and SSP5 scenarios to project impacts on annual
total electricity demand (Table 1).
Transforming our hourly temperature series into the distribution, H(T), which denotes the count of hours
over the year in each1 ◦C bin of temperature, the total annual demand for electricity over cold and hot hours
can be expressed as:
Our second impact metric decomposes the effect of climate change on the fractional change in total electricity
demand for hours above and belowT∗:
The first right-hand side term captures the effect of the structure of electricity demand—the percentage increase
in demand from an additional hour, dependent on the magnitude of the slope of the response. The second term
captures the effect of the change in exposure due to the shift in the temperature distribution—the demand-
weighted average percentage change in hours. These two effects are summarized in Fig. 3, Panels c and d.
(2)
Th,d = ωhTMax
d + (1 − ωh)TMin
d
(3)
Th,d − TMin
d = ωh(TMax
d − TMin
d ) + vd
(4)
Tk
h,d = 
ωhTMax,k
d + (1 − 
ωh)TMin,k
d
(5)

Th,d = (T
Future
h,d − T
Current
h,d ) + Th
(6)
Ih,d = L∗
× (exp 
�[
Th,d] − exp [
�[Th,d])
Q|TT∗ ≈

T
L∗
exp{βC(T∗
− T)H(T)} and Q|TT∗ ≈

T
L∗
exp{βH(T − T∗
)H(T)}.
(7)
1
Q|TT∗
∂Q|TT∗
∂T
≈ βC +

T

L∗ exp{βC(T∗ − T)}

T L∗ exp{βC(T∗ − T)H(T)}

·

1
H(T)
∂H(T)
∂T

(8)
1
Q|TT∗
∂Q|TT∗
∂T
≈ βH +

T

L∗ exp{βH(T − T∗)}

T L∗ exp{βH(T − T∗)H(T)}

·

1
H(T)
∂H(T)
∂T
13
Vol.:(0123456789)
Scientific Reports | (2022) 12:4280 | https://doi.org/10.1038/s41598-022-07922-w
www.nature.com/scientificreports/
Data availability
The data generated during our analyses and supporting the findings of this paper are available from the corre-
sponding author upon reasonable request. The input data used in this analysis are publicly available at the follow-
ing: urban energy demand data: https://​github.​com/​Ecohe​n4/​Energy, other sources listed in Table S7. ECMWF
ERA5 reanalysis data: https://​www.​ecmwf.​int/​en/​forec​asts/​datas​ets/​reana​lysis-​datas​ets/​era5. NASA-NEX climate
data: https://​cds.​nccs.​nasa.​gov/​nex-​gddp/. Population data: listed in Table S8. Spatial population projections for
the SSPs: https://​www.​cgd.​ucar.​edu/​iam/​model​ing/​spati​al-​popul​ation-​scena​rios.​html.
Received: 17 September 2021; Accepted: 28 February 2022
References
1. Vahmani, P., Jones, A. D.  Patricola, C. M. Interacting implications of climate change, population dynamics, and urban heat
mitigation for future exposure to heat extremes. Environ. Res. Lett. 14, 084051 (2019).
2. Sera, F. et al. How urban characteristics affect vulnerability to heat and cold: A multi-country analysis. Int. J. Epidemiol. 48,
1101–1112 (2019).
3. Barreca, A., Clay, K., Deschenes, O., Greenstone, M.  Shapiro, J. S. Adapting to climate change: The remarkable decline in the US
temperature-mortality relationship over the twentieth century. J. Polit. Econ. 124, 105–159. https://​doi.​org/​10.​1086/​684582 (2016).
4. Gasparrini, A. et al. Mortality risk attributable to high and low ambient temperature: A multicountry observational study. Lancet
386, 369–375. https://​doi.​org/​10.​1016/​S0140-​6736(14)​62114-0 (2015).
5. Maia-Silva, D., Kumar, R.  Nateghi, R. The critical role of humidity in modeling summer electricity demand across the United
States. Nat. Commun. 11, 1686. https://​doi.​org/​10.​1038/​s41467-​020-​15393-8 (2020).
6. Kumar, R., Rachunok, B., Maia-Silva, D.  Nateghi, R. Asymmetrical response of California electricity demand to summer-time
temperature variation. Sci. Rep. 10, 10904. https://​doi.​org/​10.​1038/​s41598-​020-​67695-y (2020).
7. Randazzo, T., De Cian, E.  Mistry, M. N. Air conditioning and electricity expenditure: The role of climate in temperate countries.
Econ. Model. 90, 273–287. https://​doi.​org/​10.​1016/j.​econm​od.​2020.​05.​001 (2020).
8. Bruckner, T. Energy Systems, book section 7 (Cambridge University Press, Cambridge, 2014).
9. Ranson, M., Morris, L.  Kats-Rubin, A. Climate Change and Space Heating Energy Demand: A Review of the Literature (Tech. Rep,
National Center for Environmental Economics (NCEE), 2014).
10. van Ruijven, B. J., De Cian, E.  Sue Wing, I. Amplification of future energy demand growth due to climate change. Nat. Commun.
10, 2762. https://​doi.​org/​10.​1038/​s41467-​019-​10399-3 (2019).
11. De Cian, E.  Wing, I. S. Global energy consumption in a warming climate. Environ. Resource Econ. 72, 365–410 (2019).
12. Jones, B. et al. Future population exposure to US heat extremes. Nat. Clim. Change 5, 652–655. https://​doi.​org/​10.​1038/​nclim​ate26​
31 (2015).
13. De Cian, E., Lanzi, E.  Roson, R. Seasonal temperature variations and energy demand. Clim. Change 116, 805–825. https://​doi.​
org/​10.​1007/​s10584-​012-​0514-5 (2013).
14. Fazeli, R., Ruth, M.  Davidsdottir, B. Temperature response functions for residential energy demand—A review of models. Urban
Clim. 15, 45–59. https://​doi.​org/​10.​1016/j.​uclim.​2016.​01.​001 (2016).
15. Lu, N. et al. Climate Change Impacts on Residential and Commercial Loads in the Western U.S. Grid. IEEE Trans. Power Syst. 25,
480–488. https://​doi.​org/​10.​1109/​TPWRS.​2009.​20303​87 (2010).
16. Santamouris, M., Cartalis, C., Synnefa, A.  Kolokotsa, D. On the impact of urban heat island and global warming on the power
demand and electricity consumption of buildings-A review. Energy Build. 98, 119–124. https://​doi.​org/​10.​1016/j.​enbui​ld.​2014.​09.​
052 (2015).
17. Damm, A., Köberl, J., Prettenthaler, F., Rogler, N.  Töglhofer, C. Impacts of+ 2 c global warming on electricity demand in Europe.
Clim. Serv. 7, 12–30 (2017).
18. Auffhammer, M., Baylis, P.  Hausman, C. H. Climate change is projected to have severe impacts on the frequency and intensity
of peak electricity demand across the United States. PNAS 114, 1886–1891. https://​doi.​org/​10.​1073/​pnas.​16131​93114 (2017).
19. Moral-Carcedo, J.  Pérez-García, J. Time of day effects of temperature and daylight on short term electricity load. Energy 174,
169–183. https://​doi.​org/​10.​1016/j.​energy.​2019.​02.​158 (2019).
20. Bird, D. N. et al. Estimating the daily peak and annual total electricity demand for cooling in Vienna, Austria by 2050. Urban Clim.
28, 100452. https://​doi.​org/​10.​1016/j.​uclim.​2019.​100452 (2019).
21. Petri, Y.  Caldeira, K. Impacts of global warming on residential heating and cooling degree-days in the United States. Sci. Rep.
5, 12427. https://​doi.​org/​10.​1038/​srep1​2427 (2015).
22. Coffel, E. D., Horton, R. M.  Sherbinin, Ad. Temperature and humidity based projections of a rapid rise in global heat stress
exposure during the 21st century. Environ. Res. Lett. 13, 014001. https://​doi.​org/​10.​1088/​1748-​9326/​aaa00e (2017).
23. Grotjahn, R.  Huynh, J. Contiguous US summer maximum temperature and heat stress trends in CRU and NOAA Climate
Division data plus comparisons to reanalyses. Sci. Rep. 8, 11146. https://​doi.​org/​10.​1038/​s41598-​018-​29286-w (2018).
24. Kusaka, H., Hara, M.  Takane, Y. Urban Climate Projection by the WRF Model at 3-km Horizontal Grid Increment: Dynamical
Downscaling and Predicting Heat Stress in the 2070’s August for Tokyo, Osaka, and Nagoya Metropolises. J. Meteorol. Soc. Jpn
90B, 47–63. https://​doi.​org/​10.​2151/​jmsj.​2012-​B04 (2012).
25. Lyon, B., Barnston, A. G., Coffel, E.  Horton, R. M. Projected increase in the spatial extent of contiguous US summer heat waves
and associated attributes. Environ. Res. Lett. 14, 114029. https://​doi.​org/​10.​1088/​1748-​9326/​ab4b41 (2019).
26. Bloomfield, H.  Brayshaw, D. Future climate projections of surface weather variables, wind power, and solar power capacity
factors across north-west Europe (2021).
27. Michel, A., Sharma, V., Lehning, M.  Huwald, H. Climate change scenarios at hourly time-step over Switzerland from an enhanced
temporal downscaling approach. Int. J. Climatol. 41, 3503–3522 (2021).
28. Hyndman, R. J.  Fan, S. Monash electricity forecasting model (Monash University, 2015).
29. Gasparrini, A. Modelling lagged associations in environmental time series data: A simulation study. Epidemiology 27, 835–842.
https://​doi.​org/​10.​1097/​EDE.​00000​00000​000533 (2016).
30. Wenz, L., Levermann, A.  Auffhammer, M. North-south polarization of European electricity consumption under future warming.
PNAShttps://​doi.​org/​10.​1073/​pnas.​17043​39114 (2017).
31. Ortiz, L., González, J. E.  Lin, W. Climate change impacts on peak building cooling energy demand in a coastal megacity. Environ.
Res. Lett. 13, 094008. https://​doi.​org/​10.​1088/​1748-​9326/​aad8d0 (2018).
32. C3S, C. C. C. S. ERA5: Fifth generation of ECMWF atmospheric reanalyses of the global climate. Copernicus Climate Change
Service Climate Data Store (CDS) (2017).
33. Engle, R. F., Granger, C. W., Rice, J.  Weiss, A. Semiparametric estimates of the relation between weather and electricity sales. J.
Am. Stat. Assoc. 81, 310–320 (1986).
34. Indonesia, P. Power in Indonesia 2017 (Tech. Rep, PwC Indonesia, 2017).
14
Vol:.(1234567890)
Scientific Reports | (2022) 12:4280 | https://doi.org/10.1038/s41598-022-07922-w
www.nature.com/scientificreports/
35. O’Neill, B. C. et al. A new scenario framework for climate change research: The concept of shared socioeconomic pathways. Clim.
Change 122, 387–400. https://​doi.​org/​10.​1007/​s10584-​013-​0905-2 (2014).
36. O’Neill, B. C. et al. The roads ahead: Narratives for shared socioeconomic pathways describing world futures in the 21st century.
Glob. Environ. Chang. 42, 169–180. https://​doi.​org/​10.​1016/j.​gloen​vcha.​2015.​01.​004 (2017).
37. McFarland, J. Impacts of rising air temperatures and emissions mitigation on electricity demand and supply in the United States:
A multi-model comparison. Clim. Change 131, 111–125. https://​doi.​org/​10.​1007/​s10584-​015-​1380-8 (2015).
38. Sullivan, P., Colman, J.  Kalendra, E. Predicting the Response of Electricity Load to Climate Change. Tech. Rep. NREL/TP–6A20-
64297, 1215283, National Renewable Energy Laboratory (NREL) (2015). https://​doi.​org/​10.​2172/​12152​83.
39. Bartos, M. et al. Impacts of rising air temperatures on electric transmission ampacity and peak electricity load in the united states.
Environ. Res. Lett. 11, 114008 (2016).
40. Deschênes, O.  Greenstone, M. Climate change, mortality, and adaptation: Evidence from annual fluctuations in weather in the
us. Am. Econ. J. Appl. Econ. 3, 152–85 (2011).
41. Auffhammer, M.  Aroonruengsawat, A. Simulating the impacts of climate change, prices and population on California’s residential
electricity consumption. Clim. Change 109, 191–210. https://​doi.​org/​10.​1007/​s10584-​011-​0299-y (2011).
42. Waite, M. et al. Global trends in urban electricity demands for cooling and heating. Energy 127, 786–802 (2017).
43. Ralston Fonseca, F., Jaramillo, P., Bergés, M.  Severnini, E. Seasonal effects of climate change on intra-day electricity demand
patterns. Clim. Change 154, 435–451. https://​doi.​org/​10.​1007/​s10584-​019-​02413-w (2019).
44. Gupta, E. Global warming and electricity demand in the rapidly growing city of Delhi: A semi-parametric variable coefficient
approach. Energy Econ. 34, 1407–1421. https://​doi.​org/​10.​1016/j.​eneco.​2012.​04.​014 (2012).
45. Andrijevic, M., Cuaresma, J. C., Muttarak, R.  Schleussner, C.-F. Governance in socioeconomic pathways and its role for future
adaptive capacity. Nat. Sustain. 3, 35–41 (2020).
46. Falchetta, G.  Mistry, M. N. The role of residential air circulation and cooling demand for electrification planning: implications
of climate change in sub-Saharan Africa. Energy Econ. 99, 105307 (2021).
47. Auffhammer, M.  Mansur, E. T. Measuring climatic impacts on energy consumption: A review of the empirical literature. Energy
Econ. 46, 522–530. https://​doi.​org/​10.​1016/j.​eneco.​2014.​04.​017 (2014).
48. Davis, L. W.  Gertler, P. J. Contribution of air conditioning adoption to future energy use under global warming. PNAS 112,
5962–5967. https://​doi.​org/​10.​1073/​pnas.​14235​58112 (2015).
49. Cohen, E., Modi, V., Torbey, H., Piccirelli, M.  Yu-Tian. Global trends in urban energy use. GitHub Repository (2015).
50. Thrasher, B., Maurer, E. P., McKellar, C.  Duffy, P. B. Technical Note: Bias correcting climate model simulated daily temperature
extremes with quantile mapping. Hydrol. Earth Syst. Sci. 16, 3309–3314. https://​doi.​org/​10.​5194/​hess-​16-​3309-​2012 (2012).
51. Taylor, K. E., Stouffer, R. J.  Meehl, G. A. An overview of CMIP5 and the experiment design. Bull. Am. Meteor. Soc. 93, 485–498.
https://​doi.​org/​10.​1175/​BAMS-D-​11-​00094.1 (2012).
52. Bureau of Economic Analysis, U. S. Personal income, population, per capita personal income (cainc1) (2020).
53. United Nations, D. o. E.  Social Affairs, P. D. World urbanization prospects: The 2018 revision. Tech. Rep., UN DESA (2019).
54. Jones, B.  O’Neill, B. C. Spatially explicit global population scenarios consistent with the shared socioeconomic pathways. Environ.
Res. Lett. 11, 084003 (2016).
55. Wood, S. mgcv: Mixed gam computation vehicle with gcv/aic/reml smoothness estimation (2012).
56. Oke, T. R., Mills, G., Christen, A.  Voogt, J. A. Urban climates (Cambridge University Press, 2017).
57. Maraun, D. Bias correcting climate change simulations—a critical review. Curr. Clim. Change Rep. 2, 211–220 (2016).
Acknowledgements
This work was supported by the Frederick S. Pardee Center for the Study of the Longer-Range Future, the Boston
University Initiative on Cities, and National Science Foundation Research Traineeship (NRT) Grant No. DGE
1735087 (Y.R.), and by the U.S. Department of Energy, Office of Science, Biological and Environmental Research
Program, Earth and Environmental Systems Modeling, MultiSector Dynamics, Contract No. DE-SC0016162
(I.S.W. and Y.R.).
Author contributions
I.S.W. and Y.R. conceived the research objectives. I.S.W. formulated the model for estimation. Data collection,
results generation, and analyses were conducted by Y.R. I.S.W. reviewed results and analyses. Both authors
reviewed and edited the manuscript.
Competing interests
The authors declare no competing interests.
Additional information
Supplementary Information The online version contains supplementary material available at https://​doi.​org/​
10.​1038/​s41598-​022-​07922-w.
Correspondence and requests for materials should be addressed to Y.R.
Reprints and permissions information is available at www.nature.com/reprints.
Publisher’s note Springer Nature remains neutral with regard to jurisdictional claims in published maps and
institutional affiliations.
Open Access This article is licensed under a Creative Commons Attribution 4.0 International
License, which permits use, sharing, adaptation, distribution and reproduction in any medium or
format, as long as you give appropriate credit to the original author(s) and the source, provide a link to the
Creative Commons licence, and indicate if changes were made. The images or other third party material in this
article are included in the article’s Creative Commons licence, unless indicated otherwise in a credit line to the
material. If material is not included in the article’s Creative Commons licence and your intended use is not
permitted by statutory regulation or exceeds the permitted use, you will need to obtain permission directly from
the copyright holder. To view a copy of this licence, visit http://​creat​iveco​mmons.​org/​licen​ses/​by/4.​0/.
© The Author(s) 2022, corrected publication 2022

More Related Content

Similar to s41598-022-07922-w.pdf

Civil Engineering and Urban Planning: An International Journal (CiVEJ)
Civil Engineering and Urban Planning: An International Journal (CiVEJ)Civil Engineering and Urban Planning: An International Journal (CiVEJ)
Civil Engineering and Urban Planning: An International Journal (CiVEJ)civejjour
 
REVIEW OF THE URBAN HEAT ISLAND PHENOMENON ANALYSIS AS AN ADAPTATION TO CLIMA...
REVIEW OF THE URBAN HEAT ISLAND PHENOMENON ANALYSIS AS AN ADAPTATION TO CLIMA...REVIEW OF THE URBAN HEAT ISLAND PHENOMENON ANALYSIS AS AN ADAPTATION TO CLIMA...
REVIEW OF THE URBAN HEAT ISLAND PHENOMENON ANALYSIS AS AN ADAPTATION TO CLIMA...civej
 
Mark Jacobson Study in Energy & Environment Science : 145 countries on low co...
Mark Jacobson Study in Energy & Environment Science : 145 countries on low co...Mark Jacobson Study in Energy & Environment Science : 145 countries on low co...
Mark Jacobson Study in Energy & Environment Science : 145 countries on low co...Energy for One World
 
scopus publications.pdf
scopus publications.pdfscopus publications.pdf
scopus publications.pdfnareshkotra
 
best publications28.pdf
best publications28.pdfbest publications28.pdf
best publications28.pdfnareshkotra
 
UGC care journals.pdf
UGC care journals.pdfUGC care journals.pdf
UGC care journals.pdfnareshkotra
 
international research journal of engineering and technology 3 nov.pdf
international research journal of engineering and technology 3 nov.pdfinternational research journal of engineering and technology 3 nov.pdf
international research journal of engineering and technology 3 nov.pdfnareshkotra
 
Power system operation considering detailed modelling of the natural gas supp...
Power system operation considering detailed modelling of the natural gas supp...Power system operation considering detailed modelling of the natural gas supp...
Power system operation considering detailed modelling of the natural gas supp...IJECEIAES
 
Load Shifting Assessment of Residential Heat Pump System in Japan
Load Shifting Assessment of Residential Heat Pump System in JapanLoad Shifting Assessment of Residential Heat Pump System in Japan
Load Shifting Assessment of Residential Heat Pump System in JapanIEREK Press
 
Load Shifting Assessment of Residential Heat Pump System in Japan
Load Shifting Assessment of Residential Heat Pump System in JapanLoad Shifting Assessment of Residential Heat Pump System in Japan
Load Shifting Assessment of Residential Heat Pump System in JapanIEREK Press
 
The Calculation Method of Heating and Cooling Energy Saving Potential in Urba...
The Calculation Method of Heating and Cooling Energy Saving Potential in Urba...The Calculation Method of Heating and Cooling Energy Saving Potential in Urba...
The Calculation Method of Heating and Cooling Energy Saving Potential in Urba...Beniamino Murgante
 
Human Habits and Energy Consumption in Residential Buildings
Human Habits and Energy Consumption in Residential BuildingsHuman Habits and Energy Consumption in Residential Buildings
Human Habits and Energy Consumption in Residential BuildingsLeonardo ENERGY
 
Global electricity network – Feasibility study
Global electricity network – Feasibility studyGlobal electricity network – Feasibility study
Global electricity network – Feasibility studyPower System Operation
 
Analysis of the electricity consumption in the south east geopolitical regi...
Analysis of the electricity consumption in the south   east geopolitical regi...Analysis of the electricity consumption in the south   east geopolitical regi...
Analysis of the electricity consumption in the south east geopolitical regi...Alexander Decker
 
Electricity and Climate Change
Electricity and Climate ChangeElectricity and Climate Change
Electricity and Climate ChangeRavenskirk Llp
 
Call for Papers- Special Issue: Recent Trends, Innovations and Sustainable So...
Call for Papers- Special Issue: Recent Trends, Innovations and Sustainable So...Call for Papers- Special Issue: Recent Trends, Innovations and Sustainable So...
Call for Papers- Special Issue: Recent Trends, Innovations and Sustainable So...Christo Ananth
 
Climate change-implications-for-the-energy-sector-summary-from-ipcc-ar5-2014-...
Climate change-implications-for-the-energy-sector-summary-from-ipcc-ar5-2014-...Climate change-implications-for-the-energy-sector-summary-from-ipcc-ar5-2014-...
Climate change-implications-for-the-energy-sector-summary-from-ipcc-ar5-2014-...Hossam Zein
 
Feasibility evaluation of two solar cooling systems applied to a cuban
Feasibility evaluation of two solar cooling systems applied to a cubanFeasibility evaluation of two solar cooling systems applied to a cuban
Feasibility evaluation of two solar cooling systems applied to a cubanyamile diaz torres
 
Climate Change Adaptative Retrofit Strategy For Buildings In Hot-Humid Climat...
Climate Change Adaptative Retrofit Strategy For Buildings In Hot-Humid Climat...Climate Change Adaptative Retrofit Strategy For Buildings In Hot-Humid Climat...
Climate Change Adaptative Retrofit Strategy For Buildings In Hot-Humid Climat...Sara Martins Batista
 

Similar to s41598-022-07922-w.pdf (20)

Civil Engineering and Urban Planning: An International Journal (CiVEJ)
Civil Engineering and Urban Planning: An International Journal (CiVEJ)Civil Engineering and Urban Planning: An International Journal (CiVEJ)
Civil Engineering and Urban Planning: An International Journal (CiVEJ)
 
REVIEW OF THE URBAN HEAT ISLAND PHENOMENON ANALYSIS AS AN ADAPTATION TO CLIMA...
REVIEW OF THE URBAN HEAT ISLAND PHENOMENON ANALYSIS AS AN ADAPTATION TO CLIMA...REVIEW OF THE URBAN HEAT ISLAND PHENOMENON ANALYSIS AS AN ADAPTATION TO CLIMA...
REVIEW OF THE URBAN HEAT ISLAND PHENOMENON ANALYSIS AS AN ADAPTATION TO CLIMA...
 
Mark Jacobson Study in Energy & Environment Science : 145 countries on low co...
Mark Jacobson Study in Energy & Environment Science : 145 countries on low co...Mark Jacobson Study in Energy & Environment Science : 145 countries on low co...
Mark Jacobson Study in Energy & Environment Science : 145 countries on low co...
 
scopus publications.pdf
scopus publications.pdfscopus publications.pdf
scopus publications.pdf
 
best publications28.pdf
best publications28.pdfbest publications28.pdf
best publications28.pdf
 
UGC care journals.pdf
UGC care journals.pdfUGC care journals.pdf
UGC care journals.pdf
 
international research journal of engineering and technology 3 nov.pdf
international research journal of engineering and technology 3 nov.pdfinternational research journal of engineering and technology 3 nov.pdf
international research journal of engineering and technology 3 nov.pdf
 
Power system operation considering detailed modelling of the natural gas supp...
Power system operation considering detailed modelling of the natural gas supp...Power system operation considering detailed modelling of the natural gas supp...
Power system operation considering detailed modelling of the natural gas supp...
 
Load Shifting Assessment of Residential Heat Pump System in Japan
Load Shifting Assessment of Residential Heat Pump System in JapanLoad Shifting Assessment of Residential Heat Pump System in Japan
Load Shifting Assessment of Residential Heat Pump System in Japan
 
Load Shifting Assessment of Residential Heat Pump System in Japan
Load Shifting Assessment of Residential Heat Pump System in JapanLoad Shifting Assessment of Residential Heat Pump System in Japan
Load Shifting Assessment of Residential Heat Pump System in Japan
 
The Calculation Method of Heating and Cooling Energy Saving Potential in Urba...
The Calculation Method of Heating and Cooling Energy Saving Potential in Urba...The Calculation Method of Heating and Cooling Energy Saving Potential in Urba...
The Calculation Method of Heating and Cooling Energy Saving Potential in Urba...
 
Human Habits and Energy Consumption in Residential Buildings
Human Habits and Energy Consumption in Residential BuildingsHuman Habits and Energy Consumption in Residential Buildings
Human Habits and Energy Consumption in Residential Buildings
 
Global electricity network – Feasibility study
Global electricity network – Feasibility studyGlobal electricity network – Feasibility study
Global electricity network – Feasibility study
 
Analysis of the electricity consumption in the south east geopolitical regi...
Analysis of the electricity consumption in the south   east geopolitical regi...Analysis of the electricity consumption in the south   east geopolitical regi...
Analysis of the electricity consumption in the south east geopolitical regi...
 
Electricity and Climate Change
Electricity and Climate ChangeElectricity and Climate Change
Electricity and Climate Change
 
BP Energy Outlook 2023
BP Energy Outlook 2023BP Energy Outlook 2023
BP Energy Outlook 2023
 
Call for Papers- Special Issue: Recent Trends, Innovations and Sustainable So...
Call for Papers- Special Issue: Recent Trends, Innovations and Sustainable So...Call for Papers- Special Issue: Recent Trends, Innovations and Sustainable So...
Call for Papers- Special Issue: Recent Trends, Innovations and Sustainable So...
 
Climate change-implications-for-the-energy-sector-summary-from-ipcc-ar5-2014-...
Climate change-implications-for-the-energy-sector-summary-from-ipcc-ar5-2014-...Climate change-implications-for-the-energy-sector-summary-from-ipcc-ar5-2014-...
Climate change-implications-for-the-energy-sector-summary-from-ipcc-ar5-2014-...
 
Feasibility evaluation of two solar cooling systems applied to a cuban
Feasibility evaluation of two solar cooling systems applied to a cubanFeasibility evaluation of two solar cooling systems applied to a cuban
Feasibility evaluation of two solar cooling systems applied to a cuban
 
Climate Change Adaptative Retrofit Strategy For Buildings In Hot-Humid Climat...
Climate Change Adaptative Retrofit Strategy For Buildings In Hot-Humid Climat...Climate Change Adaptative Retrofit Strategy For Buildings In Hot-Humid Climat...
Climate Change Adaptative Retrofit Strategy For Buildings In Hot-Humid Climat...
 

Recently uploaded

Call Girls In Naraina (Delhi) +91-9667422720 Escorts Service
Call Girls In Naraina (Delhi) +91-9667422720 Escorts ServiceCall Girls In Naraina (Delhi) +91-9667422720 Escorts Service
Call Girls In Naraina (Delhi) +91-9667422720 Escorts ServiceLipikasharma29
 
NASHIK CALL GIRL 92628*71154 NASHIK CALL
NASHIK CALL GIRL 92628*71154 NASHIK CALLNASHIK CALL GIRL 92628*71154 NASHIK CALL
NASHIK CALL GIRL 92628*71154 NASHIK CALLNiteshKumar82226
 
Call US Pooja📞 9892124323 ✅Call Girls In Mira Road ( Mumbai ) secure service...
Call US  Pooja📞 9892124323 ✅Call Girls In Mira Road ( Mumbai ) secure service...Call US  Pooja📞 9892124323 ✅Call Girls In Mira Road ( Mumbai ) secure service...
Call US Pooja📞 9892124323 ✅Call Girls In Mira Road ( Mumbai ) secure service...Pooja Nehwal
 
Call Now ☎9870417354|| Call Girls in Dwarka Escort Service Delhi N.C.R.
Call Now ☎9870417354|| Call Girls in Dwarka Escort Service Delhi N.C.R.Call Now ☎9870417354|| Call Girls in Dwarka Escort Service Delhi N.C.R.
Call Now ☎9870417354|| Call Girls in Dwarka Escort Service Delhi N.C.R.riyadelhic riyadelhic
 
Call Girls In {Laxmi Nagar Delhi} 9667938988 Indian Russian High Profile Girl...
Call Girls In {Laxmi Nagar Delhi} 9667938988 Indian Russian High Profile Girl...Call Girls In {Laxmi Nagar Delhi} 9667938988 Indian Russian High Profile Girl...
Call Girls In {Laxmi Nagar Delhi} 9667938988 Indian Russian High Profile Girl...aakahthapa70
 
BHOPAL CALL GIRL 92628*71154 BHOPAL CALL
BHOPAL CALL GIRL 92628*71154 BHOPAL CALLBHOPAL CALL GIRL 92628*71154 BHOPAL CALL
BHOPAL CALL GIRL 92628*71154 BHOPAL CALLNiteshKumar82226
 
Call Girls in Majnu ka Tilla Delhi 💯 Call Us 🔝9711014705🔝
Call Girls in Majnu ka Tilla Delhi 💯 Call Us 🔝9711014705🔝Call Girls in Majnu ka Tilla Delhi 💯 Call Us 🔝9711014705🔝
Call Girls in Majnu ka Tilla Delhi 💯 Call Us 🔝9711014705🔝thapagita
 
9811611494,Low Rate Call Girls In Connaught Place Delhi 24hrs Available
9811611494,Low Rate Call Girls In Connaught Place Delhi 24hrs Available9811611494,Low Rate Call Girls In Connaught Place Delhi 24hrs Available
9811611494,Low Rate Call Girls In Connaught Place Delhi 24hrs Availablenitugupta1209
 
Call Girls In {{Laxmi Nagar Delhi}} 9667938988 Indian Russian High Profile Es...
Call Girls In {{Laxmi Nagar Delhi}} 9667938988 Indian Russian High Profile Es...Call Girls In {{Laxmi Nagar Delhi}} 9667938988 Indian Russian High Profile Es...
Call Girls In {{Laxmi Nagar Delhi}} 9667938988 Indian Russian High Profile Es...aakahthapa70
 
Call Girls In {{Connaught Place Delhi}}96679@38988 Indian Russian High Profil...
Call Girls In {{Connaught Place Delhi}}96679@38988 Indian Russian High Profil...Call Girls In {{Connaught Place Delhi}}96679@38988 Indian Russian High Profil...
Call Girls In {{Connaught Place Delhi}}96679@38988 Indian Russian High Profil...aakahthapa70
 
RAJKOT CALL GIRLS 92628/71154 RAJKOT CAL
RAJKOT CALL GIRLS 92628/71154 RAJKOT CALRAJKOT CALL GIRLS 92628/71154 RAJKOT CAL
RAJKOT CALL GIRLS 92628/71154 RAJKOT CALNiteshKumar82226
 
NAGPUR CALL GIRL 92628*71154 NAGPUR CALL
NAGPUR CALL GIRL 92628*71154 NAGPUR CALLNAGPUR CALL GIRL 92628*71154 NAGPUR CALL
NAGPUR CALL GIRL 92628*71154 NAGPUR CALLNiteshKumar82226
 
Call Girls In {Green Park Delhi} 9667938988 Indian Russian High Profile Girls...
Call Girls In {Green Park Delhi} 9667938988 Indian Russian High Profile Girls...Call Girls In {Green Park Delhi} 9667938988 Indian Russian High Profile Girls...
Call Girls In {Green Park Delhi} 9667938988 Indian Russian High Profile Girls...aakahthapa70
 
SURAT CALL GIRL 92628/71154 SURAT CALL G
SURAT CALL GIRL 92628/71154 SURAT CALL GSURAT CALL GIRL 92628/71154 SURAT CALL G
SURAT CALL GIRL 92628/71154 SURAT CALL GNiteshKumar82226
 
Best VIP Call Girls Noida Sector 24 Call Me: 8700611579
Best VIP Call Girls Noida Sector 24 Call Me: 8700611579Best VIP Call Girls Noida Sector 24 Call Me: 8700611579
Best VIP Call Girls Noida Sector 24 Call Me: 8700611579diyaspanoida
 
Call Girls In {Laxmi Nagar Delhi} 9667938988 Indian Russian High Profile Girl...
Call Girls In {Laxmi Nagar Delhi} 9667938988 Indian Russian High Profile Girl...Call Girls In {Laxmi Nagar Delhi} 9667938988 Indian Russian High Profile Girl...
Call Girls In {Laxmi Nagar Delhi} 9667938988 Indian Russian High Profile Girl...aakahthapa70
 
Best VIP Call Girls Noida Sector 23 Call Me: 8700611579
Best VIP Call Girls Noida Sector 23 Call Me: 8700611579Best VIP Call Girls Noida Sector 23 Call Me: 8700611579
Best VIP Call Girls Noida Sector 23 Call Me: 8700611579diyaspanoida
 

Recently uploaded (20)

Call Girls In Naraina (Delhi) +91-9667422720 Escorts Service
Call Girls In Naraina (Delhi) +91-9667422720 Escorts ServiceCall Girls In Naraina (Delhi) +91-9667422720 Escorts Service
Call Girls In Naraina (Delhi) +91-9667422720 Escorts Service
 
NASHIK CALL GIRL 92628*71154 NASHIK CALL
NASHIK CALL GIRL 92628*71154 NASHIK CALLNASHIK CALL GIRL 92628*71154 NASHIK CALL
NASHIK CALL GIRL 92628*71154 NASHIK CALL
 
9953056974 Call Girls In Ashok Nagar, Escorts (Delhi) NCR.
9953056974 Call Girls In Ashok Nagar, Escorts (Delhi) NCR.9953056974 Call Girls In Ashok Nagar, Escorts (Delhi) NCR.
9953056974 Call Girls In Ashok Nagar, Escorts (Delhi) NCR.
 
Call US Pooja📞 9892124323 ✅Call Girls In Mira Road ( Mumbai ) secure service...
Call US  Pooja📞 9892124323 ✅Call Girls In Mira Road ( Mumbai ) secure service...Call US  Pooja📞 9892124323 ✅Call Girls In Mira Road ( Mumbai ) secure service...
Call US Pooja📞 9892124323 ✅Call Girls In Mira Road ( Mumbai ) secure service...
 
Call Now ☎9870417354|| Call Girls in Dwarka Escort Service Delhi N.C.R.
Call Now ☎9870417354|| Call Girls in Dwarka Escort Service Delhi N.C.R.Call Now ☎9870417354|| Call Girls in Dwarka Escort Service Delhi N.C.R.
Call Now ☎9870417354|| Call Girls in Dwarka Escort Service Delhi N.C.R.
 
Call Girls In {Laxmi Nagar Delhi} 9667938988 Indian Russian High Profile Girl...
Call Girls In {Laxmi Nagar Delhi} 9667938988 Indian Russian High Profile Girl...Call Girls In {Laxmi Nagar Delhi} 9667938988 Indian Russian High Profile Girl...
Call Girls In {Laxmi Nagar Delhi} 9667938988 Indian Russian High Profile Girl...
 
BHOPAL CALL GIRL 92628*71154 BHOPAL CALL
BHOPAL CALL GIRL 92628*71154 BHOPAL CALLBHOPAL CALL GIRL 92628*71154 BHOPAL CALL
BHOPAL CALL GIRL 92628*71154 BHOPAL CALL
 
Call Girls in Majnu ka Tilla Delhi 💯 Call Us 🔝9711014705🔝
Call Girls in Majnu ka Tilla Delhi 💯 Call Us 🔝9711014705🔝Call Girls in Majnu ka Tilla Delhi 💯 Call Us 🔝9711014705🔝
Call Girls in Majnu ka Tilla Delhi 💯 Call Us 🔝9711014705🔝
 
9811611494,Low Rate Call Girls In Connaught Place Delhi 24hrs Available
9811611494,Low Rate Call Girls In Connaught Place Delhi 24hrs Available9811611494,Low Rate Call Girls In Connaught Place Delhi 24hrs Available
9811611494,Low Rate Call Girls In Connaught Place Delhi 24hrs Available
 
Call Girls In {{Laxmi Nagar Delhi}} 9667938988 Indian Russian High Profile Es...
Call Girls In {{Laxmi Nagar Delhi}} 9667938988 Indian Russian High Profile Es...Call Girls In {{Laxmi Nagar Delhi}} 9667938988 Indian Russian High Profile Es...
Call Girls In {{Laxmi Nagar Delhi}} 9667938988 Indian Russian High Profile Es...
 
Call Girls In {{Connaught Place Delhi}}96679@38988 Indian Russian High Profil...
Call Girls In {{Connaught Place Delhi}}96679@38988 Indian Russian High Profil...Call Girls In {{Connaught Place Delhi}}96679@38988 Indian Russian High Profil...
Call Girls In {{Connaught Place Delhi}}96679@38988 Indian Russian High Profil...
 
RAJKOT CALL GIRLS 92628/71154 RAJKOT CAL
RAJKOT CALL GIRLS 92628/71154 RAJKOT CALRAJKOT CALL GIRLS 92628/71154 RAJKOT CAL
RAJKOT CALL GIRLS 92628/71154 RAJKOT CAL
 
NAGPUR CALL GIRL 92628*71154 NAGPUR CALL
NAGPUR CALL GIRL 92628*71154 NAGPUR CALLNAGPUR CALL GIRL 92628*71154 NAGPUR CALL
NAGPUR CALL GIRL 92628*71154 NAGPUR CALL
 
Call Girls In {Green Park Delhi} 9667938988 Indian Russian High Profile Girls...
Call Girls In {Green Park Delhi} 9667938988 Indian Russian High Profile Girls...Call Girls In {Green Park Delhi} 9667938988 Indian Russian High Profile Girls...
Call Girls In {Green Park Delhi} 9667938988 Indian Russian High Profile Girls...
 
SURAT CALL GIRL 92628/71154 SURAT CALL G
SURAT CALL GIRL 92628/71154 SURAT CALL GSURAT CALL GIRL 92628/71154 SURAT CALL G
SURAT CALL GIRL 92628/71154 SURAT CALL G
 
Goa Call Girls 🥰 +91 9540619990 📍Service Girls In Goa
Goa Call Girls 🥰 +91 9540619990 📍Service Girls In GoaGoa Call Girls 🥰 +91 9540619990 📍Service Girls In Goa
Goa Call Girls 🥰 +91 9540619990 📍Service Girls In Goa
 
Best VIP Call Girls Noida Sector 24 Call Me: 8700611579
Best VIP Call Girls Noida Sector 24 Call Me: 8700611579Best VIP Call Girls Noida Sector 24 Call Me: 8700611579
Best VIP Call Girls Noida Sector 24 Call Me: 8700611579
 
Call Girls In {Laxmi Nagar Delhi} 9667938988 Indian Russian High Profile Girl...
Call Girls In {Laxmi Nagar Delhi} 9667938988 Indian Russian High Profile Girl...Call Girls In {Laxmi Nagar Delhi} 9667938988 Indian Russian High Profile Girl...
Call Girls In {Laxmi Nagar Delhi} 9667938988 Indian Russian High Profile Girl...
 
Independent Call Girl Service In Goa 9316020077 Call Girl In Goa By Goa ...
Independent Call Girl Service In  Goa  9316020077 Call Girl In  Goa  By  Goa ...Independent Call Girl Service In  Goa  9316020077 Call Girl In  Goa  By  Goa ...
Independent Call Girl Service In Goa 9316020077 Call Girl In Goa By Goa ...
 
Best VIP Call Girls Noida Sector 23 Call Me: 8700611579
Best VIP Call Girls Noida Sector 23 Call Me: 8700611579Best VIP Call Girls Noida Sector 23 Call Me: 8700611579
Best VIP Call Girls Noida Sector 23 Call Me: 8700611579
 

s41598-022-07922-w.pdf

  • 1. 1 Vol.:(0123456789) Scientific Reports | (2022) 12:4280 | https://doi.org/10.1038/s41598-022-07922-w www.nature.com/scientificreports Heterogeneous climate change impacts on electricity demand in world cities circa mid‑century Yasmin Romitti* & Ian Sue Wing Rising ambient temperatures due to climate change will increase urban populations’ exposures to extreme heat. During hot hours, a key protective adaptation is increased air conditioning and associated consumption of electricity for cooling. But during cold hours, milder temperatures have the offsetting effect of reducing consumption of electricity and other fuels for heating. We elucidate the net consequences of these opposing effects in 36 cities in different world regions. We couple reduced- form statistical models of cities’ hourly responses of electric load to temperature with temporally downscaled projections of temperatures simulated by 21 global climate models (GCMs), projecting the effects of warming on the demand for electricity circa 2050. Cities’ responses, temperature exposures and impacts are heterogeneous, with changes in total annual consumption ranging from−2.7 to 5.7%, and peak power demand increasing by as much as 9.5% at the multi-GCM median.The largest increases are concentrated in more economically developed mid-latitude cities, with less developed urban areas in the tropics exhibiting relatively small changes.The results highlight the important role of the structure of electricity demand: large temperature increases in tropical cities are offset by their inelastic responses, which can be attributed to lower air-conditioning penetration. Climate change is projected to increase the frequency and intensity of populations’ exposure to extreme high temperatures, particularly in urban ­ areas1 . Adaptation to such impacts will differ in cities across the world. Higher temperatures will adversely affect the health of urban ­ populations2 , and trigger adaptations that affect the demand for energy. The link between ambient temperature and mortality or morbidity is well ­ understood3,4 and averting behavior via heating and cooling are a major driver of diurnal and seasonal variability in electricity ­demand5,6 . Peak and total electricity demand are anticipated to increase worldwide as future warming increases demand for space cooling as an adaptation to more frequent and intense spells of high ­ temperature7 . Simultane- ously, climate warming is projected to moderate cold-season low-temperature extremes, inducing reductions in the demand for electricity for space ­ heating8 . The relative magnitudes of these opposing effects will vary across locations and warming ­ scenarios9 . These stylized facts highlight the importance of quantifying (i) the impact on net energy demand of simultaneous increases in demand for cooling and decreases in demand for heating, (ii) the effectiveness of additional electricity use for cooling in moderating adverse heat-related health outcomes, and (iii) the environmental health, and welfare impacts associated with potential increases in greenhouse gases and other air pollutants emitted by the electric generation necessary to satisfy increased demand. It has been estimated that climate change will stimulate a 25–58% increase global energy demand by mid- century10 , but a key caveat is that this result is derived using coarse spatial (national) and temporal (annual) scale measures of both energy and ­ temperature11 . By contrast, populations’ exposures to extreme heat, and their deci- sions to consume energy as a means of shielding themselves from associated adverse health consequences, occur over finer time scales (hours to days) and geographic domains with a diversity of built environment contexts. Nationwide estimates are thus unlikely to capture the heterogeneity in demand response inherent across urban geographies resulting from distinct local structures of electricity demand and local climates. Global sub-national differences in urbanization and population growth further underpin the significance of evaluating the energy implications of local climate adaptation decisions that may be masked by national scale ­ estimates12 . Here we characterize heterogeneous local climate adaptation by leveraging fine spatial and temporal scale data to model the transient response of electricity to temperature. Our approach draws on substantial empirical literature on the effect of temperature on the demand for energy ­ generally11,13,14 , and electricity ­ specifically9,15–20 to character- ize the response of electric power consumption to temperature in 36 global cities on an hourly time step, and quantify the impact on high-frequency electricity demand of mid-century climate warming. OPEN Boston University, Earth and Environment, Boston 02215, USA. * email: yromitti@bu.edu
  • 2. 2 Vol:.(1234567890) Scientific Reports | (2022) 12:4280 | https://doi.org/10.1038/s41598-022-07922-w www.nature.com/scientificreports/ We make three contributions. First, data storage limitations have precluded archiving of global climate model (GCM) outputs at the hourly frequencies on which electricity load data have become available. Estimates of future heat ­ exposures12,21–25 have largely relied on spatially downscaled GCM simulations of daily temperatures, but less attention has been paid to temporal downscaling to understand the transient impacts of warming temperatures. We address this gap by combining hourly temperatures from reanalysis data with daily mid- century temperature projections from the NASA Earth Exchange Global Daily Downscaled Climate Projections (NEX-GDDP) under two representative concentration scenarios (RCPs) of warming, 4.5 and 8.5, and applying a delta correction ­ method26,27 to produce hourly current and mid-century climate temperature series. Second, we show that the hourly response of electricity demand to current and lagged temperatures leveraged in elec- tricity market ­ forecasting28 has important implications for adaptation, owing to varying thermal properties of the built ­ environment16 . Our statistical model incorporates a distributed lag structure similar to that employed in epidemiological investigations of temperature on ­ mortality29 . Our third contribution is bridging separate literatures that estimate climate impacts using differing techniques and scales. Econometric models of the non- linear response of electric load to daily temperatures have been developed over broad spatial ­ domains18,30 while recent estimates of high frequency cooling demand have combined high-resolution meteorological simulations with land use maps and simple transformations of load data for individual ­ cities31 . We improve upon these approaches by using hourly temperature observations to scale climate projections, and combining the results with empirically-derived impact response surfaces to estimate mid-century warming effects on electricity demand. Specifically, we employ hourly electricity data to econometrically estimate reduced-form statistical response surfaces of electricity demand to temperature in 36 global cities. We next temporally downscale GCM simulated future temperature projections by combining the diurnal cycle of hourly temperatures from ­ ERA532 with daily maximum and minimum temperatures from 21 GCMs in NEX-GDDP to construct hourly temperature series for current (2006-2020) and mid-century (2046–2060) climates that shed light on climatically-induced increases in urban extreme heat exposures and the demand for adaptation through cooling and electricity use. We combine these projections with our response surfaces to produce estimates of hourly impacts to electricity demand in 2050. The resulting heterogeneity in the transient response of electricity to temperature, and impact of future climate change on electricity demand among urban populations, differs with respect to both latitude and the structure of final demand for energy. Temperate cities largely exhibit “V”-shaped response functions: referring to the non-linear shape of the temperature-demand relationship that is well-documented in the empirical and engineering ­literatures14,17,18,30,33 . Electricity demand for space cooling (heating) increases as temperatures rise above (fall below) the “set point” temperature,T∗, where weather-sensitive electric load, L∗, is minimized—typi- cally between 10–30◦ C. Tropical cities’ response functions range from increasing to unresponsive, as can be seen in Fig. 1, reflecting underlying differences in built environment characteristics and social and economic contexts across world cities. Furthermore, cities in mid-latitude temperate climates that currently experience cold winters and mild summers see reduced demand for a mix of fuels for heating but more electricity for cooling, with peak per-capita demand increases of up to 9.5% under future warming. Conversely, cities in the tropics that experience warm temperatures year-round vary in their responses, exhibiting both increased consumption of electricity for cooling and overall reductions in demand, resulting in median per capita annual impacts ranging from−2.7 to 5.7% across GCMs. Projections of impacts under both future temperature shifts and demographic change represent−4 to 21% of mean annual historical demand across cities with the largest effects found in both the tropics and mid-latitudes. Annual impacts on electricity load further indicate that peak demand for cooling during warm periods may not be entirely offset by cool period reductions in demand. The diversity of responses in our results indicates a reversal of the north-south gradient of electricity demand impacts demonstrated in previous ­research30 , which suggests the need for caution extrapolating impact responses derived for the mid- latitudes to locations in the tropics. While we are not able to observe additional attributes that may be responsible for intra-urban variation in energy demand (e.g., built environment heat transfer characteristics, prevalence of air conditioning), nor how developing cities may evolve in the future with urbanization, our results identify and characterize distinct patterns of temperature-responsive demand across cities, indicating these these areas are intriguing and merit further investigation. Results Heterogeneous demand response profiles. Figure S1 summarizes the responses of hourly electric load to current and lagged hourly temperatures as three-dimensional response surfaces (see Supplementary Infor- mation—SI for figure and details regarding basis for lag structure). Figure 2 illustrates the integrated response over contemporaneous and lagged temperatures, which falls into three broad categories: “V”-shaped, increasing, and unresponsive. “V”-shaped responses are characteristic of the mid-latitude temperate cities in our sample. For urban areas exhibiting this response, demand is generally largest for contemporaneous temperatures, is less responsive to temperatures experienced up to 4 hours prior, and, relative to this minimum point, is somewhat more responsive to temperatures further removed in time. These cities experience the widest range of seasonal temperatures (−20 to +45 ◦ C). By contrast, for most cities in the tropics, electricity demand increases with tem- perature—in some cases slightly non-monotonically (e.g., Abidjan, Accra, Mindelo). These climates are warm with small annual temperature ranges (17–30 ◦ C), which obviates the need for heating, with the result that T∗ coincides with the lower support of the temperature distribution. Here too, demand tends to be most responsive to contemporaneous temperatures, with temperatures at previous hours having impacts that are smaller in mag- nitude but vary considerably. Finally, three tropical cities (Mbabane City, Kupang, and Nairobi) exhibit patterns of electricity demand that are largely unresponsive to temperature, likely because of idiosyncratic geographic factors. (These areas experience a wide range of seasonal temperatures (5–35 ◦ C) and Mbabane and Nairobi are located at high altitudes with relatively mild climates, which may obviate the need for substantial cooling,
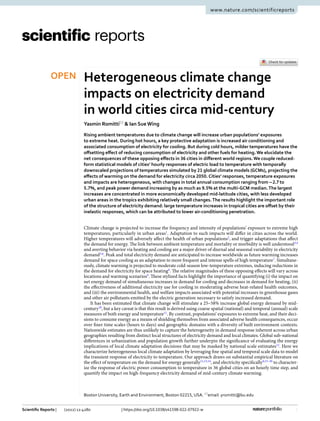
  • 3. 3 Vol.:(0123456789) Scientific Reports | (2022) 12:4280 | https://doi.org/10.1038/s41598-022-07922-w www.nature.com/scientificreports/ whereas Kupang is located in the eastern portion of the Indonesian archipelago where electrification rates tend to be ­ lowest34 .) Climate change impacts, and drivers. Shifts in cities’ hourly temperature distributions due to climate change circa 2050 are constructed via the delta correction method by combining patterns of hourly temperature responses to diurnal extrema that we empirically estimate from reanalysis data with daily temperature extremes projected by 21 GCMs (see “Methods”). Figure S2 summarizes the resulting changes in mid-century cold- and hot-season temperature distributions for the RCP 8.5 warming scenario. (Distributions for RCP 4.5 are shown in Fig. S3.) Across GCMs, summer and winter hourly temperatures both increase for the majority of cities. The rightward movement in the upper support of the distribution of summer temperatures exceeds the shift in the median, indicating a lengthening of the tail of extreme high temperature exposures. Importantly, vigorous (RCP 8.5) warming’s induced shifts are larger for cities in the mid-latitudes (6–8◦ C) compared to the tropics (5–6◦ C), a result that contrasts with prior characterizations of climatic exposure such as the increase in the number of days with average temperatures above a pre-defined ­ threshold10 . To quantify the impact of mid-century warming on hourly electricity demand in each city, we force our estimated demand responses with projected temperature shifts and sum the resulting changes in hourly elec- tricity demand per capita to project changes in electricity consumption on annual and sub-annual time-scales. Figure 3 decomposes shifts in total annual demand into the effect of climate change on the fractional change in total electricity demand for hours above and below T∗, and distinguishes the contribution of the structure of electricity demand (i.e., the magnitude of the average temperature semi-elasticity of demand) from the effects of the shift in temperature exposures (see “Methods”). In Panel a, populous mid-latitude cities such as Tokyo have historically large annual per capita load as well as a demand structure that is sensitive to both heating and cooling. Populous tropical developing-country cities such as Manila consume less electricity and exhibit temperature-inelastic heating electricity demand but highly elastic cooling electricity demand (see Table S1.) Panel b’s summary of the changes in annual hours above and below T∗ reveals a tendency toward increases in hot hours alongside commensurate or slightly smaller reductions in cold hours. (Exceptions tend to be tropical cities such as Abidjan, Dakar and Kupang whereT∗ lies at the lower support of the temperature distribution in the current climate and remains there as the climate warms.) These influences drive the structure and exposure effects summarized in Panels c and d, for which the impacts of future temperature exposures dominate those of demand structure by an order of magnitude for many urban areas in our sample, primarily those in the mid- latitudes. In tropical cities where the vast majority of hours are hot, the structure and exposure effects are of similar magnitude—a phenomenon that is the key driver of net impact, to which we now turn. Figure 1.   Geographical distribution of sample cities. Point color corresponds to category of demand response function: turquoise—“V”-shaped response, purple—increasing response, cyan—unresponsive.
  • 4. 4 Vol:.(1234567890) Scientific Reports | (2022) 12:4280 | https://doi.org/10.1038/s41598-022-07922-w www.nature.com/scientificreports/ Figure 4 summarizes the consequent net impacts of climate change on the total and peak demand for electric- ity (Fig. S8 illustrates these impacts under RCP 4.5. Relative to the current climate, the change in annual demand per capita at the multi-model median ranges from−2.7 to+5.7% (Panel a), while the change in the multi-model median of the 95th percentile of hourly demand ranges from −3.4 to +9.5% (Panel b). In the majority of our sample of cities, the amplifying effect of the semi-elasticity of demand to hot temperatures (T > T∗) in conjunc- tion with climatically-induced increases in hot hours outweighs the attenuating effect of the semi-elasticity of Figure 2.   Response of hourly electric load to hourly temperature in 36 cities.
  • 5. 5 Vol.:(0123456789) Scientific Reports | (2022) 12:4280 | https://doi.org/10.1038/s41598-022-07922-w www.nature.com/scientificreports/ Figure 3.   (a) Average fractional response of per capital urban electricity demand to temperatures above and below the set point temperature,T∗. Colors indicate type of demand response (turquoise—“V”-shaped, purple— increasing, cyan—unresponsive. (b) Change in hours over the year with temperatures above (red) and below (cyan)T∗. (c,d) Decomposition of the change in annual total electricity demand into the effects of demand response and shifts in the distribution of hourly temperatures.
  • 6. 6 Vol:.(1234567890) Scientific Reports | (2022) 12:4280 | https://doi.org/10.1038/s41598-022-07922-w www.nature.com/scientificreports/ demand to cold temperatures (T < T∗) in conjunction with decreases in cold hours. The net of these effects is changes in demand of 0% up to +6% in 32 cities, and reductions of up to −2.7% in the remaining four cities. Within this latter group, mid-latitude cities (e.g., Tokyo, Eugene, and Tacoma) experience increases in hot hours that reduce electricity demand for heating by a larger amount than they increase demand for cooling, lowering net annual consumption. In Mbabane City, warming shifts hours from temperatures at which demand peaks to those where demand is actually smaller due to the decreasing monotonicity of its response. These effects underlie changes in the 95th percentile of per capita demand (Panel b), which exceed +5% in nearly half of our sample, typically mid-latitude temperate cities in North America (e.g., Detroit: 9.5%, Philadel- phia: 8.9%, North Little Rock: 8.8%), while among tropical cities, the largest increases are substantially smaller (e.g., Manila:+5.9%). By contrast, one fifth of the sample experiences declines in peak demand. Over-represented in this group are mid-latitude cities whose peak electricity demand occurs during the cold season, and the “unre- sponsive” tropical city of Mbabane. The surprising upshot is that the substantial increases in demand appear concentrated in mid-latitude cities, while demand changes experienced by urban areas in the tropics tend to be either increases or decreases of much smaller magnitude. Heterogeneity in demand impacts also reflects the differing contributions of lagged versus current peak (> 95th percentile) hourly temperatures in cities. Decomposing the cumulative effect of the prior 6 hours of peak temperature exposure on mean demand (lagged response) against the effect of current hourly peak temperatures (contemporaneous response) reveals that the latter is more influential in most cities in the mid-latitudes under both the current and 2050 climates, but generally not in the tropics, where instead the lagged response tends to dominate (Fig. 5, for RCP 4.5 see Fig. S9). For almost half of cities, climate change increases the effects of both the contemporaneous and the lagged response (upward pointing arrows). The remaining cities largely display simultaneous increases in the effect of the contemporaneous response and decreases in the effect of the lagged response (rightward pointing arrows), a divergence that arises from differences in the slopes of the demand response surface along the temporal dimension (Fig. S1). Daily load profiles summarize the impact of climate change on hourly demand (Figs. S4 and S5). Mid-latitude cities experience up to a 20% (Philadelphia) increase in peak demand at certain hours. Load duration curves (LDCs) illustrate warming impacts to hourly demand and its seasonal dependence, a subset of which are shown in Fig. 6 (remaining city LDCs for RCP 8.5 are in Fig. S10, and for RCP 4.5 are in Fig. S11). Urban areas whose peak electricity consumption occurs during the hot season tend to experience amplification of peak demand (on the order of 0.02–0.42 kWh per capita), while those with cold- or shoulder-season peaks tend to experience peak demand attenuation. In locations such as Tacoma and Tokyo, the latter effect arises from the decline in winter peak demand with warming. In the tropics, cities such as Antigua, Honolulu and Manila experience amplifica- tion in load demand across all hours, while the remaining cities (which mostly belong to the “unresponsive” group) show either partial or almost complete reductions in demand over the course of the year (e.g., Mindelo and Mbabane City, respectively). For half of our sample of cities, concentrated in the mid-latitudes, cold-season hours shift lower in the rank-ordering of hourly demand. Only in a few of these locations is there a perceptible reverse shift of hot-season hours higher in the ordering (e.g., N. Little Rock). While in many cities, loads that correspond to hours in the shoulder seasons occur at all percentiles ranks, there is a slight tendency toward hours Figure 4.   Percentage change in (a) total annual and (b) 95th percentile demand due to changes in hourly temperatures circa 2050, 21 GCM simulations of RCP 8.5 warming.
  • 7. 7 Vol.:(0123456789) Scientific Reports | (2022) 12:4280 | https://doi.org/10.1038/s41598-022-07922-w www.nature.com/scientificreports/ Figure 5.   Change in demand components attributable to contemporaneous peak (> 95th percentile) temperatures (horizontal axis) and the cumulative effects of peak temperature exposures 1–6 h prior (vertical axis). Gray circles indicate mean MWh per capita demand during the historical period, hollow squares indicate median multi-model mean MWh per capita demand in 2050 under RCP 8.5, arrows indicate direction of change. Figure 6.   Current and projected 2050 load duration curves (LDCs) and seasonal distribution of load for a subset of cities. For each city, LDCs are shown for the current climate (blue), individual GCM simulations of RCP 8.5 warming (yellow), and the multi-GCM median (red). Colored panels illustrates each city’s seasonal distribution of hourly demand in the current climate (bottom) and RCP 8.5 warming (top), blue: winter, red: summer, green: spring, orange: fall.
  • 8. 8 Vol:.(1234567890) Scientific Reports | (2022) 12:4280 | https://doi.org/10.1038/s41598-022-07922-w www.nature.com/scientificreports/ in spring (autumn) moving lower (higher) in the demand order, consistent with warming-induced electricity demand reductions for heating demand and increases for cooling. Finally, we assess the implications of the foregoing impacts for urban areas’ absolute electricity consumption circa mid-century. Coupling our climatically-driven shifts in annual per capita load with 2050 population projec- tions under two shared socioeconomic pathway (SSP) scenarios—SSP3 and SSP5 (see “Methods”)35,36 , allows us to account for the additional influence of future population expansion (Table 1, RCP 4.5 Table S2). The RCP 8.5 multi-model median impact on annual load exceeds 500 GWh for a fifth of our sample of cities under both SSPs, with the largest load level increases in Manila, Singapore, Chandigarh, and Detroit—representing 7.2 (7.6)%, 2.5 (2.7)%, 20.8 (21.4)%, and 2.2 (3)% of annual demand for SSP3 (SSP5), respectively. The patterns of change in cities’ levels of annual demand are broadly consistent across both SSP scenarios, but larger in magnitude under SSP5. Effects are concentrated in mid-latitude temperate cities and electricity-intensive cities in the tropics (e.g., Manila, Singapore). At the 95th percentile across GCMs, amplification of load over hot hours will require an additional 1000–3000 GWh in 8 cities. Discussion Across 36 cities, mid-century climate change will exert heterogeneous impacts on electric power consumption, driven by the interaction between shifts in cities’ distributions of hourly temperatures and the structure of their temperature-sensitive electricity demands. Increases in peak demand are concentrated in the mid-latitude, tem- perate, mostly North American cities in our sample, resulting in up to a 9.5% amplification at the 95th percentile of annual demand, while tropical cities’ peaks see comparatively modest increases (0–5.9%) and even declines (up to 0.6%). This pattern is corroborated by mid-century shifts in load duration curves, leading to increases in peak-hours of as much as 0.42 kW per person in North American cities—a substantial fraction of non-weather sensitive demand. The largest absolute increases in urban electricity demand are projected to occur in the trop- ics as well as the mid-latitudes, reflecting the importance of population expansion in addition to temperature- dependent per-person demand. Our findings constitute an important qualification to the previously-discovered north-south polarization of electricity demand under climate ­ warming30 . Specifically, our results for the tropics suggest that this latitudinal gradient of impact severity is unlikely to extend all the way to the equator. The substantial temperature increases experienced by tropical cities induce shifts in demand that are much smaller than the impacts of only moder- ately larger temperature changes on mid-latitude urban areas, in contrast to prior empirically-based estimates of energy demand amplification under similar temperature ­ change10,18 . The difference is accounted for by prior studies’ coarser temporal resolution of temperature shifts and associated electricity demand (daily, annual), and is particularly an artifact of the thresholds used to bin daily temperatures in order to empirically establish their effects on temporally aggregated energy demand. Using our hourly temperatures to construct counts of hot (T ≥ 27.5 ◦C) ­days10 , the apparent heat exposure gradient reverses to become substantially larger in the tropics (up to 149 additional hot days) in comparison to the mid-latitudes (a maximum of only 93 additional hot days) (Figs. S6 and S7). Although the magnitude of electricity demand responses to hot days for temperate regions has been found to exceed those for the ­ tropics11 , consistent with our results, their combination with binned temperatures leads to different patterns of impact across the ­ globe10 . Notwithstanding, our estimated increases in peak and total per capita energy demand for mid-latitude temperate cities mirror the findings of prior electricity-focused ­ studies18,37–39 . We demonstrate that the character of the demand response to temperature, rather than solely the projected shift in the distribution of temperatures, is an important driver of heterogeneity in electricity demand amplifica- tion due to climate change. Despite the small size of our city sample, our results raise the caution that the “V”- shaped splines found by previous ­ studies11,40–43 should not be considered universal, but instead tend to reflect the patterns of demand that prevail in richer, temperate, mid-latitude cities. The latter exhibit highly elastic responses to changes in temperature above and belowT∗ that reflect built environment thermal properties different from those likely to prevail in the tropics. The corresponding 3D response surfaces (Fig. S1) consistently show high demand occurring at the hottest contemporaneous temperatures as well as the highest temperatures 6 hours prior, suggesting that buildings in these climates tend to hold heat very well. Tropical cities whose overall demand responses are linear and increasing exhibit a diversity of lag structures. This may be a feature of the quality of hourly demand data available in these cities (limited in temporal range and age of observations), though in addi- tion, likely reflects not only climatic differences in built environment characteristics but also electrification and appliance availability that are correlated with economic development. Cities in countries further from the world technological frontier with less developed infrastructure tend to exhibit demand responses that are relatively temperature-inelastic at all lags, resulting in only moderate electricity consumption increases with warming, ­corroborating42 . We also find moderate electricity demand impacts of future warming in most tropical cities, and show that they are attributable to relatively modest shifts in the temperature distribution on hourly scales. The tropics are home to a plethora of large cities whose income and population are projected to grow rapidly over the coming decades, but are under-represented in our sample. To understand how pervasive modest impacts might be, and establish the implications for future energy demand adaptation to climate change globally, will require concerted efforts to collect fine spatial and temporal scale data on energy demand in developing countries. There are additional caveats to our findings. Perhaps the most important is our limited understanding of how the structure of electricity demand might change in the future. Evidence from India on the sensitivity of the shape of the demand response to increasing ­ income44 , reinforces the importance of this phenomenon. In view of the short periods over which our temperature-load relationships are estimated, we are unable to draw inferences about the manner in which these responses are likely to shift over time with economic development and technological ­ progress11 . Our projections thus indicate how temperature changes might influence electricity
  • 9. 9 Vol.:(0123456789) Scientific Reports | (2022) 12:4280 | https://doi.org/10.1038/s41598-022-07922-w www.nature.com/scientificreports/ SSP3 Annual T ≥ T∗ T < T∗ Median Low High Median Low High Median Low High Abidjan 149.17 114.42 212.81 149.17 114.42 212.81 Accra 285.67 208.74 385.25 285.67 208.74 385.25 Amman 215.35 147.36 407.00 398.34 294.30 632.36 − 200.62 − 240.66 − 100.39 Antigua 18.04 13.56 26.35 18.04 13.56 26.35 Beirut 7.26 5.37 10.32 7.13 5.55 10.24 − 0.08 − 0.25 0.15 Boston 196.56 71.57 332.30 357.80 185.20 516.34 − 153.84 − 274.21 − 51.45 Chandigarh 1248.60 669.16 1860.64 1241.10 668.98 1852.70 6.46 0.60 11.52 Chattanooga 78.27 − 1.45 122.43 160.82 116.24 193.83 − 85.27 − 145.77 − 20.71 Colorado Springs 7.19 − 4.41 28.61 41.41 25.40 62.59 − 33.98 − 47.54 − 19.71 Dakar 157.37 114.48 199.17 157.37 114.48 199.17 Delhi 892.60 437.20 1344.47 865.22 417.48 1311.75 26.76 10.27 37.60 Detroit 1214.30 640.32 1526.11 1384.76 755.75 1645.97 − 133.07 − 260.83 − 67.80 El Paso 244.86 137.90 322.87 279.08 164.49 369.33 − 36.82 − 46.81 − 26.14 Eugene − 43.19 − 71.62 − 24.92 4.87 1.96 8.01 − 47.91 − 79.00 − 26.93 Honolulu 262.45 127.59 380.82 262.45 127.59 380.82 Indianapolis 121.04 32.31 205.56 291.84 168.20 421.35 − 162.77 − 296.45 − 70.78 Isla Sao Nicolau 0.63 0.44 0.91 0.58 0.35 0.88 0.06 0.01 0.09 Kansas City 38.03 17.06 66.60 55.97 33.35 96.88 − 17.23 − 30.11 − 10.14 Kupang 1.85 1.33 2.19 1.85 1.33 2.19 Los Angeles 358.34 236.67 488.30 439.35 310.68 577.98 − 80.16 − 99.46 − 47.94 Louisville 359.80 71.39 643.23 838.94 572.27 1164.78 − 498.11 − 801.49 − 176.00 Manila 3712.61 2515.98 6016.88 3712.61 2515.98 6016.88 Mbabane City − 3.17 − 3.88 − 2.51 − 3.17 − 3.88 − 2.51 Memphis 317.27 132.76 542.01 415.88 241.83 680.49 − 101.67 − 156.00 − 31.01 Mindelo 1.40 0.96 1.95 1.40 0.96 1.95 Nairobi 109.36 75.14 143.69 109.36 75.14 143.69 New York City 937.79 554.71 1240.60 1030.00 585.30 1345.79 − 105.19 − 168.62 − 23.00 North Little Rock 17.10 8.17 27.45 23.15 13.73 35.85 − 5.23 − 7.82 − 2.31 Omaha 182.35 102.09 287.89 267.05 161.20 411.02 − 87.23 − 167.42 − 50.61 Philadelphia 164.18 12.76 336.56 461.03 261.40 555.25 − 265.09 − 424.85 − 45.73 Sacramento 163.16 100.00 230.45 205.34 137.64 316.86 − 56.70 − 79.81 − 28.30 San Diego 500.05 307.01 748.94 545.38 336.90 803.31 − 45.88 − 56.02 − 30.84 Singapore 2442.06 1617.88 3618.70 2442.06 1617.88 3618.70 Springfield 27.73 − 1.41 47.16 58.66 36.27 102.88 − 36.65 − 68.23 − 18.29 Tacoma − 42.26 − 71.35 − 25.56 0.27 − 0.44 1.77 − 42.10 − 71.62 − 25.73 Tokyo − 2511.20 − 4297.67 − 1488.13 1402.82 761.27 2446.62 − 3739.96 − 6744.29 − 2625.65 SSP5 Annual T ≥ T∗ T < hT∗ Median Low High Median Low High Median Low High Abidjan 126.10 96.73 179.90 126.10 96.73 179.90 Accra 267.09 195.17 360.20 267.09 195.17 360.20 Amman 211.47 144.70 399.66 391.15 288.99 620.95 − 197.00 − 236.32 − 98.58 Antigua 18.04 13.56 26.35 18.04 13.56 26.35 Beirut 6.44 4.76 9.16 6.33 4.93 9.09 − 0.07 − 0.22 0.13 Boston 267.79 97.51 452.73 487.46 252.31 703.46 − 209.59 − 373.59 − 70.09 Chandigarh 1280.43 686.22 1908.07 1272.74 686.03 1899.93 6.62 0.62 11.81 Chattanooga 110.06 − 2.03 172.17 226.15 163.47 272.58 − 119.92 − 205.00 − 29.12 Colorado Springs 10.08 − 6.17 40.08 58.00 35.58 87.68 − 47.60 − 66.60 − 27.61 Dakar 158.19 115.08 200.21 158.19 115.08 200.21 Delhi 1031.99 505.47 1554.44 1000.34 482.68 1516.61 30.94 11.87 43.47 Detroit 1676.49 884.04 2106.98 1911.82 1043.41 2272.46 − 183.72 − 360.10 − 93.60 El Paso 255.46 143.87 336.85 291.16 171.61 385.32 − 38.42 − 48.84 − 27.27 Eugene − 59.85 − 99.24 − 34.54 6.75 2.72 11.10 − 66.39 − 109.47 − 37.32 Honolulu 353.15 171.69 512.43 353.15 171.69 512.43 Continued
  • 10. 10 Vol:.(1234567890) Scientific Reports | (2022) 12:4280 | https://doi.org/10.1038/s41598-022-07922-w www.nature.com/scientificreports/ demand, holding the characteristics of urban areas constant as they are today. An alternative approach could be to utilize the response of mid-latitude cities in developed nations as models for the future, on the assumption that they reflect the manner in which tropical cities might evolve on the time frames over which the climate is anticipated to ­ change30 . If tropical cities with relatively inelastic demand responses are endowed with the response function of the tropical city with the most weather-sensitive demand in our sample (Manila), future warming induces larger percentage (up to +5.3%) and absolute (up to 798 GW under SSP5) changes in peak load (Fig. S12 and Table S3). Nevertheless, whether tropical developing urban areas at mid-century will behave similarly to their mid-latitude developed counterparts today is highly uncertain. Temperate cities may provide an indication for how the set point of the temperature-responsive components of demand may shift, however, this assumption does not indicate how the overall shape of cities’ demand responses might shift with economic and technological development. To address this gap, one potential avenue for future research is analyzing how the shape of the temperature-load relationship shifts with proxies for structural and technological change in energy systems that can be linked to scenarios of socioeconomic ­ futures45 . Given the dependence of demand in the least developed regions on the diffusion of ­ electrification46 , the challenge will be to develop sufficiently long load time series from which to infer how demand responses to temperature might be influenced by development, and use the results as archetypes that can be applied to electrifying locations. A related shortcoming, shared with prior empirical ­ work10,11,18,30 , is our model’s implicit focus on adapta- tion at the intensive margin—the temperature responsiveness of energy demand conditional on the stock of electricity-using durable goods, without explicit consideration of the extensive margin—temperature-induced technology adoption, particularly air conditioning (AC) ­ capital47 . The latter has been quantified by exploiting variation in stocks of energy-using durables across locations with different climates and incomes, in conjunction with spatially and temporally varying data on electricity demand and ­ weather48 . This approach has leveraged observations of multiple locations within a country, but given the large differences in the levels of economic development among our cities and in particular the paucity of data on appliance holdings, its relevance to the current analysis remains open to question. A potential way forward is characterizing the joint dependence of AC penetration on temperature, income and other indicators of development leveraging census data for temperate and tropical countries. This is an active area of our research in progress. Despite these limitations, our contribution is to highlight new implications for climate change impacts and adaptation of the fine temporal and spatial scale structure of electricity demand. Our results suggest that prior demand responses estimated for developed, temperate areas are unlikely to reflect the temperature dependence of electricity consumption in developing, tropical areas. Naive extrapolation of patterns of energy demand adaptation to warming observed in the mid-latitudes could thus potentially over-estimate the magnitude of climate change impacts, both in the tropics and globally. Even so, we urge caution in drawing broad conclusions from the current small sample of cities. As primary data collection makes available additional hourly load series SSP5 Annual T ≥ T∗ T < hT∗ Median Low High Median Low High Median Low High Indianapolis 166.90 44.54 283.43 402.39 231.92 580.97 − 224.44 − 408.75 − 97.60 Isla Sao Nicolau 0.35 0.24 0.50 0.32 0.19 0.48 0.03 0.00 0.05 Kansas City 52.49 23.55 91.93 77.25 46.03 133.72 − 23.78 − 41.56 − 14.00 Kupang 2.03 1.46 2.41 2.03 1.46 2.41 Los Angeles 490.70 324.10 668.67 601.63 425.44 791.48 − 109.77 − 136.20 − 65.66 Louisville 501.08 99.43 895.81 1168.37 796.98 1622.16 − 693.70 − 1116.21 − 245.12 Manila 3913.29 2651.98 6342.12 3913.29 2651.98 6342.12 Mbabane City − 3.12 − 3.82 − 2.47 − 3.12 − 3.82 − 2.47 Memphis 439.13 183.75 750.19 575.62 334.72 941.86 − 140.72 − 215.91 − 42.93 Mindelo 0.85 0.59 1.19 0.85 0.59 1.19 Nairobi 126.43 86.87 166.11 126.43 86.87 166.11 New York City 1270.88 751.74 1681.26 1395.85 793.19 1823.81 − 142.55 − 228.51 − 31.17 North Little Rock 23.73 11.34 38.08 32.12 19.06 49.74 − 7.25 − 10.85 − 3.21 Omaha 251.48 140.80 397.03 368.30 222.31 566.84 − 120.29 − 230.89 − 69.79 Philadelphia 223.92 17.40 459.03 628.78 356.51 757.29 − 361.55 − 579.45 − 62.37 Sacramento 224.58 137.64 317.21 282.64 189.45 436.14 − 78.04 − 109.86 − 38.96 San Diego 620.19 380.77 928.88 676.41 417.85 996.31 − 56.91 − 69.48 − 38.25 Singapore 2607.53 1727.51 3863.91 2607.53 1727.51 3863.91 Springfield 39.56 − 2.01 67.27 83.67 51.74 146.75 − 52.28 − 97.33 − 26.09 Tacoma − 57.86 − 97.70 − 35.00 0.37 − 0.60 2.43 − 57.64 − 98.07 − 35.23 Tokyo − 3669.57 − 6280.11 − 2174.58 2049.91 1112.43 3575.20 − 5465.14 − 9855.31 − 3836.82 Table 1.  Change in total annual GWh across GCMs under RCP 8.5 at the median, 5th (low) and 95th (high) percentiles under SSP3 and SSP5. Median, 5th (low) and 95th (high) percentiles of change under both SSPs are also presented for future temperatures≥ T∗ and< T∗.
  • 11. 11 Vol.:(0123456789) Scientific Reports | (2022) 12:4280 | https://doi.org/10.1038/s41598-022-07922-w www.nature.com/scientificreports/ in diverse areas that have not been previously observed, our bottom-up methodology serves as a template that facilitates quantification of the net effects of temperature on electricity demand associated with heterogene- ous climatically-induced rightward shifts in local temperature distributions. Over time, expanding the slate of observations to a more diverse array of urban areas will enhance understanding of the extent to which top-down estimates of the energy demand impacts of climate change might be constrained by fine-scale heterogeneity in climatic and socioeconomic conditions. Methods We empirically project the changes in electricity demand in urban areas as a consequence of mid-century climate change by first using hourly observations of temperature and electricity load to model urban electricity demand response functions. Separately, we use daily temperature series simulated by 21 GCMs and observed historical hourly temperature series in conjunction with a temporal downscaling algorithm to calculate the shifts in extreme low and high temperature exposures that will be experienced by these 36 global cities to 2050. The projected shifts in temperature distribution are combined with results from the demand response functions to construct projections of climate-change driven shifts in hourly electricity demand. Data. For use in our empirical model, we first combine data of hourly electricity demand with meteorological data and population estimates across 36 global cities. Hourly electricity consumption profiles for the majority of cities in this data sample were taken from Cohen et al.49 converted to Universal Coordinated Time (UTC) and matched with corresponding temperature values. The dataset provides hourly electric load series in mega- watts (MW) for various years spanning the period 2003-2018 across different urban areas in North America, Africa, and (primarily southern) Asia (Table S4). While its geographic coverage is limited, the dataset’s fine spa- tial (city) and temporal (hourly) resolution distinguishes it from similar datasets of hourly electric load that are only available for broad spatial domains (e.g., U.S. load balancing areas or European countries). As described ­ in42 , hourly electricity demand was collected from electric utilities, system operators and regula- tory bodies serving sample cities for the most recent years for which data were available at the time, as such these data may not reflect the most current state of these urban energy systems. For India’s National Capital Territory of Delhi, load was disaggregated into five “cities”, each served by a distinct and non-overlapping electricity dis- tribution company (details ­ in42 , Supplementary Information). We re-aggregate these series to provide summed hourly profiles of electricity consumption for the entire Delhi urban area. Further information describing load data and quality are available in the SI. Meterological data are obtained from the European Centre for Medium-Range Weather Forecasts’ (ECMWF) ERA5 ­dataset32 . Centroids of cities’ central business districts or financial districts (where available) were taken to be representative of their encompassing urban area, and used to query ERA5 raster datasets. We extracted hourly series for 2 m air temperature, dew point temperature, wind speed, and downward shortwave radiation for years matching our electricity load data. To construct hourly measurements from GCM daily minimum and maximum temperature projections, hourly air temperatures were extracted for all cities for the 15 year period 2004–2018. We utilize the NASA Earth Exchange Global Daily Downscaled Projections (NEX-GDDP) to calculate the effects of mid-century temperature projections relative to those in the historical ­ period50 . NEX-GDDP contain bias-corrected and spatially downscaled daily maximum and minimum temperatures on a 0.25◦ grid over the 2006-2100 period for RCP 4.5 and RCP 8.5 scenarios derived from 21 GCMs participating in the global Climate Model Intercomparison Project phase 5 (CMIP5)51 . Detailed information on NASA NEX-GDDP is available at https://​cds.​nccs.​nasa.​gov/​nex-​gddp/ and described in both https://​esgf.​nccs.​nasa.​gov/​esgdoc/​NEX-​GDDP_​ Tech_​Note_​v0.​pdf ­and50 . Population data were collected from the U.S. Bureau of Economic Analysis (BEA) Personal Income, Popula- tion, Per Capita Personal Income (CAINC1) tables for all U.S. cities in our sample by metropolitan statistical area (MSA)52 . For cities with populations >300,000, population estimates were obtained from the United Nations World Urbanization Prospects 2018 ­ revision53 . Estimates for Antigua, Isla Sao Nicolau, Kupang, Mbabane City, and Mindelo were gathered from both national and international sources; described in Table S8. Spatially explicit global population projections consistent with the Shared Socioeconomic Pathways (SSPs) are available ­ from54 . These projections cover the period 2010–2100 in ten year time intervals on a 0.125◦ grid. We extract mid-century population projections for SSP3 (high challenges to mitigation and adaptation) and SSP5 (high challenges to mitigation, low challenges to adaptation) to scale our projections of average hourly per capita impact to electric- ity demand. SSP3 describes a demographic trajectory characterized by high population growth rates in the high fertility countries and declining population in low fertility countries with slow rates of urbanization, while SSP5 describes a scenario of accelerated demographic transition with low population growth in high fertility countries, high levels of growth in low fertility countries, and rapid ­ urbanization36,54 . Empirical approach. We estimate the nonlinear response of cities’ electricity load to temperature using a generalized additive model (GAM)55 . Letting h index hours of the year, electric load (Lh) for each of 36 cities is modeled as a crossbasis function of matched hourly current and lagged local temperatures (Th) from ERA5 using the regression where [·] denotes a smooth tensor product parameterized by a vector of estimated coefficients, θ, and uh is a random disturbance term. We set the maximum lag length, ℓ, to six hours to capture the effects of unobserved heat fluxes in the built environment and the thermal properties of buildings and ­ structures56 . (See SI: Methods and Data for a detailed explanation of the theoretical basis for lag structures in building energy use.) Statistical (1) ln Lh = �[Th, Th−1, . . . , Th−ℓ; θ] + controls + uh
  • 12. 12 Vol:.(1234567890) Scientific Reports | (2022) 12:4280 | https://doi.org/10.1038/s41598-022-07922-w www.nature.com/scientificreports/ controls include meteorological predictors of built environment heat transport and thermal performance (ERA5 hourly downward solar radiation, dew point temperature, and wind speed), as well as parsimonious proxies for unobserved non-meteorological determinants of demand (including a smooth function for time and a categorical year dummy that captures the energy consumption impacts of households’ and firms’ routines on various time scales). The fitted response, = [·; θ], exhibits its lowest point at the “set point” temperature, T∗, at which weather-sensitive electricity consumption is minimized, L∗. Following from results ­ in30,42 , we offset by the amount min(ln L(T))for10 ◦C ≤ T ≤ 30 ◦C. This allows us to interpret as the fractional increase in electricity demand above L∗ per ◦ C ambient temperature above or belowT∗. For most cities, is approximately linear on either side ofT∗ (Fig. 2)18 , which allows us to represent the average slopes of the responses as the parameters βC and βH forT T∗ and/orT T∗, respectively. Hourly temperature projections. Projections of current and future electric load utilize daily maximum and minimum temperatures simulated by 21 GCMs from the NASA NEX-GDDP for RCPs 4.5 and 8.5 scenarios. We use ERA5 observed temperatures to estimate the hourly pattern corresponding to diurnal extrema,TMax d and TMin d , where d indexes the day of year. We assume a stable relationship between hourly temperatures and daily extremes, representingTh as the convex combination of the maximum and minimum: in which the hour-specific weight, ωh, is to be determined. Our empirical implementation of this approach is the linear regression where v is a Gaussian error term. Equation (3) is estimated separately for each hour of the day for individual months, to fully account for interannual variation in climate. The fitted values of the weights, ωh, are then used to temporally downscale NEX-GDDP daily temperature extremes (TMin,k d andTMax,k d , where k ∈ {Current, Future} is an index of current (2006–2020) and future (2045–2059) periods). The result is the synthetic hourly tempera- ture series: We then apply the delta correction ­ technique57 : taking the difference in the period-means of synthetic tempera- ture at each hour of the year ( Tk h,d), and adding the result to the mean of the temperature at each hour of the year in the current period from ERA5(Th),yields our estimate of average hourly temperature under warming: Climate change impacts. Our primary metric of the impact of climate change on hourly electricity demand is the results of which are summarized in Figs. 4 and 5. We sum the average hourly per capita impact over all hours and scale the result by future population in the SSP3 and SSP5 scenarios to project impacts on annual total electricity demand (Table 1). Transforming our hourly temperature series into the distribution, H(T), which denotes the count of hours over the year in each1 ◦C bin of temperature, the total annual demand for electricity over cold and hot hours can be expressed as: Our second impact metric decomposes the effect of climate change on the fractional change in total electricity demand for hours above and belowT∗: The first right-hand side term captures the effect of the structure of electricity demand—the percentage increase in demand from an additional hour, dependent on the magnitude of the slope of the response. The second term captures the effect of the change in exposure due to the shift in the temperature distribution—the demand- weighted average percentage change in hours. These two effects are summarized in Fig. 3, Panels c and d. (2) Th,d = ωhTMax d + (1 − ωh)TMin d (3) Th,d − TMin d = ωh(TMax d − TMin d ) + vd (4) Tk h,d = ωhTMax,k d + (1 − ωh)TMin,k d (5) Th,d = (T Future h,d − T Current h,d ) + Th (6) Ih,d = L∗ × (exp �[ Th,d] − exp [ �[Th,d]) Q|TT∗ ≈ T L∗ exp{βC(T∗ − T)H(T)} and Q|TT∗ ≈ T L∗ exp{βH(T − T∗ )H(T)}. (7) 1 Q|TT∗ ∂Q|TT∗ ∂T ≈ βC + T L∗ exp{βC(T∗ − T)} T L∗ exp{βC(T∗ − T)H(T)} · 1 H(T) ∂H(T) ∂T (8) 1 Q|TT∗ ∂Q|TT∗ ∂T ≈ βH + T L∗ exp{βH(T − T∗)} T L∗ exp{βH(T − T∗)H(T)} · 1 H(T) ∂H(T) ∂T
  • 13. 13 Vol.:(0123456789) Scientific Reports | (2022) 12:4280 | https://doi.org/10.1038/s41598-022-07922-w www.nature.com/scientificreports/ Data availability The data generated during our analyses and supporting the findings of this paper are available from the corre- sponding author upon reasonable request. The input data used in this analysis are publicly available at the follow- ing: urban energy demand data: https://​github.​com/​Ecohe​n4/​Energy, other sources listed in Table S7. ECMWF ERA5 reanalysis data: https://​www.​ecmwf.​int/​en/​forec​asts/​datas​ets/​reana​lysis-​datas​ets/​era5. NASA-NEX climate data: https://​cds.​nccs.​nasa.​gov/​nex-​gddp/. Population data: listed in Table S8. Spatial population projections for the SSPs: https://​www.​cgd.​ucar.​edu/​iam/​model​ing/​spati​al-​popul​ation-​scena​rios.​html. Received: 17 September 2021; Accepted: 28 February 2022 References 1. Vahmani, P., Jones, A. D. Patricola, C. M. Interacting implications of climate change, population dynamics, and urban heat mitigation for future exposure to heat extremes. Environ. Res. Lett. 14, 084051 (2019). 2. Sera, F. et al. How urban characteristics affect vulnerability to heat and cold: A multi-country analysis. Int. J. Epidemiol. 48, 1101–1112 (2019). 3. Barreca, A., Clay, K., Deschenes, O., Greenstone, M. Shapiro, J. S. Adapting to climate change: The remarkable decline in the US temperature-mortality relationship over the twentieth century. J. Polit. Econ. 124, 105–159. https://​doi.​org/​10.​1086/​684582 (2016). 4. Gasparrini, A. et al. Mortality risk attributable to high and low ambient temperature: A multicountry observational study. Lancet 386, 369–375. https://​doi.​org/​10.​1016/​S0140-​6736(14)​62114-0 (2015). 5. Maia-Silva, D., Kumar, R. Nateghi, R. The critical role of humidity in modeling summer electricity demand across the United States. Nat. Commun. 11, 1686. https://​doi.​org/​10.​1038/​s41467-​020-​15393-8 (2020). 6. Kumar, R., Rachunok, B., Maia-Silva, D. Nateghi, R. Asymmetrical response of California electricity demand to summer-time temperature variation. Sci. Rep. 10, 10904. https://​doi.​org/​10.​1038/​s41598-​020-​67695-y (2020). 7. Randazzo, T., De Cian, E. Mistry, M. N. Air conditioning and electricity expenditure: The role of climate in temperate countries. Econ. Model. 90, 273–287. https://​doi.​org/​10.​1016/j.​econm​od.​2020.​05.​001 (2020). 8. Bruckner, T. Energy Systems, book section 7 (Cambridge University Press, Cambridge, 2014). 9. Ranson, M., Morris, L. Kats-Rubin, A. Climate Change and Space Heating Energy Demand: A Review of the Literature (Tech. Rep, National Center for Environmental Economics (NCEE), 2014). 10. van Ruijven, B. J., De Cian, E. Sue Wing, I. Amplification of future energy demand growth due to climate change. Nat. Commun. 10, 2762. https://​doi.​org/​10.​1038/​s41467-​019-​10399-3 (2019). 11. De Cian, E. Wing, I. S. Global energy consumption in a warming climate. Environ. Resource Econ. 72, 365–410 (2019). 12. Jones, B. et al. Future population exposure to US heat extremes. Nat. Clim. Change 5, 652–655. https://​doi.​org/​10.​1038/​nclim​ate26​ 31 (2015). 13. De Cian, E., Lanzi, E. Roson, R. Seasonal temperature variations and energy demand. Clim. Change 116, 805–825. https://​doi.​ org/​10.​1007/​s10584-​012-​0514-5 (2013). 14. Fazeli, R., Ruth, M. Davidsdottir, B. Temperature response functions for residential energy demand—A review of models. Urban Clim. 15, 45–59. https://​doi.​org/​10.​1016/j.​uclim.​2016.​01.​001 (2016). 15. Lu, N. et al. Climate Change Impacts on Residential and Commercial Loads in the Western U.S. Grid. IEEE Trans. Power Syst. 25, 480–488. https://​doi.​org/​10.​1109/​TPWRS.​2009.​20303​87 (2010). 16. Santamouris, M., Cartalis, C., Synnefa, A. Kolokotsa, D. On the impact of urban heat island and global warming on the power demand and electricity consumption of buildings-A review. Energy Build. 98, 119–124. https://​doi.​org/​10.​1016/j.​enbui​ld.​2014.​09.​ 052 (2015). 17. Damm, A., Köberl, J., Prettenthaler, F., Rogler, N. Töglhofer, C. Impacts of+ 2 c global warming on electricity demand in Europe. Clim. Serv. 7, 12–30 (2017). 18. Auffhammer, M., Baylis, P. Hausman, C. H. Climate change is projected to have severe impacts on the frequency and intensity of peak electricity demand across the United States. PNAS 114, 1886–1891. https://​doi.​org/​10.​1073/​pnas.​16131​93114 (2017). 19. Moral-Carcedo, J. Pérez-García, J. Time of day effects of temperature and daylight on short term electricity load. Energy 174, 169–183. https://​doi.​org/​10.​1016/j.​energy.​2019.​02.​158 (2019). 20. Bird, D. N. et al. Estimating the daily peak and annual total electricity demand for cooling in Vienna, Austria by 2050. Urban Clim. 28, 100452. https://​doi.​org/​10.​1016/j.​uclim.​2019.​100452 (2019). 21. Petri, Y. Caldeira, K. Impacts of global warming on residential heating and cooling degree-days in the United States. Sci. Rep. 5, 12427. https://​doi.​org/​10.​1038/​srep1​2427 (2015). 22. Coffel, E. D., Horton, R. M. Sherbinin, Ad. Temperature and humidity based projections of a rapid rise in global heat stress exposure during the 21st century. Environ. Res. Lett. 13, 014001. https://​doi.​org/​10.​1088/​1748-​9326/​aaa00e (2017). 23. Grotjahn, R. Huynh, J. Contiguous US summer maximum temperature and heat stress trends in CRU and NOAA Climate Division data plus comparisons to reanalyses. Sci. Rep. 8, 11146. https://​doi.​org/​10.​1038/​s41598-​018-​29286-w (2018). 24. Kusaka, H., Hara, M. Takane, Y. Urban Climate Projection by the WRF Model at 3-km Horizontal Grid Increment: Dynamical Downscaling and Predicting Heat Stress in the 2070’s August for Tokyo, Osaka, and Nagoya Metropolises. J. Meteorol. Soc. Jpn 90B, 47–63. https://​doi.​org/​10.​2151/​jmsj.​2012-​B04 (2012). 25. Lyon, B., Barnston, A. G., Coffel, E. Horton, R. M. Projected increase in the spatial extent of contiguous US summer heat waves and associated attributes. Environ. Res. Lett. 14, 114029. https://​doi.​org/​10.​1088/​1748-​9326/​ab4b41 (2019). 26. Bloomfield, H. Brayshaw, D. Future climate projections of surface weather variables, wind power, and solar power capacity factors across north-west Europe (2021). 27. Michel, A., Sharma, V., Lehning, M. Huwald, H. Climate change scenarios at hourly time-step over Switzerland from an enhanced temporal downscaling approach. Int. J. Climatol. 41, 3503–3522 (2021). 28. Hyndman, R. J. Fan, S. Monash electricity forecasting model (Monash University, 2015). 29. Gasparrini, A. Modelling lagged associations in environmental time series data: A simulation study. Epidemiology 27, 835–842. https://​doi.​org/​10.​1097/​EDE.​00000​00000​000533 (2016). 30. Wenz, L., Levermann, A. Auffhammer, M. North-south polarization of European electricity consumption under future warming. PNAShttps://​doi.​org/​10.​1073/​pnas.​17043​39114 (2017). 31. Ortiz, L., González, J. E. Lin, W. Climate change impacts on peak building cooling energy demand in a coastal megacity. Environ. Res. Lett. 13, 094008. https://​doi.​org/​10.​1088/​1748-​9326/​aad8d0 (2018). 32. C3S, C. C. C. S. ERA5: Fifth generation of ECMWF atmospheric reanalyses of the global climate. Copernicus Climate Change Service Climate Data Store (CDS) (2017). 33. Engle, R. F., Granger, C. W., Rice, J. Weiss, A. Semiparametric estimates of the relation between weather and electricity sales. J. Am. Stat. Assoc. 81, 310–320 (1986). 34. Indonesia, P. Power in Indonesia 2017 (Tech. Rep, PwC Indonesia, 2017).
  • 14. 14 Vol:.(1234567890) Scientific Reports | (2022) 12:4280 | https://doi.org/10.1038/s41598-022-07922-w www.nature.com/scientificreports/ 35. O’Neill, B. C. et al. A new scenario framework for climate change research: The concept of shared socioeconomic pathways. Clim. Change 122, 387–400. https://​doi.​org/​10.​1007/​s10584-​013-​0905-2 (2014). 36. O’Neill, B. C. et al. The roads ahead: Narratives for shared socioeconomic pathways describing world futures in the 21st century. Glob. Environ. Chang. 42, 169–180. https://​doi.​org/​10.​1016/j.​gloen​vcha.​2015.​01.​004 (2017). 37. McFarland, J. Impacts of rising air temperatures and emissions mitigation on electricity demand and supply in the United States: A multi-model comparison. Clim. Change 131, 111–125. https://​doi.​org/​10.​1007/​s10584-​015-​1380-8 (2015). 38. Sullivan, P., Colman, J. Kalendra, E. Predicting the Response of Electricity Load to Climate Change. Tech. Rep. NREL/TP–6A20- 64297, 1215283, National Renewable Energy Laboratory (NREL) (2015). https://​doi.​org/​10.​2172/​12152​83. 39. Bartos, M. et al. Impacts of rising air temperatures on electric transmission ampacity and peak electricity load in the united states. Environ. Res. Lett. 11, 114008 (2016). 40. Deschênes, O. Greenstone, M. Climate change, mortality, and adaptation: Evidence from annual fluctuations in weather in the us. Am. Econ. J. Appl. Econ. 3, 152–85 (2011). 41. Auffhammer, M. Aroonruengsawat, A. Simulating the impacts of climate change, prices and population on California’s residential electricity consumption. Clim. Change 109, 191–210. https://​doi.​org/​10.​1007/​s10584-​011-​0299-y (2011). 42. Waite, M. et al. Global trends in urban electricity demands for cooling and heating. Energy 127, 786–802 (2017). 43. Ralston Fonseca, F., Jaramillo, P., Bergés, M. Severnini, E. Seasonal effects of climate change on intra-day electricity demand patterns. Clim. Change 154, 435–451. https://​doi.​org/​10.​1007/​s10584-​019-​02413-w (2019). 44. Gupta, E. Global warming and electricity demand in the rapidly growing city of Delhi: A semi-parametric variable coefficient approach. Energy Econ. 34, 1407–1421. https://​doi.​org/​10.​1016/j.​eneco.​2012.​04.​014 (2012). 45. Andrijevic, M., Cuaresma, J. C., Muttarak, R. Schleussner, C.-F. Governance in socioeconomic pathways and its role for future adaptive capacity. Nat. Sustain. 3, 35–41 (2020). 46. Falchetta, G. Mistry, M. N. The role of residential air circulation and cooling demand for electrification planning: implications of climate change in sub-Saharan Africa. Energy Econ. 99, 105307 (2021). 47. Auffhammer, M. Mansur, E. T. Measuring climatic impacts on energy consumption: A review of the empirical literature. Energy Econ. 46, 522–530. https://​doi.​org/​10.​1016/j.​eneco.​2014.​04.​017 (2014). 48. Davis, L. W. Gertler, P. J. Contribution of air conditioning adoption to future energy use under global warming. PNAS 112, 5962–5967. https://​doi.​org/​10.​1073/​pnas.​14235​58112 (2015). 49. Cohen, E., Modi, V., Torbey, H., Piccirelli, M. Yu-Tian. Global trends in urban energy use. GitHub Repository (2015). 50. Thrasher, B., Maurer, E. P., McKellar, C. Duffy, P. B. Technical Note: Bias correcting climate model simulated daily temperature extremes with quantile mapping. Hydrol. Earth Syst. Sci. 16, 3309–3314. https://​doi.​org/​10.​5194/​hess-​16-​3309-​2012 (2012). 51. Taylor, K. E., Stouffer, R. J. Meehl, G. A. An overview of CMIP5 and the experiment design. Bull. Am. Meteor. Soc. 93, 485–498. https://​doi.​org/​10.​1175/​BAMS-D-​11-​00094.1 (2012). 52. Bureau of Economic Analysis, U. S. Personal income, population, per capita personal income (cainc1) (2020). 53. United Nations, D. o. E. Social Affairs, P. D. World urbanization prospects: The 2018 revision. Tech. Rep., UN DESA (2019). 54. Jones, B. O’Neill, B. C. Spatially explicit global population scenarios consistent with the shared socioeconomic pathways. Environ. Res. Lett. 11, 084003 (2016). 55. Wood, S. mgcv: Mixed gam computation vehicle with gcv/aic/reml smoothness estimation (2012). 56. Oke, T. R., Mills, G., Christen, A. Voogt, J. A. Urban climates (Cambridge University Press, 2017). 57. Maraun, D. Bias correcting climate change simulations—a critical review. Curr. Clim. Change Rep. 2, 211–220 (2016). Acknowledgements This work was supported by the Frederick S. Pardee Center for the Study of the Longer-Range Future, the Boston University Initiative on Cities, and National Science Foundation Research Traineeship (NRT) Grant No. DGE 1735087 (Y.R.), and by the U.S. Department of Energy, Office of Science, Biological and Environmental Research Program, Earth and Environmental Systems Modeling, MultiSector Dynamics, Contract No. DE-SC0016162 (I.S.W. and Y.R.). Author contributions I.S.W. and Y.R. conceived the research objectives. I.S.W. formulated the model for estimation. Data collection, results generation, and analyses were conducted by Y.R. I.S.W. reviewed results and analyses. Both authors reviewed and edited the manuscript. Competing interests The authors declare no competing interests. Additional information Supplementary Information The online version contains supplementary material available at https://​doi.​org/​ 10.​1038/​s41598-​022-​07922-w. Correspondence and requests for materials should be addressed to Y.R. Reprints and permissions information is available at www.nature.com/reprints. Publisher’s note Springer Nature remains neutral with regard to jurisdictional claims in published maps and institutional affiliations. Open Access This article is licensed under a Creative Commons Attribution 4.0 International License, which permits use, sharing, adaptation, distribution and reproduction in any medium or format, as long as you give appropriate credit to the original author(s) and the source, provide a link to the Creative Commons licence, and indicate if changes were made. The images or other third party material in this article are included in the article’s Creative Commons licence, unless indicated otherwise in a credit line to the material. If material is not included in the article’s Creative Commons licence and your intended use is not permitted by statutory regulation or exceeds the permitted use, you will need to obtain permission directly from the copyright holder. To view a copy of this licence, visit http://​creat​iveco​mmons.​org/​licen​ses/​by/4.​0/. © The Author(s) 2022, corrected publication 2022