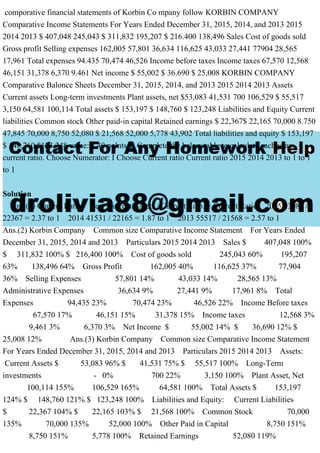
comporative financial statements of Korbin Co mpany follow KORBIN COMPANY
Comparative Income Statements For Years Ended December 31, 2015, 2014, and 2013 2015
2014 2013 $ 407,048 245,043 $ 311,832 195,207 $ 216.400 138,496 Sales Cost of goods sold
Gross profit Selling expenses 162,005 57,801 36,634 116,625 43,033 27,441 77904 28,565
17,961 Total expenses 94.435 70,474 46,526 Income before taxes Income taxes 67,570 12,568
46,151 31,378 6,370 9.461 Net income $ 55,002 $ 36.690 $ 25,008 KORBIN COMPANY
Comparative Balonce Sheets December 31, 2015, 2014, and 2013 2015 2014 2013 Assets
Current assets Long-term investments Plant assets, net $53,083 41,531 700 106,529 $ 55,517
3,150 64,581 100,114 Total assets $ 153,197 $ 148,760 $ 123,248 Liabilities and Equity Current
liabilities Common stock Other paid-in capital Retained earnings $ 22,367$ 22,165 70,000 8.750
47,845 70,000 8,750 52,080 $ 21,568 52,000 5,778 43,902 Total liabilities and equity $ 153,197
$ 148,760 $123,248 value: 2.40 polnts 1. Complete the below table to calculate each years
current ratio. Choose Numerator: I Choose Current ratio Current ratio 2015 2014 2013 to 1 to 1
to 1
Solution
Ans.(1) Current Ratio Year Current Assets / Current Liab. = Current Ratio 2015 53083 /
22367 = 2.37 to 1 2014 41531 / 22165 = 1.87 to 1 2013 55517 / 21568 = 2.57 to 1
Ans.(2) Korbin Company Common size Comparative Income Statement For Years Ended
December 31, 2015, 2014 and 2013 Particulars 2015 2014 2013 Sales $ 407,048 100%
$ 311,832 100% $ 216,400 100% Cost of goods sold 245,043 60% 195,207
63% 138,496 64% Gross Profit 162,005 40% 116,625 37% 77,904
36% Selling Expenses 57,801 14% 43,033 14% 28,565 13%
Administrative Expenses 36,634 9% 27,441 9% 17,961 8% Total
Expenses 94,435 23% 70,474 23% 46,526 22% Income Before taxes
67,570 17% 46,151 15% 31,378 15% Income taxes 12,568 3%
9,461 3% 6,370 3% Net Income $ 55,002 14% $ 36,690 12% $
25,008 12% Ans.(3) Korbin Company Common size Comparative Income Statement
For Years Ended December 31, 2015, 2014 and 2013 Particulars 2015 2014 2013 Assets:
Current Assets $ 53,083 96% $ 41,531 75% $ 55,517 100% Long-Term
investments - 0% 700 22% 3,150 100% Plant Asset, Net
100,114 155% 106,529 165% 64,581 100% Total Assets $ 153,197
124% $ 148,760 121% $ 123,248 100% Liabilities and Equity: Current Liabilities
$ 22,367 104% $ 22,165 103% $ 21,568 100% Common Stock 70,000
135% 70,000 135% 52,000 100% Other Paid in Capital 8,750 151%
8,750 151% 5,778 100% Retained Earnings 52,080 119%
47,845 109% 43,902 100% Total Liabilities and Equity $ 153,197 124% $
148,760 121% $ 123,248 100%.