2. 2.3. Sample Preparation for the Determination of
Vanadium(+5)
Approximately 0.25 g test portions of MESS-3 or PACS-2 were
accurately weighed into glass beakers and 25.0 mL 0.1 M Na2CO3
were added to each beaker. The contents of the beakers were
boiled for 10 min. After cooling, the contents were transferred to
plastic tubes without filtration and the volume of the solution
was adjusted to 25.0 mL using ultra-pure water. The same proce-
dure was followed for the leaching of V(V) compounds with
Na3PO4. In order to ensure that total V(V) was extracted, multi-
ple extractions were carried out from the same sample using
fresh portions of both 0.1 M Na2CO3 and 0.1 M Na3PO4. It was
found that a single treatment of the samples with Na2CO3 or
Na3PO4 was sufficient as the efficiency of the leaching process
using either compound was in the range 96 ± 5 % (n = 6).
2.4. Sample Preparation for the Determination of Total
Vanadium Content
Because the CRMs may hold vanadium within the crystal
lattice structure of specific minerals, complete acid digestion of
samples was carried out in order to determine the total vanadium
content. For this purpose, approximately 0.25 g test samples
were transferred to a Teflon beaker and treated on a hot plate at
about 110 °C with 5.0 mL of concentrated HF and 2.0 mL HClO4.
If digestion is not complete, a further 2.0 mL of HF and 1.0 mL of
HClO4 were added and again the mixture was heated to near
dryness. Finally, the sample was treated with 1.0 mL of HClO4
and heated until the appearance of white fumes. The residue
was then dissolved in 5.0 mL of 6.0 M HCl and diluted to 50.0 mL
using ultra-pure water. The resulting solution was analyzed by
ET-AAS (n = 6).
3. Results and Discussion
3.1. Analytical Results for Determination of Vanadium
Determination of vanadium is not a simple task using ET-AAS
as it is a refractory element, requiring rapid heating and the use
of fresh pyrolytic graphite coated tubes.13
Some problems, such
as tailing of the absorbance signal, carbide formation and acid
interferences have been encountered13–14
. Atomization of vana-
dium from a matrix with a relatively high amount of Na2CO3
was investigated using the temperature programme presented
in Table 1. It was noted that after the treatment of samples at
1600 °C for a relatively long time (20 s), atomization could be
completed in less than 5 s13
. Aomization of V from simple calibra-
tion standard solutions and solutions obtained after the treat-
ment of soil or plant samples with Na2CO3 did not differ in their
appearance time nor in the time required for complete atomiza-
tion. This phenomenon may possibly be explained as the result of
complete separation of V(V) compounds from all other metals
leached from the sample solutions but subsequently precipi-
tated as insoluble carbonates or hydroxides during treatment
with Na2CO3.
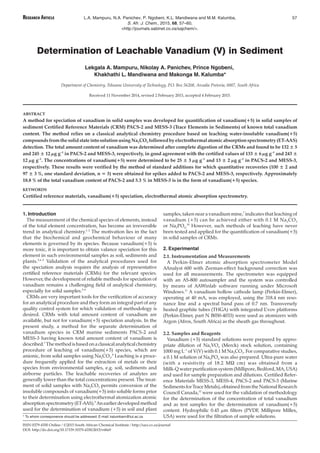
The calibration graph (integrated absorbance vs. concentra-
tion) is described by the equation y = 0.0001x + 0.0018 with
regression coefficient R2
= 0.9983; linearity is maintained up to
aconcentrationof2500µgL–1
ofvanadium.Thetimeevolutionof
the signals is presented in Fig. 1. The accuracy of this analytical
technique was validated by the determination of total vana-
dium in the CRMs. Results are summarized in Table 2, from
which it may be concluded that overall performance is very
satisfactory.
The limit of detection (LOD) for determination of vanadium,
calculated as the concentration corresponding to a signal equal
to 3 times the standard deviation of the integrated absorbance
from the blank solution, was established using solutions of 0.1 M
Na2CO3 as a blank.15
The LOD was calculated to be about 5 µg L–1
for a 10 µL sample aliquot (n = 11). With respect to the solid
samples, assuming that 0.25 g of material was used for digestion
and the leachates diluted to a final volume of 25.0 mL, the LOD
was estimated to be 0.5 µg g–1
.
3.2. The effect of Leaching Time
Leaching of vanadium(+5) compounds was tested by boiling
0.25 g test portions of the solid CRMs with 25.0 mL of 0.1 M
RESEARCH ARTICLE L.A. Mampuru, N.A. Panichev, P. Ngobeni, K.L. Mandiwana and M.M. Kalumba, 58
S. Afr. J. Chem., 2015, 68, 57–60,
<http://journals.sabinet.co.za/sajchem/>.
Figure 1 Calibration graph (integrated absorbance vs. concentration).
Table 1 Thermal programme for the determination of vanadium using
ET-AAS
Step Temperature/°C Ramp/s–1
Hold/s–1
Internal gas
flow/mL min–1
1 120 1 10 250
2 250 5 10 250
3 1800 5 20 250
4 2600 0 5 0
5 2600 1 3 250
3. Na2CO3 for 30 min. The first test aliquot analysed (1.0 mL of the
solution) was taken immediately after the boiling point was
reached and the following samples, also 1.0 mL volume, were
taken every 5 min in such a manner that the ratio between mass
of solid sample and the volume of extracting solution was kept
constant (by addition of a fresh portion of 0.1 M solution of
Na2CO3). The same procedure was followed for the leaching of
V(V) compounds using Na3PO4. The results presented in Fig. 2
show that extraction of vanadium(+5) compounds from both
CRMs could be completed after 10 min of boiling.
3.3. Efficiency of Leaching
In order to ensure that the total amount of vanadium(+5) were
extracted, multiple extractions were carried out on the same
sample using fresh portions of either 0.1 M Na2CO3 or 0.1 M
Na3PO4. For this purpose, mixtures of 0.25 g of solid CRM and
25.0 mL of Na2CO3 were boiled for 10 min. After filtration, the
solid residue was treated with a fresh portion of 25.0 mL 0.1 M
Na2CO3 for the second time and, once again, for a third time. The
efficiency of the leaching process based on the ration of results
for the first extraction to those of the sum of all extractions using
either 0.1 M Na2CO3 or 0.1 M Na3PO4 was in the range 97 ± 5 %
as shown in Fig. 3. The second extraction step did not yield more
than 2 % of the remaining total V in the samples.
3.4. Validation of Results
In order to validate this methodology for the determination of
vanadium (+5), 12 sub-samples of each CRM were prepared.
Three samples were treated with 0.1 M Na2CO3 solution without
additionofspikesandtheaveragequantityofvanadiumobtained
was taken as a base value14
. Subsequently, increasing quantities
of V(V) were added to other aliquots and vanadium (+5) was
determined according to the recommended procedure. Quanti-
tative spike recoveries of 100 ± 3 and 98 ± 4 % (one standard
deviation, n = 3) were obtained for PASC-2 and MESS-3, respec-
tively. The concentrations of vanadium (+5) in PACS-2 and
MESS-3, summarized in Table 3, were determined to be 25 ± 3
and 13 ± 2 µg g–1
, respectively.
RESEARCH ARTICLE L.A. Mampuru, N.A. Panichev, P. Ngobeni, K.L. Mandiwana and M.M. Kalumba, 59
S. Afr. J. Chem., 2015, 68, 57–60,
<http://journals.sabinet.co.za/sajchem/>.
Figure 2 Results of extraction of vanadium(+5) compounds after 10 min boiling.
Table 2 V(V) and Vtotal determination in certified reference materials,
µg g–1
.
CRM V(V) Vtotal
Found value Certified value Found value Certified value
(µg g–1
) (µg g–1
) (µg g–1
) (µg g–1
)
n = 3 n = 3 n = 3
MESS-3 16.0 ± 1.3 – 233 ± 3.2 234 ± 10
PACS-2 28.0 ± 1.5 – 125 ± 2.5 133 ± 5
Figure 3 Comparison of the efficiency between sodium carbonate (n) sodium phosphate (o) as V(V) leaching agents (n = 3).
4. 4. Conclusion
A simple, fast, sensitive and accurate method for vanadium
(+5) speciation in solid samples of PACS-2 and MESS-3 marine
sediment CRMs has been developed. The method is based on
leaching of V(+5) with either 0.1 M Na2CO3 or 0.1 M Na3PO4
followed by determination using ET-AAS. The results show
that 18.8 % of the total amount of vanadium present in
PACS-2 and 5.3 % in ESS-3 are in the form of vanadium (+5)
species.
References
1 R. Cornelis, H. Crews, O.F.X. Donard and L. Ebdon, Trends in certi-
fied reference materials for the speciation of trace elements, Fresenius
J. Anal. Chem,. 2001, 370, 120–125.
2 J. Feldmann, A. Elgazali, M.F. Ezzeldin, Z. Gajdosechova, E. Krupp,
F. Aborode, M.M. Lawan, A. Raab, A.H. Petursdottir and K. Amayo,
Microwave-Assisted Sample Preparation for Trace Element Analysis,
Elsevier, Amsterdam, 2014, pp. 281–312.
3 J. Nriagu (Ed), Vanadium in the Environment: Part 2, Health Effects, John
Wiley & Sons, New York, Chichester, Weinheim, Brisbane, Singapore,
Toronto, 1998.
4 B. Mukerjee, B. Patra, S. Mahapatra, P. Banerjee, A. Tiwari and
M. Chatterjee Vanadium – an element of atypical biological signifi-
cance, Tox. Lett., 2004, 150, 135–143.
5 F.L. Assem and A. Oskarsson, Handbook on the Toxicology of Metals,
vol. 2, 4th edn., Elsevier, London, 2015, pp. 1347–1367.
6 P. Quevauviller, Operationally defined extraction procedures for soil
and sediment analysis I. Standardization, Trends Anal. Chem., 1998,
17, 289–298
7 N. Panichev, K. Mandiwana, D. Moema, R. Molatlhegi and
P. Ngobeni, Distribution of vanadium(V) species between soil and
plants in the vicinity of vanadium mine, J. Hazard. Mater., 2006, 137,
649–653
8 L. Ebdon, L. Pitts, R. Cornelis, H. Crews, O.F.X. Donard and
P. Quevauviller, Trace Element Speciation for Environment and, Food and
Health, Royal Society of Chemistry, Cambridge, 2001.
9 K. Mandiwana and N. Panichev, Electrothermal atomic absorption
spectrometric determination of vanadium (V) in soil after leaching
with Na2CO3, Anal. Chim. Acta, 2004, 517, 201–206.
10 K.L. Mandiwana, N. Panichev and R. Molathlegi, The leaching of V
(V) with PO43–
in the speciation analysis of soil, Anal. Chim. Acta,
2005, 545, 239–243.
11 N. Panichev, K. Mandiwana, M. Kataeva and S. Siebert, Determina-
tion of Cr(VI) in plants by electrothermal atomic absorption spec-
trometry after leaching with sodium carbonate, Spectrochim. Acta, B,
2005, 60, 699–703
12 National Research Council Canada, http://www.nrccnrc.gc.ca/eng/
solutions/advisory/crm/inorganic/list_products.html, accessed 14
July 2014
13 B. Welz and M. Sperling, Atomic Absorption Spectrometry, 3rd edn.,
Wiley’s Publishers, Weinheim, 1999, pp. 323–332.
14 D.C. Manning and W. Slavin, Factors influencing the atomization of
vanadium in graphite furnace AAS, Spectrochim. Acta Part, B, 1985, 40,
461–473.
15 J.N. Miller and J.C. Miller, Statistics and Chemometrics for Analytical
Chemistry, Pearson Education, Edinburgh Gate, Harlow, UK, 2005.
RESEARCH ARTICLE L.A. Mampuru, N.A. Panichev, P. Ngobeni, K.L. Mandiwana and M.M. Kalumba, 60
S. Afr. J. Chem., 2015, 68, 57–60,
<http://journals.sabinet.co.za/sajchem/>.
Table 3 Results of vanadium (V), vanadium (IV) and total vanadium in CRMs after leaching with Na2CO3.
Sample V(V) V(IV) Total vanadium found Total vanadium certified
(µg g–1
) n = 3 (µg g–1
) n = 3 (µg g–1
) n = 3 (µg g–1
) n = 3
MESS-3 13 ± 2 220 ± 15 233 ± 13 246 ± 12
PACS-2 25 ± 3 100 ± 7 125 ± 11 135 ± 5