Taking Efficiency to Scale: Spread of a Delegate Model in an FQHC
•
1 like•366 views

A large rural federally qualified health center (FQHC) in Maine seeks to increase access to and quality of care through decreasing variability in efficiency and panel sizes among its primary care teams across 5 of 17 sites through spread of a "delegate model." Secondary objectives are to enhance provider and team job satisfaction, increase team function, and decrease provider and staff burnout.

Recommended
More Related Content
What's hot
What's hot (18)
Viewers also liked
Viewers also liked (15)
Similar to Taking Efficiency to Scale: Spread of a Delegate Model in an FQHC
Similar to Taking Efficiency to Scale: Spread of a Delegate Model in an FQHC (20)
More from JSI
More from JSI (20)
Recently uploaded
Recently uploaded (20)
Taking Efficiency to Scale: Spread of a Delegate Model in an FQHC
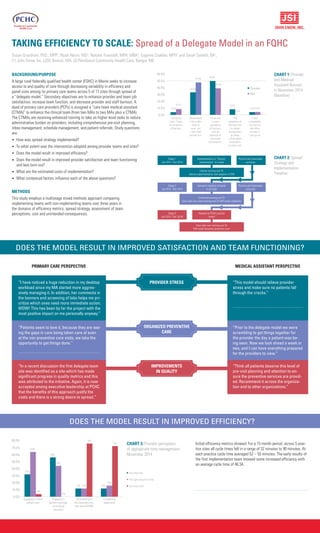
- 1. TAKING EFFICIENCY TO SCALE: Spread of a Delegate Model in an FQHC Susan Grantham, PhD., MPP1 , Noah Nesin, MD2 , Natalie Truesdell, MPH, MBA1 , Eugenie Coakley, MPH1 and Sarah Genetti, BA1 , (1) John Snow, Inc. (JSI), Boston, MA, (2) Penobscot Community Health Care, Bangor, ME BACKGROUND/PURPOSE A large rural federally qualified health center (FQHC) in Maine seeks to increase access to and quality of care through decreasing variability in efficiency and panel sizes among its primary care teams across 5 of 17 sites through spread of a “delegate model.” Secondary objectives are to enhance provider and team job satisfaction, increase team function, and decrease provider and staff burnout. A dyad of primary care providers (PCPs) is assigned a “care team medical assistant (CTMA)” to enhance the clinical team (from two MAs to two MAs plus a CTMA). The CTMAs are receiving enhanced training to take on higher level tasks to reduce administrative burden on providers, including comprehensive pre-visit planning, inbox management, schedule management, and patient referrals. Study questions are: • How was spread strategy implemented? • To what extent was the intervention adopted among provider teams and sites? • Does the model result in improved efficiency? • Does the model result in improved provider satisfaction and team functioning and less burn out? • What are the estimated costs of implementation? • What contextual factors influence each of the above questions? METHODS This study employs a multistage mixed methods approach comparing implementing teams with non-implementing teams over three years in the domains of efficiency metrics, spread strategy, assessment of team perceptions, cost and unintended consequences. CHART 1: Provider and Medical Assistant Burnout in November 2014 (Baseline) I enjoy my work. I have no symptoms of burnout. Occasionally I am under stree at work, but I don’t feel burned out. I have one or more symptoms of burnout, such as physical or emotional exhaustaion. The symptoms of burnout that I’m experi- encing won’t go away. I think about frustations at work a lot. I feel completetly burned out and often wonder if I can go on. 0.0% 10.0% 20.0% 30.0% 40.0% 50.0% 60.0% Provider MA 4.2% 8.7% 33.3% 47.8% 50.0% 39.1% 8.3% 0.0% 4.2%4.3% CHART 2: Spread Strategy and Implementation Timeline Too little time The right amount of time Too much time 0.0% 10.0% 20.0% 30.0% 40.0% 50.0% 60.0% 70.0% 80.0% Engaging in direct patient care 32% 64% 4% 56% 44% 0% 12% 12% 76% 12% 16% 72% Engaging in patient teaching/ counseling/ education Documenting to the electronic me- dial record (EMR) Completing paperwork CHART 3: Provider perception of appropriate time management November 2014 DOES THE MODEL RESULT IN IMPROVED SATISFACTION AND TEAM FUNCTIONING? Initial efficiency metrics showed: For a 15 month period, across 5 prac- tice sites all cycle times fell in a range of 32 minutes to 90 minutes. At each practice cycle time averaged 52 – 55 minutes. The early results of the first implementation team showed some increased efficiency with an average cycle time of 46:34. PRIMARY CARE PERSPECTIVE MEDICAL ASSISTANT PERSPECTIVE “I have noticed a huge reduction in my desktop workload since my MA started more aggres- sively managing it. In addition, her comments in the banners and screening of labs helps me pri- oritize which ones need more immediate action. WOW! This has been by far the project with the most positive impact on me personally anyway.” “Patients seem to love it, because they are see- ing the gaps in care being taken care of even at the non preventive care visits, we take the opportunity to get things done.” “In a recent discussion the first delegate team site was identified as a site which has made significant progress in quality metrics and this was attributed to the initiative. Again, it is now accepted among executive leadership at PCHC that the benefits of this approach justify the costs and there is a strong desire to spread.” “This model should relieve provider stress and make sure no patients fall through the cracks.” “Prior to the delegate model we were scrambling to get things together for the provider the day a patient was be- ing seen. Now we look ahead a week or two, and I can have everything prepared for the providers to view.“ “Think all patients deserve this level of pre-visit planning and attention to en- sure the preventive services are provid- ed. Recommend it across the organiza- tion and to other organizations.” Stage 1 Jan 2014 - Dec 2014 Implementation in “Champi- onship teams” in 5 sites Positive and observable outcomes Intense training and TA intense experimentation and adaption of DM Positive and observable outcomes Spread to majority of teams in all sites Continued training and TA Sites take over some training and TA DM model stabalizes Stage 2 Jan 2015 - Dec 2015 Adopted as PCHC practice model Sites take over training and TA DM model becomes ptractices norm Stage 3 Jan 2016 - Dec 2016) DOES THE MODEL RESULT IN IMPROVED EFFICIENCY? PROVIDER STRESS ORGANIZED PREVENTIVE CARE IMPROVEMENTS IN QUALITY