Play hard learn harder: The Serious Business of Play
Financial performance analysis of nano power bangladesh a case study
1. Page | 1
Thesis
On
“Financial Performance Analysis of NanoPower Bangladesh: A Case
Study”
(Thesis submitted in partial fulfillment for the degree of Masters of Business Administration
(MBA) with a major in Finance)
Prepared by:
Md. Jahid Hassan
ID: 027 – 45 – 05
Program: Masters of Business Administration
Major: Finance & Banking
Department of Business Administration
Southern University Bangladesh
Supervised by:
Dr. Kamrul Hasan
Assistant Professor
Department of Business Administration
Southern University Bangladesh
Date of Submission: February 13, 2017
Faculty of Business Administration
Southern University Bangladesh
2. Page | 2
Chapter -1: Introduction
1.1 Introduction
1.2 Statement of the Problem
1.3 Objective of the Study
1.4 Scopeof the Study
1.5 Methodology of the Study
1.5.1 Collection of Primary Data
1.5.2 Collection of SecondaryData
1.5.3 Data Collection Procedure
1.6 Limitation of the Study
1.7 Outline of the Thesis
3. Page | 3
1.1 Introduction:
Renewable energy is energy that is collected from renewable resources, which are naturally
replenished on a human timescale, such as sunlight, wind, rain, tides, waves, and geothermal
heat. Renewable energy often provides energy in four important areas: electricity generation,
air and water heating/cooling, transportation, and rural (off-grid) energy services.
Popular sources of renewable energies are:
Biomass—includes:
o Wood and wood waste
o Municipal solid waste
o Landfill gas and biogas
o Ethanol
o Biodiesel
Hydropower
Geothermal
Wind
Solar
Presently solar and wind based renewable energy sources are most popular among other
sources. Being the most cheapest and versatile source of energy, many governments around
the world suggest and encourage its citizen to use solar based renewable energy.
Government of Bangladesh also took initiative to ensure, that our country can also reap the
benefit of solar based renewable energy. Bangladesh Power Development Board (BPDB) is
the organization, in charge of implementing the renewable energy policy taken by the
government. BPDB works alongside with many NGOs like Grameen Shakti and other
privately owned organization, for installation and maintenance of solar panel in rural areas.
NanoPower Bangladesh shares the similar vision of Bangladesh government in the field of
renewable energy. NanoPower Bangladesh established in 2008 and listed in 2010 as a
registered contractor under BPDB, for installing solar panel in large industry to small home
user.
1.2 Statement of the Problem:
In every research program, there always remain some problems. For this thesis, it is also true.
Many developed country using renewable energy for a long time. They have their own
industry benchmark for operational performance for companies, who are involved in business
of renewable energy, directly or indirectly. Renewable energy is a relatively new idea for
Bangladesh. So there is no industry benchmark of operational performance of companies,
which are involved in business of renewable energy. This thesis is mostly concentrate on the
operational performance of NanoPower Bangladesh. And partially serve, as to create a
performance benchmark in the field of renewable energy business.
4. Page | 4
1.3 Objective of the Study:
The main objective of the study is to critically evaluate the operational performance of
NanoPower Bangladesh. To achieve this main objective the study covers the following
specific objects:-
1. To highlight the procedures of operational performance evaluation.
2. To evaluate the liquidity position of NanoPower Bangladesh.
3. To measure the solvency position of NanoPower Bangladesh.
4. To assess the efficiency position of NanoPower Bangladesh.
5. To evaluate the profitability position of NanoPower Bangladesh.
6. To identify the problems involved in financial performance of NanoPower
Bangladesh.
7. To provide policy recommendations for better performance of NanoPower
Bangladesh.
1.4 Scope of the Study:
The report covers the organization financial performance evaluation of NanoPower
Bangladesh. From four points of view, these are:
1. Liquidity Position,
2. Solvency Position,
3. Efficiency management,
4. Profitability position,
To work with these four sections I have acquired the knowledge about the financial activities
execution done by the NanoPower Bangladesh.
1.5 Methodologyof the Study:
The study requires a systematic procedure from selection of the topic to final preparation. To
perform the study, the data sources are identified and collected, these are classified, analyzed,
interpreted and presented in a systematic manner and key points have been found out. The
overall processes of methodology are given below. I used both primary and secondary data to
complete my report.
1.5.1 Collection of Primary Data:
The area of the study covered the operational performance of NanoPower Bangladesh,
currently operating from Halishahar I/A, Chittagong.
Face-to-face conversation with the respective owner and staffs.
Informal conversation with the clients.
Practical work exposures from the different section of the factory area.
Relevant file study as provided by the staffs concerned.
5. Page | 5
1.5.2 Collection of Secondary Data:
1) Annual Report of NanoPower Bangladesh.
2) Various books, articles, compilations etc. regarding operational performance of
industries.
1.5.3 Data Collection Procedure:
Annual Reports of the NanoPower Bangladesh.
Different books, articles etc. regarding industrial financial performance analysis.
1.6 Limitation of the Study:
In every research program, there always remain some limitations. I also deal with some
limitations in pursuing the thesis report work. The limitations of the research paper are as
follows:
Time was not sufficient for such type of analysis.
My personal limitation that is working whole day it is very difficult to study.
Field work need group discussion but I failed to arrange regular group discussion.
Lack of information due to the policy of the company of keeping all the information
confidential,
Inadequate knowledge on contemporary terms of the company’s business
representatives.
Insufficient time due to the congested corporate schedule and exam schedule,
Lack of knowledge about the real life business,
Insufficient published information and reluctance about providing those by the
company.
1.7 Outline of the Thesis:
Chapter - 1: Introduction
Chapter - 2: Tools & techniques used in analysis financial statements.
Chapter - 3: Liquidity analysis of NanoPower Bangladesh.
Chapter - 4: Solvency analysis of NanoPower Bangladesh.
Chapter - 5: Efficiency position analysis of NanoPower Bangladesh.
Chapter - 6: Profitability analysis of NanoPower Bangladesh
Chapter - 7: Problems involved in financial performance of NanoPower Bangladesh.
Chapter - 8: Summary of findings, Policy Recommendations and Conclusion.
6. Page | 6
Chapter - 2: Tools and Techniques Used in
Financial Statement Analysis
2.1 Tools and Techniques of Financial Analysis
2.2 Devices Used In Analyzing Financial Statements
2.3 Comparative Financial Statements
2.4 Comparative Balance Sheet
2.5 Comparative Income Statement
2.6 Trend Analysis
2.7 Common-Size Statements
2.8 Ratio Analysis
o 2.8.1 Ratio
o 2.8.2 Role of Ratio Analysis
o 2.8.3 Analysis and Interpretation of Ratios
o 2.8.4 Merits of Ratio Analysis
o 2.8.5 Limitations of Raito Analysis
o 2.8.6 Profitability Ratios
o 2.8.7 Solvency Ratios
o 2.8.8 Efficiency and Performance Ratios
2.9 Funds Flow Analysis
o 2.9.1 Use of Funds Flow Statement
o 2.9.2 Limitations of Funds Flow Statement
2.10 Statement of Changes on Working Capital
7. Page | 7
2.1 Tools and Techniques of Financial Analysis:
The body of information describing even the smallest firm is enormous, spanning the
company’s internal operations and its relations with the outside. To be useful this information
must be organized into an understandable, coherent and sufficiently limited set of data.
Financial statement analysis can be very helpful in this respect because it highlights the
performance of the business.
The purpose of financial analysis is to diagnose the current and past financial condition of a
firm and to give some clues about its future condition.
Eugene F. Brigham opines that “ from an investor’s standpoint predicting the future is what
financial statements analysis is all about from management’s standpoint financial statement
analysis is useful both as a way to anticipate future conditions and more important point for
planning actions that will influence the future course of events.
Analysis of financial statements is an exercise in the re-arrangement of complex accounting
reports into simplified information.
The analysis and interpretation is essential to bring out the mystery behind the figures in
financial statements.
2.2 Devices UsedIn Analyzing FinancialStatements:
Various methods are used to study the relationship between different statements. An effort is
made to use those devices which clearly analyze the financial position of the enterprise. The
following methods of analysis are generally used.
1. Comparative financial statements
2. Trend analysis
3. Common size statements
4. Ratio analysis
5. Funds flow analysis
2.3 Comparative Financial Statements:
The comparative financial statement will provide a comparison between two stipulated
periods for an organization. It will also provide a comparison for two or more enterprises for
one or more accounting periods. These statements are designed to disclose:
a. Absolute figures,
b. Changes in absolute figures,
c. Absolute date in terms of percentages and
d. Changes in terms of percentages.
Comparative figures will indicate the trend and direction of financial position and operating
results. The two comparative statements are balance sheet and income statement of an
organization.
8. Page | 8
2.4 Comparative Balance Sheet:
It represents not merely the balance of accounts drawn on two different dates but also the
extent of their increase or decrease between these two dates. It focuses on the changes that
have taken place in one accounting period. The changes are the direct outcome of Operational
activities.
2.5 Comparative Income Statement:
The comparative income statement gives an idea of the progress made of a business over a
period of time. The changes in absolute money values and percentages can be determined to
analysis the profitability of the business.
2.6 Trend Analysis:
The financial statement may be analyzed by computing trends of series of information. This
method determines the direction of change over the period. It involves the computation of the
percentage relationship that each item in the statement bears to the same item in the base
year. The information for a number of years is taken up and the first year is taken as the base
year. The figures of base year are taken as 100 and trend ratios for the subsequent years are
calculated on the basis of base year. The analyst is able to ascertain the trend of figures
upward or downward.
Trend analysis includes the selection of a representative period as a base and expressing all
items in the financial statements of the periods studied in terms of an index.
2.7 Common-Size Statements:
When the balance sheet and income statement items are shown in analytical percentages i.e.,
percentages that each item bears to the total of the appropriate item such as total assets, total
liabilities, capital and net sales, the common base for comparison is provided. The statements
compiled in this form are termed as common size statements.
Common-size income statement shows each item as a percentage of sales and a common size
balance sheet shows each item as a percentage of total assets. The significant advantage of
common size statements is that they facilitate comparisons of balance sheets and incomes
statements and across companies.
2.8 Ratio Analysis:
Ratio analysis is a powerful tool of financial analysis. Its application to financial statement
however appears to be of recent origin. The construction of ratios is a major analytical tool in
the hands of financial executives. The ratios facilitate the analysis in pointing out the relative
importance of the various items appearing in the financial statements. Each major item in the
balance sheet and profit and loss account has a relationship with one or more items in either
or both statements which one or more items in either or both statements which can be
expressed in ratios. But using ratios comparison with financial statements of other firms is
9. Page | 9
facilitated and comparison of firm’s financial performance can too be made over a period of
time.
2.8.1 Ratio:
Ratio is simply one number expressed in terms of another. It is an expression of relationship
spelt out by dividing one figure into the other. The relationship between two figures
expressed mathematically is called a ratio.
As per the dictionary meaning represents the relation of one thing on another of which the
quotient is the measure.
According to J.Batty, the term accounting ratio is used to describe the significant relationship
between figures in a balance sheet Profit and loss account in budgetary control, system or any
other part of accounting organizations.
Financial ratios portray relationship that exists between various items appearing in balance
sheets and income accounts and occasionally other items. They may be expressed in simple
mathematical terms. They are used to measure and evaluate the financial condition and
operating effectiveness of a business enterprise.
Ratios provide the analyst with a set of summary which measures of the firm’s debt burden,
operating efficiency and profitability.
Financial ratios are no substitute for a crystal ball. They are just a convenient way to
summaries large quantities of financial data and to compare firm’s performance.
2.8.2 Role of Ratio Analysis:
Ratio analysis means the process of computing, determining and presenting relationship of
items groups of items in the financial statement. It is a device to diagnose the financial disc
ease of enterprise.
A Single ratio in itself is meaningless- it does not furnish a complete picture. It become
meaningful only when compared with other ratios or the same ratios over a period of time,
The ratios are diagnostic tests. A single diagnostic test does not provide adequate information
about a company to evaluate its current conditions. Therefore, many diagnostic tests are used
to obtain a complete picture.
Ratio analysis is a convenient means of focusing the attention of the analyst on specific
relationship which require further investigation. Ratio analysis of business enterprise centers
on efforts to derive quantitative measures or guides concerning the expected capacity of the
firm to meet its future financial obligations. The final accounts for any period bring to light
many figures which sometimes appear to be quite unconnected with one another, but if
brought together in a particular manner, they reveal many interesting relations with one
another. These results show peculiar trends in business. Ratio analysis is the best available
means to relate these figures together.
10. Page | 10
Ratio analysis is also defined as the process of establishing and interpreting various ratios for
helping in making certain decisions.
2.8.3 Analysis and Interpretation of Ratios:
Analysis is the dissection of a complex statement into elements and varied compartments.
Whereas interpretation brings out the means of such statements with the help of analysis.
There are four different ways in which may be interpreted.
1. The individual ratio, by itself may have significance of its own. Thus, if the current
ratio falls constantly and even goes below one. It may indicate that the liquidity
position of the concern is not encouraging.
2. Ratios may be interpreted by expanding the analysis and considering a group of
several related ratios. In this way, the ratio whose significance is not fully understood
is made more meaningfully by the computation of additional ratio like the profitability
ratios.
3. The ratios may be compared over time. Moreover the same ratio or a group of ratios is
studied over a period of years which indicates significant trends like increase or
decrease in stability, etc.
4. The ratio of any given firm may be compared with the ratio of other firms in the same
industry known as inter firm comparison. Such comparisons are significant as
members of the same industry face similar financial problems.
2.8.4 Merits of Ratio Analysis:
Ratios give a better idea than the absolute figures placed side by side. Ratios become
meaningful when compared with other ratio or with ratios of similar firms. It is an effective
tool in controlling the entire business and planning for the future needs.
1) The merits of ratio analysis are:
2) Ratio analysis simplifies the comprehension of financial statements.
3) Ratio portrays the store of changes in the financial position of the business.
4) It provides data for inter firm comparison by which one firm can improve its financial
standing and compete successfully with another.
5) Ratios highlight the factors associated with successful and unsuccessful firms.
6) Ratio analysis also makes possible comparison of the performance of the same unit
over a period of time. They are helpful in deciding about the efficiency or otherwise,
in the past and likely performance in future.
7) Ratio analysis helps in planning and forecasting the future activities of the firm.
8) Over a period of time, a firm or industry develops certain norms that may indicate
future success or failure. Ratios are effective clues as to whether success may result if
the same norms are followed.
11. Page | 11
2.8.5 Limitations of Raito Analysis:
Ratio analysis conducted in a mechanical manner is dangerous. However, used intelligently
and with good judgment ratios can provide useful insights into firm’s operations.
Quantitative relations of the kind represented by ratio analysis are not ends in themselves, but
are only means provided for understanding a firm’s financial posting. Quantitative ratio
analysis is not capable of providing precise answers to all the problems faced by a financial
manager or a potential fund supplier unless several ratios often to one another are computed
and compared.
Various limitations of ratios are as follows:
1. Ratios are meaningless by it and acquire significance only when they are studied
along with other ratios.
2. Ratio analysis focuses on the accounting data some of which at times turnout to be
mere estimates. Any analysis based on the estimated figures, lacks precision
which is very essential for the successful implementation of the physical as well
as monetary targets.
3. Ratios provide only a part of the information needed in the process of decision-
making. The information derived from the ratios must be used with that obtained
from other sources so as to ensure a balanced approach in solving the problems.
4. Ratio analysis suffers from the serious limitations of the statistical concepts such
as determination of proper standard for comparison, absence of the homogeneity
of the data and danger of fallacious conclusions.
5. Financial analysis based on accounting ratios will give misleading results it the
effects of changes in price level are not taken into account.
6. The qualitative factors which are important for the successfully functioning of the
organization are completely ignored by the ratio analysis and hence, the
conclusions drawn may get distorted.
Ratio analysis is indeed, a double edged sword which requires a great deal of understanding
and sensitivity of the management process rather than mechanical financial skill. But even
with these limitations and problems the use of ratios to indicate future trends in business has
increased to a great extent. Ratios calculated from the available data in the financial statement
may be classified as follows:
2.8.6 Profitability Ratios:
Profitability ratios measure the efficiency of the company’s activities and its ability to
generate profits. Poor performance indicates the failure of the business which may lead
liquidation of the company in the long run.
2.8.7 Solvency Ratios:
These ratios examine the adequacy of funds and the company’s ability to pay its obligations
when it becomes due. These ratios measure the short-term solvency of the company.
12. Page | 12
2.8.8 Efficiency and Performance Ratios:
These ratios indicate the effective utilization of various assets and funds invested by the
creditors and shareholders. The better the management of funds and assets the larger the
amount of sales, and hence the profits of the company.
2.9 Funds Flow Analysis:
The limitations of financial statements forced the need for a separate additional financial
statement to highlight of the major financing and investment activities of a firm known as
funds statement. It summarizes various sources from which funds are obtained and uses to
which they have been applied.
The concept of ‘Funds’ refers to ‘Net working Capital’. Any increase in the net working
capital is a source of fund and any decrease in working capital becomes an application of
fund. The various sources form which funds derived is:
1. Operations of business
2. Income from investment
3. Sales of fixed assets and long-term investments
4. Subscription by shareholders
5. Increase in long-term debts.
6. The Funds so derived by a business concern are applied in the following ways:
a. Operating losses
b. Redemption of long-term loans and debentures
c. Redemption of Redeemable preference share capital
d. Payment of cash dividend
7. Acquisition of fixed assets
8. Purchase of investment.
The flow of funds refers to movement of funds involving ‘inflow’ and ‘outflow’ in the
working capital. This happens when changes occur in non-current accounts such as fixed
assets, long-term debts etc., and are offset by corresponding changes in current accounts such
as current assets of current liabilities.
The funds flow statement which is popularly as ‘Statement of Sources and Application of
Funds’ focuses on the flow of funds between various assets and equity items during an
accounting period. It reveals the manner in which the financial resources have been obtained
and utilized during an accounting period.
Funds flows statements provide an additional perspective on the nature of the financial
condition of a company.
Funds flow analysis is a decisional display of management’s dispositions of short and long-
term funds available for operations and investment.
13. Page | 13
A statement of changes in financial position is a derivative financial statement that shows the
amount by which each item on successive balance sheets have changed and in addition
indentifies the reasons for the change.
A more accurate and useful analysis of changes in the distribution of resource between
balance sheet dates is found in the statement of the sources and application of funds.
2.9.1 Use of Funds Flow Statement:
It is through analysis of this statements a proper understanding of the changes in the
distribution of resources between the two balance sheets can be had.
The funds statement shows the financial consequence of business operations. It is quite
possible that a concern may operate profitably without any improvement in the liquidity
position. This is wholly due to the fact that all economic values do not possess the dame
financial flexibility as cash and related resources. The fund flow statement reveals such
irreconcilable situations.
This statement is useful to the lenders such as banks and other financial institutions, as it
indicates them the liquidity position of the firm and its ability to pay interest regularly and
return the principle sum.
It serves as instrument for allocation of resources when the business concern launches their
future expansion as well as diversification programs, the need for arrangement of the funds
arises. The amount of funds made available through normal business operations is ascertained
through the projection of the funds flow analysis.
The funds flow statements shows the urgencies of operational issue and facilitates settlement
of priorities in a phased manner.
This statement indicates the effectiveness of the management in the handling of the working
capital during the accounting period. It also helps the management in deciding whether to
issue more of equity shares or increase long-terms debts. In short, the funds statements help
the management in the decision-making process in case of expansion, diversification or
conservation of more funds for profitable utilization on sound projects in subsequent years.
2.9.2 Limitations of Funds Flow Statement:
While the managerial uses of the funds statement cannot be underestimated the use of it as
tool by the financial analyst should be done with utmost care and caution.
Though the funds statement furnishes factual information mot supplied by the traditional
financial statement the fact that it ignores non-fund transactions, makes it a dangerous tool
for application in financial analysis.
The funds statement is prepared on the basis of the figures form financial statement already
prepared and hence, does not introduce an element of original evidence to financial changes
or status.
14. Page | 14
Any projection of flow statement based on the figures from the two balance sheets deals with
the past and becomes historical in nature.
In spite of the above limitations the funds flow statement is of immense use to the
management, in providing the information not furnished by the traditional financial statement
and helps in the decision making process affecting the source of any business unit.
2.10 Statement of Changes on Working Capital:
In the funds statements the different between the total of source and the total of applications
constitute either increase or decrease in the working capital for the accounting period under
review. This variation in working capital is verified through a separate statement depicting
changes in working capital. This statement shows the current assets and current liabilities at
the beginning and end of the accounting period and the net effect of their changes between
two periods on the working capital.
The primary purpose of this Chapter is to discuss the techniques used by investors, creditors
and managers to analyze the financial statements of a business. Financial analysis is designed
to determine strengths and weakness of firm whether the firm is financially sound and
profitable relative to other firms in its industry and whether its position improving or
deteriorating overtime. The study of financial analysis of SIVL concentrated on a set of ratios
designed to highlight the key aspects of its operations. Funds flow statement analysis was
also included to assess the changes in financial position of the unit under study.
15. Page | 15
Chapter – 3: Liquidity Analysis
3.1 Current Ratio
3.2 Quick Ratio
3.3 Cash Ratio
3.4 Net Working Capital to Total Asset Ratio
16. Page | 16
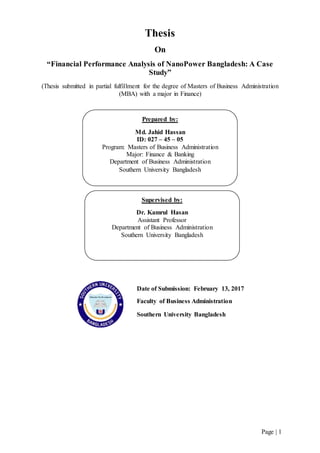
2015 2014 2013 2012 2011
Current Ratio 4.71 4.22 5.67 5.62 7.04
4.71
4.22
5.67 5.62
7.04
0.00
1.00
2.00
3.00
4.00
5.00
6.00
7.00
8.00
Current Ratio
Analysis: The current ratio is a liquidity ratio that measures a company's ability to pay short-term and
long-term obligations.
From the examination of above table, it has been observed that the company has a gradual increase in
both current asset and liabilities, from FY2011 to FY2103. This indicates that the company had a
favorable business growth. In FY2014 the company faced a decrease in current asset, but continuous
increase in current liabilities. This implies that the company performed poor in 2014. But in FY2015 the
company was able to increase its current assets. This implies that company was performing better in 2015.
But from the line graph analysis, it has been found that the company has a decreasing current ratio. This
implies that the company has been losing it ability to meet its long-term and short-term obligation.
Table – 1: Position of Current Ratio
Source: Annual Report
Figure - 1
3.1 Current Ratio:
Current ratio measures the ability of the company to pay current debts as they become due.
𝐶𝑢𝑟𝑟𝑒𝑛𝑡𝐶𝑢𝑟𝑟𝑒𝑛𝑡 𝑅𝑎𝑡𝑖𝑜𝑅𝑎𝑡𝑖𝑜 ==
𝐶𝑢𝑟𝑟𝑒𝑛𝑡𝐶𝑢𝑟𝑟𝑒𝑛𝑡 𝐴𝑠𝑠𝑒𝑡𝑠𝐴𝑠𝑠𝑒𝑡𝑠
𝐶𝑢𝑟𝑟𝑒𝑛𝑡𝐶𝑢𝑟𝑟𝑒𝑛𝑡 𝐿𝑖𝑎𝑏𝑖𝑙𝑖𝑡𝑖𝑒𝑠𝐿𝑖𝑎𝑏𝑖𝑙𝑖𝑡𝑖𝑒𝑠
2015 2014 2013 2012 2011 Average
Current Asset 6,900,000 5,385,000 5,933,000 5,000,000 4,481,500 5,539,900
Current Liabilities 1,466,000 1,276,000 1,046,000 889,000 636,600 1,062,720
Current Ratio 4.71 4.22 5.67 5.62 7.04 5.45
17. Page | 17
2015 2014 2013 2012 2011
Quick Ratio 3.89 3.45 4.76 4.62 5.68
3.89
3.45
4.76 4.62
5.68
0.00
1.00
2.00
3.00
4.00
5.00
6.00
Quick Ratio
Analysis: The quick ratio is an indicator of a company’s short-term liquidity. The quick ratio
measures a company’s ability to meet its short-term obligations with its most liquid assets.
It has been observed that the company has a gradual decrease in quick ratio, from FY2011 to
FY2104. This implies that the company performed poor to maintain its most liquid assets. In FY2015
quick ratio is increased from the previous year. This implies that the company performed better in
FY2015 to maintain its liquid assets.
Source: Annual Report
Figure – 2
Table – 2: Position of Quick Ratio
3.2 Quick Ratio:
The quick ratio measures the ability of a company to use its near cash or quick assets to
extinguish or retire its current liabilities immediately. Quick assets include those current
assets that presumably can be quickly converted to cash.
𝑄𝑢𝑖𝑐𝑘 𝑅𝑎𝑡𝑖𝑜 =
𝐶𝑢𝑟𝑟𝑒𝑛𝑡 𝐴𝑠𝑠𝑒𝑡𝑠 − 𝐼𝑛𝑣𝑒𝑛𝑡𝑜𝑟𝑦
𝐶𝑢𝑟𝑟𝑒𝑛𝑡 𝐿𝑖𝑎𝑏𝑖𝑙𝑖𝑡𝑖𝑒𝑠
2015 2014 2013 2012 2011 Average
Current Assets 6,900,000 5,385,000 5,933,000 5,000,000 4,481,500 5,539,900
Inventories 1,200,000 985,000 950,000 890,000 865,000 978,000
Current Liabilities 1,466,000 1,276,000 1,046,000 889,000 636,600 1,062,720
Quick Ratio 4 3 5 5 6 4
18. Page | 18
2015 2014 2013 2012 2011
Cash Ratio 2.52 2.27 3.08 3.04 3.65
2.52
2.27
3.08 3.04
3.65
0.00
0.50
1.00
1.50
2.00
2.50
3.00
3.50
4.00
Cash Ratio
Source: Annual Report
Table – 3: Position of Cash Ratio
Figure – 3
3.3 CashRatio:
Cash Ratio is the amount of cash and short term equivalents a company has over current
liabilities. The cash ratio is an effective and quick way to determine if a company could have
potential short-term liquidity issues.
𝐶𝑎𝑠ℎ 𝑅𝑎𝑡𝑖𝑜 =
𝐶𝑎𝑠ℎ + 𝐶𝑎𝑠ℎ 𝐸𝑞𝑢𝑖𝑣𝑎𝑙𝑒𝑛𝑡𝑠 + 𝐼𝑛𝑣𝑒𝑠𝑡𝑒𝑑 𝐹𝑢𝑛𝑑𝑠
𝐶𝑢𝑟𝑟𝑒𝑛𝑡 𝐿𝑖𝑎𝑏𝑖𝑙𝑖𝑡𝑖𝑒𝑠
2015 2014 2013 2012 2011 Average
Cash 1,100,000 800,000 810,000 789,000 793,000 858,400
Cash Equivalent 2,600,000 2,100,000 2,410,000 1,910,000 1,530,000 2,110,000
Invested Funds 0 0 0 0 0 0
Current Libailites 1,466,000 1,276,000 1,046,000 889,000 636,600 1,062,720
Cash Ratio 2.52 2.27 3.08 3.04 3.65 2.91
Analysis: It is observed from the above table that, the company’s cash ratio is decreased from
FY2011 to FY2015. This implies that the company’s liquidity is decreasing gradually.
Although, company’s cash and cash equivalent as well as current liabilities are increased over
the years. But still the cash ratio is decreased. This may be the result of, non-investment activity
of the company. It is observed that the company has not invested in any form of fund in the past
five years.
19. Page | 19
Table – 4: Position of Net Working Capital to Total Asset Ratio
Figure – 4
Analysis: An increasing Net Working Capital to Total Assets ratio is usually a positive sign,
showing the company’s liquidity is improving over time. A low or decreasing ratio indicates the
company may have too many Total Current Liabilities, reducing the amount of Working Capital
available.
It is observed that, the company has a decreeing net working capital to total asset ratio from
FY2011 to FY2015. The company was able to maintain an average of 62% of net working capital
of total asset between the year 2011 and 2013. But in between year 2014 and 2015 the net
working capital is decreased to 57%. This indicates that the company did not perform well to
maintain its net working capital.
Source: Annual Report
2015 2014 2013 2012 2011
Net Working Capital to Total
Asset Ratio
0.58 0.56 0.62 0.61 0.64
0.58
0.56
0.62
0.61
0.64
0.50
0.52
0.54
0.56
0.58
0.60
0.62
0.64
0.66
Net Working Capital to Total Asset Ratio
3.4 Net Working Capital to TotalAssetRatio:
The net working capital to total assets ratio measures a company's ability to cover its short
term financial obligations (Total Current Liabilities) by comparing its Total Current Assets to
its Total Assets.
𝑁𝑊𝐶 𝑡𝑜 𝑇𝐴 𝑅𝑎𝑡𝑖𝑜 =
(𝐶𝑢𝑟𝑟𝑒𝑛𝑡 𝐴𝑠𝑠𝑒𝑡 − 𝐶𝑢𝑟𝑟𝑒𝑛𝑡 𝐿𝑖𝑎𝑏𝑖𝑙𝑖𝑡𝑖𝑒𝑠)
𝑇𝑜𝑡𝑎𝑙 𝐴𝑠𝑠𝑒𝑡
2015 2014 2013 2012 2011 Average
Net Working Capital 5,434,000 4,109,000 4,887,000 4,111,000 3,844,900 4,477,180
Total Asset 9,400,000 7,385,000 7,933,000 6,770,000 5,961,500 7,489,900
NWC to TA Ratio 0.58 0.56 0.62 0.61 0.64 1
20. Page | 20
Chapter – 4: Long Term Solvency Analysis
4.1 Solvency Ratio
4.2 Debt to Equity Ratio
4.3 Total Debt to Total Asset Ratio
21. Page | 21
2015 2014 2013 2012 2011
Solvency Ratio 0.00 0.99 1.06 0.00 0.00
0.00
0.99
1.06
0.00 0.00
0.00
0.20
0.40
0.60
0.80
1.00
1.20
Solvency Ratio
Table – 5: Position Solvency Ratio
Source: Annual Report
Figure – 5
4.1 SolvencyRatio:
The solvency ratio indicates whether a company’s cash flow is sufficient to meet its short-
term and long-term liabilities. The lower a company's solvency ratio, the greater the
probability, that it will default on its debt obligations.
𝑆𝑜𝑙𝑣𝑒𝑛𝑐𝑦 𝑅𝑎𝑡𝑖𝑜 =
(𝑁𝑒𝑡 𝐼𝑛𝑐𝑜𝑚𝑒 𝐴𝑓𝑡𝑒𝑟 𝑇𝑎𝑥 + 𝐷𝑒𝑝𝑟𝑖𝑐𝑖𝑎𝑡𝑖𝑜𝑛)
(𝑆ℎ𝑜𝑟 𝑇𝑒𝑟𝑚 𝐿𝑖𝑎𝑏𝑖𝑙𝑖𝑡𝑖𝑒𝑠 + 𝐿𝑜𝑛𝑔 𝑇𝑒𝑟𝑚 𝐿𝑖𝑎𝑏𝑖𝑙𝑖𝑡𝑖𝑒𝑠)
2015 2014 2013 2012 2011 Average
Net Income After Tax 547,543 492,721 538,840 250,835 324,783 430,945
Depritiation 100,000 100,000 100,000 100,000 100,000 100,000
Short Term Liabilities 0 0 0 0 0 0
Long Term Liabilities 0 600,000 600,000 0 0 240,000
Solvency Ratio N/A 0.99 1.06 N/A N/A 1
Analysis: It is found from the evaluation of data; the company did not take any short term
loan during last five years. The company took two long term loans in FY2013 & FY2014.
This implies that the company does not have any short term obligation. This leads only two
solvency ratio point; in FY2013 and FY2014.
It is observed that the company’s solvency ratio drops from FY2013 to FY2014. This
implies the company is performing better to meet its obligations. This also implies that the
company has a steady cash flow.
22. Page | 22
2015 2014 2013 2012 2011
Debt to Equity Ratio 0.18 0.23 0.17 0.15 0.12
0.18
0.23
0.17
0.15
0.12
0.00
0.05
0.10
0.15
0.20
0.25
Debt to Equity Ratio
Analysis: Debt/Equity Ratio is a debt ratio used to measure a company's financial leverage.
The D/E ratio indicates how much debt a company is using to finance its assets relative to
the amount of value represented in shareholders’ equity.
It is found from the line graph analysis that the company’s D/E ratio increases from
FY2011 to FY2014, where it reaches to maximum. A rising debt-to-equity ratio implies
higher interest expenses, and beyond a certain point it may affect a company’s credit rating,
making it more expensive to raise more debt. But in FY2015 the D/E ratio decreases.
Table – 6: Position of Debt to Equity Ratio
Source: Annual Report
Figure – 6
4.2 Debt to Equity Ratio:
Debt/Equity Ratio is a debt ratio used to measure a company's financial leverage, calculated
by dividing a company’s total liabilities by its stockholders' equity. The D/E ratio indicates
how much debt a company is using to finance its assets relative to the amount of value
represented in shareholders’ equity.
𝐷𝑒𝑏𝑡 𝑡𝑜 𝐸𝑞𝑢𝑖𝑡𝑦 𝑅𝑎𝑡𝑖𝑜 =
𝑇𝑜𝑡𝑎𝑙 𝐷𝑒𝑏𝑡
𝑇𝑜𝑡𝑎𝑙 𝐸𝑞𝑢𝑖𝑡𝑦
2015 2014 2013 2012 2011 Average
Total Debt 1,466,000 1,276,000 1,046,000 889,000 636,600 1,062,720
Totoal Equity 7,934,000 5,509,000 6,287,000 5,881,000 5,324,900 6,187,180
Debt to Equity Ratio 0.18 0.23 0.17 0.15 0.12 0.17
23. Page | 23
2015 2014 2013 2012 2011
Debt to Asset Ratio 0.16 0.25 0.21 0.13 0.06
0.16
0.25
0.21
0.13
0.06
0.00
0.05
0.10
0.15
0.20
0.25
0.30
Debt to Asset Ratio
Analysis: Debt to asset ratio measures the percentage of a company’s assets that have been
financed with debt. A higher ratio indicates a greater degree of leverage, and consequently,
financial risk. It is found from the line graph analysis that the company’s D/A ratio is
gradually increasing during the FY2011 to FY2014. But in FY2015 debt to asset ratio
decreased. This indicates that the company is able to reduce its assets financing from debt.
Table – 7: Position of Total Debt to Total Asset Ratio
Source: Annual Report
Figure – 7
4.3 Total Debt to Total AssetRatio:
Total debt to total assets is a leverage ratio that defines the total amount of debt relative to
assets. The higher the ratio, the higher the degree of leverage, and consequently, financial
risk. This is a broad ratio that includes long-term and short-term debt as well as all assets –
tangible and intangible.
𝑇𝑜𝑡𝑎𝑙 𝐷𝑒𝑏𝑡 𝑡𝑜 𝑇𝑜𝑡𝑎𝑙 𝐴𝑠𝑠𝑒𝑡 𝑅𝑎𝑡𝑖𝑜 =
𝑇𝑜𝑡𝑎𝑙 𝐷𝑒𝑏𝑡
𝑇𝑜𝑡𝑎𝑙 𝐴𝑠𝑠𝑒𝑡
2015 2014 2013 2012 2011 Average
1,466,000 1,876,000 1,646,000 889,000 633,600 1,302,120
9,400,000 7,385,000 7,933,000 6,770,000 5,961,500 7,489,900
0.16 0.25 0.21 0.13 0.11 0.17
24. Page | 24
Chapter – 5: Efficiency Position
Analysis/Turnover Ratio
5.1 Fixed Assets Turnover Ratio
5.2 Total Asset Turnover Ratio
5.3 Operating Expense Ratio
5.4 Inventory Turnover
5.5 Days Inventory Outstanding
5.6 Accounts Receivable Turnover Ratio
5.7 Number of Day’s Sales in Account Receivable
25. Page | 25
2015 2014 2013 2012 2011
Fixed Asset Turnover 1.87 1.97 1.95 1.36 1.4
1.87
1.97 1.95
1.36 1.4
0
0.5
1
1.5
2
2.5
Fixed Asset Turnover Ratio
Table – 8: Position of Fixed Asset Turnover
Figure – 8
5.1 Fixed Assets Turnover Ratio:
The fixed-asset turnover ratio is a ratio of net sales to fixed assets. This ratio specifically
measures how able a company is to generate net sales from fixed-asset investments, namely
property, plant and equipment (PP&E), net of depreciation. A higher fixed-asset turnover
ratio indicates that a company has more effectively utilized investment in fixed assets to
generate revenue.
𝐹𝑖𝑥𝑒𝑑 𝐴𝑠𝑠𝑒𝑡𝑠 𝑇𝑢𝑟𝑛𝑜𝑣𝑒𝑟 =
𝑆𝑎𝑙𝑒𝑠
𝑁𝑒𝑡 𝐹𝑖𝑥𝑒𝑑 𝐴𝑠𝑠𝑒𝑡𝑠
2015 2014 2013 2012 2011 Average
Sales 4,865,000 4,136,000 4,087,000 2,549,400 2,217,500 3,570,980
Net Fixed Asset 2,600,000 2,100,000 2,100,000 1,870,000 1,580,000 2,050,000
Fixed Assets Turnover Ratio 1.87 1.97 1.95 1.36 1.40 1.71
Analysis: From the analysis of the above table, it is observed that the company was very
successful in generating sales, from FY2011 to FY2015. The company also has an increase in
fixed assets (i.e. Plant, Property & Equipment/PP&E).
The company’s fixed asset turnover ratio has increased from FY2011 to FY2014; but in FY2015
the ratio decreases from the previous year. This implies that the company performed poor in
generating revenue using fixed asset in FY2015. And performed at best in FY2014, when the
ratio was at maximum.
Source: Annual Report
26. Page | 26
2015 2014 2013 2012 2011
Total Assets Turnover 0.52 0.56 0.52 0.38 0.37
0.52
0.56
0.52
0.38 0.37
0.00
0.10
0.20
0.30
0.40
0.50
0.60
Total Assets Turnover Ratio
Source: Annual Report
Table – 9: Position of Total Asset Turnover
Figure – 9
5.2 TotalAsset Turnover Ratio:
Asset turnover ratio is the ratio of the value of a company’s sales or revenues generated
relative to the value of its assets. The higher the asset turnover ratio, the better the company is
performing, since higher ratios imply that the company is generating more revenue per taka
of assets.
𝑇𝑜𝑡𝑎𝑙 𝐴𝑠𝑠𝑒𝑡 𝑇𝑢𝑟𝑛𝑜𝑣𝑒𝑟 =
𝑆𝑎𝑙𝑒𝑠
𝑇𝑜𝑡𝑎𝑙 𝐴𝑠𝑠𝑒𝑡𝑠
2015 2014 2013 2012 2011 Average
Sales 4,865,000 4,136,000 4,087,000 2,549,400 2,217,500 3,570,980
Total Assets 9,400,000 7,385,000 7,933,000 6,770,000 5,961,500 7,489,900
Total Assets Turnover 0.52 0.56 0.52 0.38 0.37 0.47
Analysis: From the perusal of the above data, it is found that the company’s total asset turnover
ratio is gradually rises, from FY2011 to FY2014; but in FY2015 the ratio drops. This implies that
the company is deploying its assets efficiently.
Although the total asset turnover ratio is gradually increases, from the table it seems there is huge
difference between sales and company asset. This implies that the company, yet to utilize its full
potential.
27. Page | 27
Table – 10: Position of Operating Expense
Ratio
Source: Annual Report
Figure – 10
5.3 Operating Expense Ratio:
The operating expense ratio is a measure of what it costs to operate a piece of property
compared to the income that the property brings in. The operating expense ratio is calculated
by dividing a property's operating expense by its gross operating income and used for
comparing the expenses of similar properties.
𝑂𝑝𝑒𝑟𝑎𝑡𝑖𝑛𝑔 𝐸𝑥𝑝𝑒𝑛𝑠𝑒 𝑅𝑎𝑡𝑖𝑜 =
𝑂𝑝𝑒𝑟𝑎𝑡𝑖𝑛𝑔 𝐸𝑥𝑝𝑒𝑛𝑠𝑒𝑠
𝑅𝑒𝑣𝑒𝑛𝑢𝑒
2015 2014 2013 2012 2011 Average
Revenue 4,856,000 4,136,000 4,087,000 2,549,400 2,217,500 3,569,180
Operating Expense 390,000 381,500 355,000 310,000 225,000 332,300
Operating Expense Ratio 0.08 0.09 0.09 0.12 0.10 0.10
2015 2014 2013 2012 2011
Operating Expense Ratio 0.08 0.09 0.09 0.12 0.10
0.08
0.09
0.09
0.12
0.10
0.00
0.02
0.04
0.06
0.08
0.10
0.12
0.14
Operating Expense Ratio
Analysis: It is observed from the above analysis that the company has a decreasing operating
expense ratio form the FY2011 to FY2015. Although, it is found from the table that the company’s
operating expense has been increasing from the FY2011 to FY2015. But the revenue also increasing
from FY2011 to FY2015. This indicates that the company is performed well to maintain its
operation efficiently.
28. Page | 28
2015 2014 2013 2012 2011
Inventory Turnover 2.69 2.03 2.71 1.8 1.59
2.69
2.03
2.71
1.8
1.59
0
0.5
1
1.5
2
2.5
3
Inventory Turnover
Source: Annual Report
Figure – 11
Table – 11: Position of Inventory Turnover
5.4 Inventory Turnover:
The inventory turnover is a measure of the number of times inventory is sold or used in a
time period such as a year.
𝐼𝑛𝑣𝑒𝑛𝑡𝑜𝑟𝑦 𝑇𝑢𝑟𝑛𝑜𝑣𝑒𝑟 =
𝐶𝑜𝑠𝑡 𝑜𝑓 𝐺𝑜𝑜𝑑𝑠 𝑆𝑜𝑙𝑑
𝐴𝑣𝑒𝑟𝑎𝑔𝑒 𝐼𝑛𝑣𝑒𝑛𝑡𝑜𝑟𝑦
2015 2014 2013 2012 2011 Average
Cost of Goods Sold 3,224,765 2,644,021 2,575,178 1,605,663 1,374,673 2,284,860
Average Inventory 1,200,000 1,300,000 950,000 890,000 865,000 1,041,000
Inventory Turnover 2.69 2.03 2.71 1.80 1.59 2.17
Analysis: It is found from the above table that, the cost of goods sold is increased every year; from
FY2011 to FY2015. This implies that, either the company performed poor in cost control, or the cost
of supply is rising. Average inventory also increased from FY2011 to FY2014, but in FY2015 average
inventory decreases from the previous year. This indicates that the company is not efficiently
managing its inventory.
It is also observed that, the company has an increasing inventory turnover trend from FY2011 to
FY2015. The company sold its inventory more than twice, consecutively 3 years in a row. This
implies that the company product has a strong market demand.
29. Page | 29
Source: Annual Report
2015 2014 2013 2012 2011
Days Inventory Outstanding (in
Days)
135.69 179.80 134.69 202.78 229.56
135.69
179.80
134.69
202.78
229.56
0.00
50.00
100.00
150.00
200.00
250.00
Days Inventory Outstanding
Figure – 12
Table – 12: Position of Days Inventory Outstanding
5.5 Days Inventory Outstanding:
Days inventory outstanding (DIO), defined also as number of days of sales of inventory,
indicates how many days on average a company turns its inventory into sales. Value of DIO
varies from industry and company. In general, a lower DIO is better.
𝐷𝑎𝑦𝑠 𝑖𝑛𝑣𝑒𝑛𝑡𝑜𝑟𝑦 𝑜𝑢𝑡𝑠𝑡𝑎𝑛𝑑𝑖𝑛𝑔 =
365
𝐼𝑛𝑣𝑒𝑛𝑡𝑜𝑟𝑦 𝑡𝑢𝑟𝑛𝑜𝑣𝑒𝑟
2015 2014 2013 2012 2011 Average
Inventory Turnover 2.69 2.03 2.71 1.8 1.59 2.16
Days Inventory Outstanding
(in Days)
135.69 179.80 134.69 202.78 229.56 176.50
Analysis: It is observed from the above table that number of days of inventory outstanding is
decreasing every year; from 2011 to 2015, except the year 2014. Where the number of days were
increased from previous year. The company performed at best in the year 2013, when the company
took 135 days to convert its inventory into sales and performed poor in the year 2011, when the
company took 230 days to convert its inventory into sales.
Company is able to convert its inventory into sales on an average of 177 days. Although inventory
outstanding days are decreased, but it is too large compare to average industry standard of 46 days.
30. Page | 30
Source: Annual Report
2015 2014 2013 2012 2011
Accounts Receivable Turnover (in
Times)
6.08 6.36 6.49 4.28 4.75
6.08
6.36 6.49
4.28
4.75
0.00
1.00
2.00
3.00
4.00
5.00
6.00
7.00
Accounts Receivable Turnover (in Times)
Figure – 13
Table – 13: Position of Accounts Receivable Turnover Ratio
5.6 Accounts Receivable Turnover Ratio:
Accounts receivable turnover is the number of times per year that a business collects its
average accounts receivable. The ratio is intended to evaluate the ability of a company to
efficiently issue credit to its customers and collect funds from them in a timely manner.
𝐴𝑐𝑐𝑜𝑢𝑛𝑡𝑠 𝑅𝑒𝑐𝑒𝑖𝑣𝑎𝑏𝑙𝑒 𝑇𝑢𝑟𝑛𝑜𝑣𝑒𝑟 =
𝑆𝑎𝑙𝑒𝑠
𝐴𝑐𝑐𝑜𝑢𝑛𝑡𝑠 𝑅𝑒𝑐𝑒𝑖𝑣𝑎𝑏𝑙𝑒
2015 2014 2013 2012 2011 Average
Sales 4,865,000 4,136,000 4,087,000 2,549,400 2,217,500 3,570,980
Accounts Receivable 800,000 650,000 630,000 596,000 467,000 628,600
Accounts Receivable
Turnover (in Times)
6.08 6.36 6.49 4.28 4.75 6
Analysis: It is found from the above table that company collects its receivables average 6
times a year. For the last three years the company collets its receivables 6 times a year. This
indicates the company performed on average to collects its due. The company performed at
best in the year 2013 and performed poor in the year 2012.
31. Page | 31
Source: Annual Report
Figure – 14
2015 2014 2013 2012 2011
Number of Day’s Sales in
Account Receivable (in Days)
60.03 57.39 56.24 85.28 76.84
60.03 57.39 56.24
85.28
76.84
0.00
10.00
20.00
30.00
40.00
50.00
60.00
70.00
80.00
90.00
Number of Day’s Sales inAccount Receivable (in Days)
Analysis: It is found from the above analysis that the company is collect its revenue after sales has
been made in an average of 67 days. It is also found that the company’s number of days of
collection of accounts receivable is decreased up until 2013. But from 2014, the numbers of days
are increasing. This implies that the company is performing poor in collecting of its accounts
receivables. The company performed at best in the year 2013, collects receivables within 57 days
and performed poor in 2012, with a collection period of 86 days.
Table – 14: Position of Number of Day’s Sales in Account Receivable
5.7 Number of Day’s Sales in Account Receivable:
The number of day’s sales in account receivable, also known as the days sales outstanding
(DSO), is a measure of the average number of days that a company takes to collect revenue
after a sale has been made. DSO is often determined on a monthly, quarterly or annual basis.
A low DSO value means that it takes a company fewer days to collect its accounts receivable.
A high DSO number shows that a company is selling its product to customers on credit and
taking longer to collect money.
𝑁𝑢𝑚𝑏𝑒𝑟 𝑜𝑓 𝐷𝑎𝑦’𝑠 𝑆𝑎𝑙𝑒𝑠 𝑖𝑛 𝐴𝑐𝑐𝑜𝑢𝑛𝑡 𝑅𝑒𝑐𝑒𝑖𝑣𝑎𝑏𝑙𝑒 =
365
𝐴𝑐𝑐𝑜𝑢𝑛𝑡 𝑅𝑒𝑐𝑒𝑖𝑣𝑎𝑏𝑙𝑒 𝑇𝑢𝑟𝑛𝑜𝑣𝑒𝑟
2015 2014 2013 2012 2011 Average
Account Receivable
Turnover
6.08 6.36 6.49 4.28 4.75 5.59
Number of Day’s Sales
in Account Receivable (in
Days)
60.03 57.39 56.24 85.28 76.84 67.16
32. Page | 32
Chapter – 6: Profitability Analysis
6.1 Gross Profit Margin
6.2 Operating Profit Margin
6.3 Net Profit Margin
6.4 Return on Total Asset (ROA)
6.5 Return on Equity (ROE)
6.6 Return on Investment (ROI)
33. Page | 33
2015
23.72%
2014
26.07%
2013
26.99%
2012
27.02%
2011
28.01%
Gross Profit Margin
2015
2014
2013
2012
2011
Analysis: A high gross profit margin ratio is a sign of good management. Every firm
should try to increase its gross profit as much as possible. Gross profit margin measures,
how much income, is kept in form of profit by company.
It is found that the company’s gross profit margin is decreasing for the last five years, even
though both the revenue and gross profit increased. The company lost 4.29% of gross profit
margin over the last five years. This indicates that the company in not operating efficiently.
Figure – 15
Table – 15: Position of Gross Profit Margin
6.1 Gross Profit Margin:
Gross profit margin is a financial metric used to assess a company's financial health and
business model by revealing the proportion of money left over from revenues after
accounting for the cost of goods sold. Gross profit margin, also known as gross margin, is
calculated by dividing gross profit by revenues.
𝐺𝑟𝑜𝑠𝑠 𝑃𝑟𝑜𝑓𝑖𝑡 𝑀𝑎𝑟𝑔𝑖𝑛 =
𝐺𝑟𝑜𝑠𝑠 𝑃𝑟𝑜𝑓𝑖𝑡𝑠
𝑆𝑎𝑙𝑒𝑠
× 100
2015 2014 2013 2012 2011 Average
Gross Profit 1,153,735 1,078,379 1,103,122 688,797 621,077 929,022
Sales 4,865,000 4,136,000 4,087,000 2,549,400 2,217,500 3,570,980
Gross Profit Margin 23.72 26.07 26.99 27.02 28.01 26
Source: Annual Report
34. Page | 34
2015
13.73%
2014
14.53%
2013
16.08%
2012
12.00%
2011
17.86%
Operating Profit Margin
2015
2014
2013
2012
2011
Analysis: It is found from that the above table that the company’s operating profit
increased along with the revenues from FY201 to FY2015. But the percentage of operating
profit margin is decreased over last five years. From the chart it is observed that the
company performed poor in 2012 and 2015; performed well in 2011, 2013 & 2014.
Table – 16: Position of Operating Profit Margin
Figure – 16
6.2 Operating Profit Margin:
Operating margin is a measurement of what proportion of a company's revenue is left over
after paying for variable costs of production such as wages, raw materials, etc. Operating
margin is also often known as operating profit margin, operating income margin, return on
sales or as net profit margin.
𝑂𝑝𝑒𝑟𝑎𝑡𝑖𝑛𝑔 𝑃𝑟𝑜𝑓𝑖𝑡 𝑀𝑎𝑟𝑔𝑖𝑛 =
𝑂𝑝𝑒𝑟𝑎𝑡𝑖𝑛𝑔 𝑃𝑟𝑜𝑓𝑖𝑡𝑠
𝑆𝑎𝑙𝑒𝑠
× 100
2015 2014 2013 2012 2011 Average
Operating Profit 667,735 600,879 657,122 305,897 396,077 525,542
Sales 4,865,000 4,136,000 4,087,000 2,549,400 2,217,500 3,570,980
Operatin Profit Margin 13.73 14.53 16.08 12.00 17.86 15
Source: Annual Report
35. Page | 35
2015
11.25%
2014
11.91%
2013
13.18%
2012
9.84%
2011
14.65%
Net Profit Margin
2015
2014
2013
2012
2011
Analysis: Net profit margin can give a more accurate view of how profitable a business is
than its cash flow, and by tracking increases and decreases in its net profit margin, a
business can assess whether or not current practices are working. Additionally, because net
profit margin is expressed as a percentage rather than a dollar amount, as net profit is, it
makes it possible to compare the profitability of two or more businesses regardless of their
differences in size. Finally, a business can use its net profit margin to forecast profits based
on revenues.
It is observed from the table, that the company performed poor in generating net profit
margin in 2012 and performed at best in 2011. The company’s net profit margin is
decreased for the last three years consecutively.
Figure – 17
Table – 17: Position of Net Profit Margin
6.3 Net Profit Margin:
Net profit margin is the percentage of revenue remaining after all operating expenses,
interest, taxes and preferred stock dividends (but not common stock dividends) have been
deducted from a company's total revenue.
𝑁𝑒𝑡 𝑃𝑟𝑜𝑓𝑖𝑡 𝑀𝑎𝑟𝑔𝑖𝑛 =
𝑁𝑒𝑡 𝑃𝑟𝑜𝑓𝑖𝑡 𝐴𝑓𝑡𝑒𝑟 𝑡𝑎𝑥
𝑆𝑎𝑙𝑒𝑠
× 100
2015 2014 2013 2012 2011 Average
Net Profit After Tax 547,543 492,721 538,840 250,835 324,783 430,945
Sales 4,865,000 4,136,000 4,087,000 2,549,400 2,217,500 3,570,980
Net Profit Margin 11.25 11.91 13.18 9.84 14.65 12
Source: Annual Report
36. Page | 36
2015
5.82%
2014
6.67%
2013
6.79%
2012
3.71%
2011
5.45%
Return on Total Assets
2015
2014
2013
2012
2011
Analysis: Return on assets (ROA) is an indicator of how profitable a company is relative to
its total assets. ROA gives an idea as to how efficient management is at using its assets to
generate earnings.
From the above table, it is observed that the company performed poor in generating ROA.
Over the last five years generated a small portion of return. Although, the net profit is
increased as well as the total asset. But the company was not able to utilize its total asset to
generate noticeable profit.
Table – 18: Position of Return on Asset
Figure – 18
6.4 Return on TotalAsset:
The return on total assets is a ratio that measures a company's earnings before interest and
taxes against its total net assets. The ratio is considered to be an indicator of how effectively a
company is using its assets to generate earnings before contractual obligations must be paid.
𝑅𝑒𝑡𝑢𝑟𝑛 𝑜𝑛 𝑇𝑜𝑡𝑎𝑙 𝐴𝑠𝑠𝑒𝑡𝑠 =
𝑁𝑒𝑡 𝑃𝑟𝑜𝑓𝑖𝑡𝑠 𝐴𝑓𝑡𝑒𝑟 𝑡𝑎𝑥
𝑇𝑜𝑡𝑎𝑙 𝐴𝑠𝑠𝑒𝑡𝑠
× 100
2015 2014 2013 2012 2011 Avergae
Net Profit After Tax 547,543 492,721 538,840 250,835 324,783 430,945
Total Assets 9,400,000 7,385,000 7,933,000 6,770,000 5,961,500 7,489,900
Return on Total Assets 5.82 6.67 6.79 3.71 5.45 6
Source: Annual Report
37. Page | 37
2015
7.47%
2014
10.04%
2013
9.49%
2012
4.64%
2011
6.59%
Return on Equity
2015
2014
2013
2012
2011
Analysis: ROE measures efficiency. A rising ROE suggests that a company is increasing
its ability to generate profit without needing as much capital. It also indicates how well a
company's management is deploying the shareholders' capital.
It is observed from the above table that the company was not very successful for generating
much return on its equity. In other words, the company is poorly deploying its equity
capital.
Table – 19: Position of Return on Asset
Figure – 19
6.5 Return on Equity:
Return on equity is a measure of profitability that calculates how many dollars of profit a
company generates with each dollar of shareholders' equity.
𝑅𝑒𝑡𝑢𝑟𝑛 𝑜𝑛 𝐸𝑞𝑢𝑖𝑡𝑦 =
𝑁𝑒𝑡 𝑃𝑟𝑜𝑓𝑖𝑡 𝐴𝑓𝑡𝑒𝑟 𝑇𝑎𝑥
𝑆𝑡𝑜𝑐𝑘ℎ𝑜𝑙𝑑𝑒𝑟′ 𝑠 𝐸𝑞𝑢𝑖𝑡𝑦
× 100
2015 2014 2013 2012 2011 Average
Net Profit After Tax 547,543 492,721 538,840 250,835 324,783 430,945
Stockholder's Equity 7,334,000 4,909,000 5,678,000 5,406,000 4,924,900 5,650,380
Return on Equity 7.47 10.04 9.49 4.64 6.59 7.65
Source: Annual Report
38. Page | 38
Table – 20: Position of Return on Investment
Source: Annual Report
Figure – 20
2015
7.30%
2014
8.55%
2013
8.39%
2012
4.61%
2011
6.74%
Return on Investment
2015
2014
2013
2012
2011
Analysis: It is found from the above table that the company’s ROI decreased in
FY2012, compared to previous year. Continuously increased in FY2013 and FY2014.
But decreased again in FY2015. This indicates that the company’s management is not
performing well to maintain its operation efficiency.
6.6 Return on Investment:
Return on investment measures the amount of return on an investment relative to the
investment’s cost. Return on investment can be used as a rudimentary gauge of an
investment’s profitability. Return on investment can be very easy to calculate and to interpret
and can apply to a wide variety of kinds of investments. That is, if an investment does not
have a positive return on investment, or if an investor has other opportunities available with a
higher return on investment, then these return on investment values can instruct him or her as
to which investments are preferable to others.
𝑅𝑒𝑡𝑢𝑟𝑛 𝑜𝑛 𝐼𝑛𝑣𝑒𝑠𝑡𝑚𝑒𝑛𝑡 =
𝑁𝑒𝑡 𝑃𝑟𝑜𝑓𝑖𝑡 𝑏𝑒𝑓𝑜𝑟𝑒 𝑇𝑎𝑥
( 𝑇𝑜𝑡𝑎𝑙 𝐴𝑠𝑠𝑒𝑡 − 𝑇𝑜𝑡𝑎𝑙 𝑂𝑢𝑡𝑠𝑖𝑑𝑒 𝐿𝑖𝑎𝑏𝑖𝑙𝑖𝑡𝑖𝑒𝑠)
2015 2014 2013 2012 2011 Average
Net Profit Before Tax 667,735 600,879 657,122 305,897 396,077 525,542
Total Asset 9,400,000 7,385,000 7,933,000 6,770,000 5,961,500 7,489,900
Total Outside Liabilities 250,000 360,000 105,000 132,000 89,000 187,200
Return on Investment 7.30% 8.55% 8.39% 4.61% 6.74% 7.12%
39. Page | 39
Chapter – 7: Problems involved in financial
performance of NanoPower Bangladesh
7.1 Problems involved in financial performance of NanoPower
Bangladesh
40. Page | 40
7.1 Problems involved in financial performance of NanoPower
Bangladesh:
1. The company’s current ratio decreased by 2.33, from 7.04 in 2011 to 4.71 by 2015.
This is because of increase of current liabilities; although the current assets are
increased.
2. Company’s quick ratio decreased by 1.79, from 5.68 in 2011 to 3.89 in 2011. This is
because the for last five years company’s inventory increased significantly.
3. The company’s cash ratio decreased by 1.13, from 3.65 in 2011 to 2.52 in 2011. This
may be the result of, non-investment activity of the company. It is observed that the
company has not invested in any form of fund in the past five years.
4. The company’s debt-to-equity ratio slightly increased from 0.12 in 2011, to 0.18 in
2015. D/E ratio indicates how much debt a company is using to finance its assets
relative to the amount of value represented in shareholders’ equity.
5. The company’s Total debt-to-Total Asset ratio increased significantly from 0.11 in
2011 to 0.25 in 2014. Total debt to total assets is a leverage ratio that defines the total
amount of debt relative to assets. The higher the ratio the higher the degree of
leverage, and consequently, financial risk.
6. The fixed-asset turnover ratio is how a company generates net sales from fixed-asset
investments. The company’s fixed assets turnover is decreased up until FY2014. This
indicates that the company is not properly utilizing its fixed assets to generate
revenue.
7. The Total Asset Turnover ratio is used as an indicator of the efficiency, with which a
company is deploying its assets in generating revenue. The assets turnover ratio of the
company is decreased to 0.64 times, compare to FY2011, which means the company
is not efficiently deploying its assets.
8. The company’s number of days for collecting its accounts receivable is increasing
since 2013. From 2013 the number of days of collection of accounts receivable is
increased by 4 days in 2015. This implies that the company is performance on its
collection period is declining.
9. A gross profit margin ratio indicates current management policy. A high gross profit
margin ratio is a sign of good management. The company’s gross profit margin is
decreased by 4.29%; from 28.01% in 2011, to 23.72% in 2015. This indicates the
company is no well management.
10. Operating margin is a measurement of what proportion of a company's revenue is left
over after paying for variable costs of production such as wages, raw materials, etc.
Operating margin is also often known as operating profit margin, operating income
41. Page | 41
margin, return on sales or as net profit margin. The company’s operating profit
margin is decreased by 4.13%; from 17.86% in 2011 to 13.73% in 2015. This
indicates that the company’s operating efficiency is declining each year.
11. The net profit margin is a commonly cited measure of the firm’s success with respect
to earnings on sales. Net profit benchmark is 10% - 15% required. The net profit
margin of the company remains almost steady, except in the year 2012. That year the
net profit margin falls below the benchmark.
12. Return on equity (ROE) measures a corporation's profitability by revealing how much
profit a company generates with the money shareholders have invested. The ROA of
the company is increased significantly in the year 2013 & 2014 compared to the year
2011. But in the year 2012 the ROA was the lowest. In the year 2015 ROA is
decreased from the previous year.
43. Page | 43
8.1 Summary of Findings
During the study it is found that, the company has a decreasing current ratio. This implies that
the company has been losing it ability to meet its long-term and short-term obligation. Also
the company performed poor to maintain its most liquid assets. The company did not involve
in any kind investment activity over the last five years. This results decrease in cash ratio.
The company sold its inventory more than twice, consecutively 3 years in a row. This implies
that the company product has a strong market demand. But the company did not perform well
to maintain its net working capital.
The company did not receive any short term loan over the past five years. But received two
long term loans. Between these two years the solvency ratio decreased. This implies the
company is performing better to meet its obligations. This indicates that the company is
successfully running its own. This also implies the company is performing better to meet its
obligations. Company’s Debt-to-Equity ratio & Debt-to-Asset ratio decreased. This indicates
that the company is financing its assets from the business operation; rather than shareholders
equity and debt.
The company did not performed well, generating revenue using fixed asset. Although the
total asset turnover ratio is gradually increases, but there is huge difference between sales and
company asset. This implies that the company, yet to utilize its full potential. Operating
expense of the company increases over the last five years; but The revenue also increases.
This indicates that the company is performed well to maintain its operation efficiently.
Management of the company did not perform well to make a good return from its investment.
Most of the company’s investment is underutilized. The working capital decreases because of
increase in current liabilities. But in 2015 the working capital increases due to significant
increase in current asset.
It is found that the company’s gross profit margin is decreasing for the last five years, even
though both the revenue and gross profit increased. The company lost 4.29% of gross profit
margin over the last five years. This indicates that the company in not operating efficiently.
During the study it is found that, the sales of the company increased. But the operating profit
did not increased, as it should be in accordance with sales. The company’s net profit margin
is decreased for the last three years consecutively. it is observed that the company performed
poor in generating ROA. Over the last five years generated a small portion of return.
Although, the net profit is increased as well as the total asset. But the company was not able
to utilize its total asset to generate noticeable profit. It is also found that the company was not
very successful for generating much return on its equity (ROE). In other words, the company
is poorly deploying its equity capital.
8.2 PolicyRecommendations
To solve the above problems authority already has taken some initiative which will
help them to mitigate there problems. My recommendation regarding above problems
are:
a) The management of the company should perform more efficiently in order to
manage its asset and equity and to utilize them in order generate profit.
44. Page | 44
b) The company is suffering from capital deficit. To overcome, the company
should look for other source of finance. The company should also find more
investors to solve the financing problem.
c) Sale is the only source of the revenue of the company. So the company should
involve in investment activity in order to make, more than one source of
revenue.
d) The company should manage its inventory more efficiently and more
economically.
e) The company should involve in more marketing activity, in order to increase
sales growth.
f) Since the company is involved in the business of installation and erection; the
company is suffering from lack of skilled technician. This hinders the growth
of the business. The company should arrange proper training facility for its
worker in order to make them more skilled.
g) The company should also employ unskilled worker, in order to shape them
into skilled worker as per company requirement.
8.3 Conclusion
The importance of sustaining and improving performance is increasing day by day
particularly in an environment which is characterized by rapidly flourishing
technology and its growing application to banking and non banking financial
institution tremendous competition, product development, shift in marketing strategy,
deregulation & globalization on the one hand, and escalation in the number of bank
failures accompanied by mergers and mega mergers on the contrary. In order to keep
abreast with the prevailing market scenario it is necessary to develop a comprehensive
performance evaluation system.
The current report aimed at critically examining the Performance of a private financial
institution. The main objective of this report was to evaluate the financial analysis of
the company. Along with how efficiently are providing services to its customer. From
Financial Analysis it has been seen that the performance of the company finance ltd is
really satisfactory.