1. Introduction
This paper examines sell-side analysts’ percep-
tions of ‘earnings quality’. Analysts are primary
users of accounting information and their role as
information intermediaries is well established in
the capital markets (e.g. Schipper, 1991). Previous
evidence suggests that their stock recommenda-
tions, price targets, earnings forecasts and written
reports are relevant to share price formation (e.g.
Womack, 1996; Barber et al., 2001; Brav and
Lehavy, 2003, Asquith et al., 2005). One of the
main inputs in analysts’ forecasting and valuation
models is earnings, and analysts’ perceptions of
‘earnings quality’ are therefore important. There
is, however, little direct evidence in the literature
on what these perceptions are and on what role
they have in decision-making.
This paper seeks first to understand earnings
quality as interpreted by analysts, and it then tests
this interpretation against its actual usage in ana-
lysts’ research reports. In the paper’s research de-
sign, an inductive approach is used that combines
interview data with content analysis, and the find-
ings are interpreted in the light of findings from
market-based and other research. We conducted 35
interviews with sell-side analysts from 10 leading
investment banks and we carried out content
analysis on 98 equity research reports for FTSE
100 companies covered by the interviewees.
The interview evidence is that earnings quality is
a multifaceted concept and that analysts use both
accounting-based and non-accounting-based infor-
mation when assessing earnings quality. When
using accounting-based information, analysts
make adjustments to reported earnings that we find
to be consistent both with prior survey evidence
and with expectations from theory and prior mar-
ket-based evidence. There is relatively little evi-
dence in the literature, however, on the relative
usage of accounting-based and non-accounting-
based information, and we explore this issue fur-
ther in the content analysis. We find that there is a
greater prevalence of non-accounting-based infor-
mation relating to earnings quality, and that this
relative usage is consistent across sectors.
Motivated by market-based and survey evidence
that sell-side analysts are favourably biased to-
wards companies but nevertheless motivated to
sell news stories to the market, we explore whether
Accounting and Business Research, Vol. 38. No. 4. pp. 313-329. 2008 313
Analysts’ perceptions of ‘earnings quality’
Richard Barker and Shahed Imam*
Abstract—This paper examines sell-side analysts’ perceptions of ‘earnings quality’. Prior research suggests that
analysts’ stock recommendations, price targets, earnings forecasts and written reports are relevant to share price for-
mation. One of the main inputs in analysts’ forecasting and valuation models is earnings, and analysts’ perceptions
of earnings quality are therefore important. There is, however, little direct evidence in the literature on what these
percepti ...
1. IntroductionThis paper examines sell-side analysts’ perce.docx
1. 1. Introduction
This paper examines sell-side analysts’ percep-
tions of ‘earnings quality’. Analysts are primary
users of accounting information and their role as
information intermediaries is well established in
the capital markets (e.g. Schipper, 1991). Previous
evidence suggests that their stock recommenda-
tions, price targets, earnings forecasts and written
reports are relevant to share price formation (e.g.
Womack, 1996; Barber et al., 2001; Brav and
Lehavy, 2003, Asquith et al., 2005). One of the
main inputs in analysts’ forecasting and valuation
models is earnings, and analysts’ perceptions of
‘earnings quality’ are therefore important. There
is, however, little direct evidence in the literature
on what these perceptions are and on what role
they have in decision-making.
This paper seeks first to understand earnings
quality as interpreted by analysts, and it then tests
this interpretation against its actual usage in ana-
lysts’ research reports. In the paper’s research de-
sign, an inductive approach is used that combines
interview data with content analysis, and the find-
ings are interpreted in the light of findings from
market-based and other research. We conducted 35
interviews with sell-side analysts from 10 leading
investment banks and we carried out content
analysis on 98 equity research reports for FTSE
100 companies covered by the interviewees.
2. The interview evidence is that earnings quality is
a multifaceted concept and that analysts use both
accounting-based and non-accounting-based infor-
mation when assessing earnings quality. When
using accounting-based information, analysts
make adjustments to reported earnings that we find
to be consistent both with prior survey evidence
and with expectations from theory and prior mar-
ket-based evidence. There is relatively little evi-
dence in the literature, however, on the relative
usage of accounting-based and non-accounting-
based information, and we explore this issue fur-
ther in the content analysis. We find that there is a
greater prevalence of non-accounting-based infor-
mation relating to earnings quality, and that this
relative usage is consistent across sectors.
Motivated by market-based and survey evidence
that sell-side analysts are favourably biased to-
wards companies but nevertheless motivated to
sell news stories to the market, we explore whether
Accounting and Business Research, Vol. 38. No. 4. pp. 313-329.
2008 313
Analysts’ perceptions of ‘earnings quality’
Richard Barker and Shahed Imam*
Abstract—This paper examines sell-side analysts’ perceptions
of ‘earnings quality’. Prior research suggests that
analysts’ stock recommendations, price targets, earnings
forecasts and written reports are relevant to share price for-
mation. One of the main inputs in analysts’ forecasting and
valuation models is earnings, and analysts’ perceptions
of earnings quality are therefore important. There is, however,
little direct evidence in the literature on what these
perceptions are and on what role they have in decision-making.
3. This paper seeks first to understand earnings qual-
ity as interpreted by analysts, and it then tests this
interpretation against its actual usage in analysts’ research re-
ports. An inductive approach is used that combines interview
data with content analysis, and the findings are
interpreted in the light of findings from market-based and other
research. We find that the concept of earnings qual-
ity is both accounting-based (relating to notions of core or
sustainable earnings, cash and accrual components of
earnings, and accounting policies) and non-accounting-based
(relating to information drawn from outside the fi-
nancial statements). We find more non-accounting than
accounting references to earnings quality, and that (rela-
tively subjective) non-accounting references are especially
widely used where analysts express positive or negative
opinions about earnings quality. It is relatively unusual for an
analyst’s opinion to be both negative and account-
ing-based. If, however, an analyst does express negative,
accounting-based views on earnings quality, then he or
she is highly unlikely to be positive in other respects. We
interpret this evidence to be consistent with analysts’ eco-
nomic incentives to generate trading volume yet to be
favourably biased towards companies, while seeking to use
value-relevant information relating to earnings. We also
conclude that the importance of accounting-based infor-
mation relating to earnings quality is more important than it
might seem, and that it exerts a significant influence
on the analysis and recommendations in analysts’ reports.
Keywords: earnings quality; analysts’ reports; analysts’
opinions
*Richard Barker is Senior Lecturer at Judge Business
School, University of Cambridge and Shahed Imam is
Assistant Professor at Warwick Business School, University
of Warwick.
4. The authors are grateful for helpful input from the Editor
and the anonymous reviewers; also Rhoda Brown, Colin
Clubb, John Holland, Geoff Meeks, Geoff Whittington and
Wenjuan Zhang; seminar participants at Cambridge, Cardiff,
and Warwick; and conference participants at the BAA.
Correspondence should be addressed to: Dr Richard
Barker, Judge Business School, University of Cambridge,
Trumpington Street, Cambridge CB2 1AG, UK. Tel: +44 (0)
1223 339646. Fax: +44 (0) 1223 339701. E-mail:
[email protected]
This paper was accepted for publication in March 2008.
the relative usage of accounting-based and non-ac-
counting-based information varies depending
upon whether analysts are expressing a positive or
negative opinion about a company. Consistent
with prior evidence on bias, we find that analysts
are significantly more often positive than negative
when discussing earnings quality. We also find a
significantly greater relative use of non-account-
ing-based information when a directional opinion
– either positive or negative (but not neutral) – is
expressed; we interpret this to be consistent with
analysts being motivated to sell news stories, be-
cause non-accounting information is more subjec-
tive and wide-ranging, and so inherently more
amenable to analysts credibly expressing diversity
of opinion. We also find, however, that in spite
of being less frequently used, in general and in
particular when positive or negative views are ex-
pressed, accounting-based information neverthe-
less plays an important role in anchoring and
5. constraining analysts’ views. Specifically, we find
that, in cases where analysts are positive on ac-
counting aspects of earnings quality, they are
‘free’ to be either positive or negative on non-ac-
counting aspects, but that if they are negative on
accounting aspects, then they are, in effect, con-
strained to be negative overall. This conclusion is
reinforced by further evidence that analysts are
most unlikely to issue a buy recommendation
when they feel negative about accounting-based
aspects of earnings quality, even though there is an
overall bias in favour of buy recommendations.
Accounting-based information is therefore argued
to be more influential than it might at first seem.
The rest of the paper is organised as follows.
Section 2 reviews theory and empirical evidence
relating to earnings quality. Section 3 discusses re-
search methodology. Interview findings are pre-
sented in Section 4, followed by evidence from
analysts’ reports in Section 5. Section 6 concludes
the paper.
2. Earnings quality – theory and evidence
This paper addresses earnings quality from a
users’ perspective. The paper seeks first to under-
stand earnings quality as interpreted by analysts,
and it then tests this interpretation against its actu-
al usage in analysts’ research reports.
Earnings measurement is central to the use of fi-
nancial statements in evaluating historical per-
formance, forecasting future performance and
valuing equity (Ohlson, 1995; Penman, 2004). A
frequently-used term relating to the effectiveness
of earnings measurement and the usefulness of
6. earnings is ‘earnings quality’, whereby a company
exhibiting high earnings quality is viewed more
favourably by users of financial statements than a
company with low earnings quality. Yet, as noted
by Schipper and Vincent (2003), ‘although the
phrase “earnings quality” is widely used, there is
neither an agreed-upon meaning assigned to the
phrase nor a generally accepted approach to meas-
uring earnings quality.’
The literature contains several possible earnings
quality constructs. One relates to the time-series
behaviour of earnings. In empirical studies of the
share price reaction to unexpected earnings, a larg-
er earnings response coefficient is associated with
earnings that are more persistent, sustainable or re-
curring (e.g. Kormendi and Lipe, 1987). This ac-
cords with theory, whereby earnings with greater
persistence warrant a higher valuation multiple
(e.g. Ohlson, 1995). A similar construct is predic-
tive value, whereby earnings of a high quality are
those that can better predict earnings in future pe-
riods. Although persistence and predictive value
might typically go hand in hand, Schipper and
Vincent (2003) note that volatile earnings might be
high quality as measured by persistence (i.e. the
earnings time series follows a random walk) but
low quality as measured by predictive value (i.e.
low serial correlation in the earnings time series).
The actual time-series behaviour of earnings can
be attributed jointly to inherent attributes of the en-
tity’s business environment and to the effective-
ness of accounting in capturing these attributes.
Accordingly, an alternative perspective on earn-
ings quality is based upon understanding account-
7. ing choices and limitations. For example, Schipper
and Vincent (2003) define earnings quality in
terms of the unobservable benchmark of Hicksian
economic income (Hicks, 1939), with the aim
being to compare reported accounting income with
the ‘ideal’ measure of change in economic value.
Empirical tests of accounting measurement have
focused on the use of discretionary accruals to
measure the extent of earnings management; the
higher the use of discretionary accruals, the lower
the quality of earnings (Jones, 1991; Dechow et
al., 1995; Burgstahler and Dichev, 1997). This ap-
proach differs from a time-series focus, although
there is similarity to the extent that accruals exhib-
it lower persistence than operating cash flows
(Sloan, 1996).1
A consistent finding in prior research is that the
stock market places substantial reliance on ana-
lysts’ research (Fogarty and Rogers, 2005; Frankel
et al., 2006), including earnings forecasts (Stickel,
1991; Francis and Soffer, 1997), recommendations
314 ACCOUNTING AND BUSINESS RESEARCH
1 Accrual accounting is typically argued to make earnings
more relevant than cash flows for assessing firm performance,
while cash flows may be more reliable than earnings because
accruals require judgment and estimation. The use of cash
flow as an alternative metric has gained increasing popularity
in the literature (Dechow, 1994; Sloan, 1996; Barth et al.,
2001; DeFond and Hung, 2003). The notion that cash flows
are useful in validating the information in earnings that con-
tain large accruals is consistent with Penman (2004) and Wild
et al. (2003).
8. (Womack, 1996; Barber et al., 2001) and target
prices (Brav and Lehavy, 2003). Moreover, it is
not only the headlines in analysts’ reports that con-
vey value-relevant information but also the text of
the reports and the justifications therein (Krishnan
and Booker, 2002; Asquith et al., 2005).
Given this evidence of the importance of ana-
lysts and of their earnings forecasts and related in-
formation, it becomes important to understand
how analysts interpret and communicate value-rel-
evant information. In the context of the current
paper, the focus is on analysts’ usage of informa-
tion relating to earnings quality. The evidence
from market-based research is that the market
places greater reliance on measures of earnings
that have been adjusted by analysts for one-off or
transitory items (Lin and Walker, 2000; Bradshaw
and Sloan, 2002; Bhattacharya et al., 2003; Brown
and Sivakumar, 2003). Gu and Chen (2004) find
that, for any given category of earnings, analysts’
subjective assessments are effective in determin-
ing which components of the category to include
in sustainable earnings (‘street earnings’) and
which to exclude. Survey evidence broadly sup-
ports these findings (Barker, 2000). In addition,
studies employing either survey methods (such as
Arnold and Moizer, 1984; Pike et al., 1993; and
Barker, 1999), protocol analysis (Day, 1986) or
content analysis (Bradshaw, 2002; Demirakos et
al., 2004) find that the price earnings (PE) ratio is
the dominant valuation model used by analysts,
which reinforces the importance that analysts
place on their measures of sustainable earnings
9. (the E in PE), and hence on earnings quality.
Research directly investigating the concept of
perceptions of earnings quality is rather limited.
Siegel’s (1982) survey identifies the concept of
earnings quality as negatively associated with the
number of accounting policy changes made by a
company. Also employing a survey methodology,
Graham et al. (2002) find that analysts associate a
high quality of earnings with high growth, low risk
and a high degree of persistence, and also with the
source of the earnings in terms of segmental line of
business and geographical breakdowns. Other fac-
tors mentioned by analysts included the quality of
management, the level of disclosure and the ac-
counting policies in use. Using a content analysis,
Bricker et al. (1995) found that analysts focus on
core earnings and associate high earnings quality
with near-term earnings predictability (where the
notion of predictability is both economic, in terms
of a low level of earnings volatility, and due to ac-
counting, in terms of management discretion over
the establishment and adjustment of certain con-
servative reserves, allowances, and off-balance-
sheet assets).
3. Data and methodology
This paper employs two research methods – semi-
structured interviews and content analysis. The
interviews are used to provide an initial categori-
sation of analysts’ perceptions of earnings quality
and the content analysis is used to test this cate-
gorisation, and to derive findings from it. The two
research methods are closely linked in order to en-
hance the validity of each: the content analysis is
10. applied to the interviewees’ descriptions of earn-
ings quality in research reports written by the in-
terviewees. The approach is inductive, building on
prior research to investigate a little-understood
area and to derive theory and insight from empiri-
cal evidence.
We conducted 35 semi-structured interviews
with sell-side analysts from 10 leading investment
banks selected from the Extel Survey. The Extel
Survey every year ranks the top 25 pan-European
brokerage firms across equity sectors. We selected
the dominant 15 firms from these 25 from the 2002
Extel Survey to conduct 40-minute interviews
within equity research departments. We selected
the leading firms, in part because they dominate
the market and also because there is evidence
(Hussain, 2002; Jacob et al., 1999; Clement, 1999)
that brokerage house size (a proxy for analysts’ re-
sources and support systems) is an important fac-
tor impacting the quality of analysts’ research. Ten
firms (66%) agreed to participate in the study,
which is a similar response rate to comparable
studies (Day, 1986; Holland, 1998; Barker, 2000).2
The sample comprises five broad sectors (finan-
cial, industrial, media, retail and technology). The
mean experience and number of companies cov-
ered by each analyst was 6.5 years and 11 firms re-
spectively.3 The interviews were conducted in late
2002/early 2003. Table 1 presents details of the
sample.
The interview questionnaire, which also formed
part of a wider study, contained two questions re-
lating to the definition of earnings quality. First,
analysts were asked to indicate which items of
11. profit or loss they typically exclude from their
measure of earnings. The list of items included/ex-
cluded (see Table 2) was based on three principal
sources, namely FRS 3 (ASB, 1992), UKSIP’s
‘headline earnings’ (UKSIP, 1993) and S&P ‘core
earnings’ (S&P, 2002). Second, analysts were
asked an open, free-form question about what the
term ‘earnings quality’ meant to them. Analysis of
their responses to this question proceeded by first
transcribing the interviews and by then highlight-
Vol. 38 No. 4. 2008 315
2 The composition of brokerage firms’ research reports con-
tent analysed by Hussainey et al. (2003) is also broadly similar.
3 Clement (1999) finds that forecast accuracy is positively
associated with analysts’ experience (a surrogate for analyst
ability and skill) and negatively associated with the number of
firms and industries followed by the analyst (measures of task
complexity).
ing frequently occurring themes to develop a key-
word dictionary for content analysis (Miles and
Huberman, 1994, and see below). Interviews are a
means to understand how individuals construct the
meanings and significance of their situations
(Holland, 1998; Easterby-Smith et al., 2002) and
in particular in this context to understand the con-
structs that the interviewee uses as a basis for his
or her interpretation of earnings quality. In turn,
content analysis can then be used to test the inter-
view findings against the hard evidence provided
in the published analysts’ reports.
12. Content analysis relies on the content of com-
munication as the basis of inference (Holsti, 1968).
One of the main strengths of content analysis, as
noted by Breton and Taffler (2001), is that it is par-
ticularly appropriate for research using analysts’
reports, both because of its unobtrusive nature in
analysing narratives prepared for other reasons
and audiences and because of its ability to measure
the implicit importance attributed to an informa-
tion category by the report’s author. Sell-side
analysis is an unusually rich subject because the
norm is for analysts to generate in-depth reports
summarising, for the clients’ benefit, the output of
the analyst’s research. It is not surprising that the
content of analysts’ reports is value-relevant
(Asquith et al., 2005; Fogarty and Rogers, 2005).
Against these benefits of content analysis is the
issue of whether analysts’ reports provide an ob-
jective source of information. The evidence is that
they are actually biased, which we therefore take
into consideration in the interpretation of the re-
ports and the analysis of findings. Specifically,
prior research finds that analysts’ forecasts contain
an optimistic bias, particularly when the analysts
act as underwriters (Dugar and Nathan, 1995;
Michaely and Womack, 1999) or investment
bankers (Hussain, 1996; Lin and McNichols,
1998) of the companies whose earnings they esti-
mate. O’Brien et al. (2005) suggest that this opti-
mism is due, among other things, to analysts
aiming to maintain good relationships with corpo-
rate management and to good stories being easier
to sell than bad ones. Forbes and Skerratt (1992)
13. present evidence that the market recognises this
bias. Consistent with this, Hirst et al. (1995) find
that, when an analyst issues an unfavourable report
about a company, it is given greater weight by in-
vestors if the analyst is affiliated to the company,
because the analyst’s stated view is unfavourable
notwithstanding his or her inherent bias. Similarly,
Frankel at al. (2006) find that negative forecast re-
visions are more informative than positive revi-
sions. This evidence suggests that there is
something to be learned from a distinction be-
tween analysts’ positive and negative perceptions
of earnings quality, which we therefore explore in
this paper.
For the purposes of the content analysis, we used
the Investext Plus database to select equity re-
search reports for FTSE-100 companies for each
interviewee. In order to provide a controlled ex-
periment, we limited our study to only the five sec-
tors and the 10 investment banks in the interview
sample. Out of the FTSE 100, for the period July
316 ACCOUNTING AND BUSINESS RESEARCH
Table 1
Distribution of the sample (interview and content analysis)
Interviews Content analysis
Total Total
analysts reports Total Total Pages per Words per
Sectors interviewed analysed pages words report report
Mean Median Mean Median
14. Financial 5 17 527 106,099 31 28 6,241 4,877
Industrial 9 15 429 87,550 29 24 5,837 4,365
Media 4 19 710 126,699 37 32 6,668 4,986
Retail 4 26 930 187,904 36 26 7,227 6,079
Technology 9 21 761 124,720 36 28 5,939 4,965
Total 31 98 3,357 632,972 34 28 6,459 5,005
Note: ‘Financial’ includes bank and insurance. ‘Industrial’
includes engineering, aerospace and defence, elec-
tronics and capital goods, building materials, paper and
packaging, mining and metal. ‘Media’ includes serv-
ice and media. ‘Retail’ includes general retail and food retail.
‘Technology’ includes telecommunications and
technology, and ‘Other’, not shown in this table, includes one
strategist, one head of equity research and two
analysts specialising in accounting aspects of equity research.
We did not collect any reports for the four ana-
lysts in the ‘Other’ category.
2000 to June 2003, 52 companies were covered by
the interviewees and have reports available in the
Investext Plus database. We selected reports for
these companies that were at least 15 pages in
length (comprehensive company reports were con-
sidered more relevant than ‘morning notes’ or sec-
tor reports).4 If there was more than one report for
a particular company in a single year, we took the
most recent report. We limited each analyst to a
15. maximum of three reports on any given company.
Our resulting sample comprised 98 reports in total,
as summarised in Table 1.
An essential element of content analysis re-
search design is the selection and development of
categories into which content units can be classi-
fied. There are two alternative approaches: ‘form
oriented’ (objective) analysis, and ‘meaning ori-
ented’ (subjective) analysis (Smith, 2003). ‘Form
oriented’ involves routine counting of words
whereas ‘meaning oriented’ involves the analysis
of the underlying themes in the texts. Weber
(1990) argues that word categories inferred from
covariation among high-frequency words are more
reliable than themes. However, Krippendorff
(1980) suggests that for many content analyses,
thematic units, which require user judgment in the
determination of the hidden messages conveyed in
the narratives, may be preferable despite difficul-
ties in application. In this study, like previous stud-
ies (Clatworthy and Jones, 2003; Smith and
Taffler, 2000), content analysis was both form- and
meaning-oriented.
The research design of the content analysis was
driven by the interview findings. For the form-
oriented content analysis, the words used by inter-
viewees to describe earnings quality formed a
keywords dictionary in TextQuest (Weber, 1990;
Neuendorf, 2003).5 We categorised the keywords
into two broad categories of information relating
to earnings quality – accounting-based and non-
accounting-based.6 In all cases, we categorised the
keywords according to their context; whenever out
of context, keywords were eliminated from con-
16. sideration – for example, the word ‘growth’ was
used in relation to earnings sustainability in the in-
terviews and we excluded it in content analysis if
it was used in relation to growth in GDP or some
other factor.7 Hence the keywords from the inter-
view data were the basis for the content analysis of
the reports, and there was not a simple count of
word frequency but instead of words in appropri-
ate context. This is important because (for exam-
ple) some words may have multiple meanings or
be used in different contexts.
In their theme-based content analysis of the
chairman’s statement, drawing on theory and evi-
dence that accounting narratives are likely to be
self-serving rather than objective, Clatworthy and
Jones (2003) make a distinction between narra-
tives that concern good news as opposed to those
that concern bad news (see also Smith and Taffler,
2000). Similarly, we are guided in this paper by
evidence that analysts are favourably biased to-
wards the companies they research, and so our
theme-based content analysis is structured around
a distinction between positive and negative per-
ceptions of earnings quality. For example, if an in-
formation unit discussed reported profit in excess
of expectations, we classified this as accounting-
positive. We assigned ‘1’ to each unit mentioned in
the narratives and added those up to calculate the
total score for ‘positive’ and ‘negative’ and then
divided this by the total number of sentences to get
a theme score. By focusing on those cases where
the analyst expresses a directional opinion – posi-
tive or negative, as opposed to neutral – we are
able to gain insight into the extent to which ana-
17. lysts’ opinions and recommendations are driven by
accounting-based as opposed to non-accounting-
based information.
In addition, for the theme-based analysis, con-
sistent with the findings of Asquith et al. (2005) on
the importance of the strength of an argument, we
were able to test the extent to which there was both
strength and direction in the analysis. This
methodology is similar to both Breton and Taffler
(2001) and Smith and Taffler (2000).
As noted by Clatworthy and Jones (2003) and
Abrahamson and Amir (1996), it is difficult to
develop a reliable coding scheme and any
coding scheme is best carried out more than once
in order to test inter-coder reliability. To verify the
reliability and consistency of the adjustments of
word variable according to keywords-in-context
(KWIC) and calculation of theme score, a second
researcher conducted independent adjustment and
coding.8 In addition, we analysed the text twice for
theme-based content analysis.9
It must be acknowledged that there are two im-
portant limitations to content analysis. The first is
that any classification rule is necessarily subjec-
Vol. 38 No. 4. 2008 317
4 Morning notes are typically only a few pages long and sec-
tor reports consist of summarised information about the com-
parable companies in the sector (the analysts’ cover) with a
special focus on the sector and market outlook.
5 TextQuest is a program designed for analysis of texts. See
18. Neuendorf (2003) and http://www.textquest.de/eindex.html.
6 Keywords were included only if they were used by ana-
lysts in the interviews, and all such words were included.
7 By only examining keywords in context, the risk of spuri-
ous word counts is minimised; while all included words are
implicitly and unavoidably assumed to be of equal impor-
tance, out-of-context words are excluded.
8 We used Cohen’s Kappa test and the agreement percentage
was satisfactory (70%). See Neuendorf (2003) for details of
inter-coder reliability testing.
9 A unit was not coded as positive or negative if the sentence
or clause was neutral or ambiguous. This is one of the reasons
why the theme score in Table 5 is much lower than the key-
word count in Table 6.
tive to some extent. However, we only make two
classifications (accounting-based vs non-account-
ing-based and positive vs negative) and we make
the classification by reference to interview data.
Second, by basing inference on the frequency of
information that appears in the text, there is an im-
plicit (and contestable) assumption that all items of
information are of equal importance. However,
here again there is an additional safeguard in our
research design, which is that we only include key-
words in context – i.e. we are not counting a given
word every time it is used but instead are only in-
cluding it when it is used in the reports in the same
context that it was used in the interviews.
19. 4. Interview findings
Table 2 reports interviewee responses on adjust-
ments made to reported earnings. The findings are
presented in order of the frequency with which
they are typically included in the analyst’s measure
of earnings.
Consistent with theory and with the market-
based and survey evidence reported in Section 2,
the items included are those that form part of the
ongoing earnings stream. Items that are excluded
relate to activities that are one-off in nature or dis-
continued, or else they result from remeasure-
ments – i.e. from valuation adjustments, resulting
from revisions to the carrying amounts of assets or
liabilities, that have a multiple of one and little or
no predictive value for future earnings (Barker,
2004). In cases where there is not a clear-cut dis-
tinction between items that are included or exclud-
ed, the item in question could include items that
are either ongoing or one-off. Specifically, ‘one-
off’ operating expenses, restructuring costs or ex-
ceptional items could be reported as one-off but,
given the inherent subjectivity in their determina-
tion and, in some cases, the regularity of these ex-
pense categories, analysts may not perceive them
to be one-off. Provisions for future cash outflows
could take place regularly and so be an ongoing
expense, or there could be, for example, a gain or
loss on the remeasurement of an asset retirement
obligation, which would not form part of ongoing
earnings. Finally, gains or losses on asset disposals
may, or may not, be a part of ongoing earnings de-
pending upon whether the entity is in the business
of assets sales (e.g. with significant turnover of in-
20. vestment properties) or not (e.g. with the occa-
sional disposal of a head office or similar asset).
The only exception in Table 2 to this analysis is the
amortisation of goodwill which, although recur-
ring, is excluded. This can be regarded as a special
case – as an accounting anomaly with no relevance
to the prediction of future cash-flow generating ca-
pacity.
These findings are broadly consistent with both
the theory and evidence reviewed in Section 2 (e.g.
Kormendi and Lipe, 1987; Bradshaw and Sloan,
2002) that analysts use components of reported fi-
nancial performance to generate a measure of sus-
318 ACCOUNTING AND BUSINESS RESEARCH
Table 2
Earnings adjustments
Please indicate which items you include Include Exclude
Depends/Not sure
or exclude for adjusted earnings
Depreciation 35 0 0
Interest expenses 33 1 1
Pension (service cost) 32 3 0
Pension (interest cost) 31 4 0
R&D expenses 29 4 2
Stock compensation 21 8 6
Operating expenses (one-off) 14 9 12
Provisions for future cash outflows 13 8 14
Restructuring costs 10 11 14
Gains or losses on financial assets 6 22 7
Impairment losses on fixed assets 6 28 1
Revaluation gains on fixed assets 6 24 5
21. Discontinued activities 4 23 8
Impairment of goodwill 4 27 4
Amortisation of goodwill 3 28 4
Gains or losses on asset disposals 2 23 10
Exceptional items 1 16 18
tainable earnings. The most directly comparable
survey evidence can be found in Barker (2000),
which addresses analysts’ treatment of items re-
ported as exceptional under the accounting stan-
dard FRS 3 (ASB, 1992). Although limited in
scope when compared with Table 2, Barker’s find-
ings are consistent: analysts universally included
recurring exceptional items in normalised earn-
ings, whereas most excluded items are typically
one-off (non-recurring exceptional items, and
profit or loss on asset sales and on sale/termination
of operations), and the only item that generated
mixed views was reorganisation costs, where the
difference in opinion arose because some analysts
viewed these as one-off while others did not.
Analysts were also asked in the interviews to
elaborate on their understanding of the definition
of earnings quality. A majority of analysts (27 out
of 35) described earnings quality in terms of some
aspect of the ‘core’ earnings of the firm. For ex-
ample, revenue from core operations generates
higher earnings quality than income from non-
core, non-sustainable sources such as gains on the
disposal of assets. In general, interviewees regard-
ed organic growth in the core business as the most
likely source of high quality earnings. These earn-
ings are more likely to be sustainable in the future,
22. and because they are more repetitive and perceived
to be more controllable by the company, they can
be forecasted with greater reliability.10 For exam-
ple, a bank analyst described interest income and
commission as high quality earnings since these
are more readily sustainable in the future, whereas
trading profit was viewed as more volatile and so
lower quality. For a software analyst commenting
on three sources of income – maintenance, service,
and licence – licence income was considered rela-
tively high quality because of its relative sustain-
ability. The following quotations from the
analysts’ interviews are illustrative:
‘We try to assess the earnings growth … is it
coming from the core business? Is it predictable
or not? Low predictability means low earnings
quality.’ (Media analyst)
‘High quality … comes from long term contrac-
tual agreements. Low quality comes from few
one-off contracts.’ (Technology analyst)
The categorisation of sources of earnings,
whether on the face of the income statement or in
the notes, is therefore important to analysts. This is
consistent with the earlier evidence presented in
Table 2, and also with the evidence reported in
Section 2, that the analyst is trying to isolate cate-
gories of earnings that have greater sustainability.
Consistent with theory and empirical research,
analysts also mentioned the cash generating abili-
ty of the company. Out of 35 analysts, 17 per-
ceived the relationship between earnings and cash
flow from operations to be an important determi-
23. nant of earnings quality. They argued that the
greater the component of accruals in reported earn-
ings, the less reliable earnings become for the pur-
pose of forecasting and valuation. Their comments
were restricted to a high-level comparison be-
tween the flow statements – income statement and
cash flow statement – and did not extend to a dis-
cussion of changes in the balance sheet as a route
to understanding the impact of accounting policy
choice on earnings quality. For example, one ana-
lyst commented as follows.
‘We see how earnings are improving. Are these
accounting manipulations? That is why we use
adjusted earnings in PE because reported earn-
ings may not reflect cash flow.’ (Industrial ana-
lyst)
Consistent with the findings of Siegel (1982)
and Bricker et al. (1995), some 11 analysts argued
that consistently-applied, conservative accounting
policies are important in judging earnings quality.
Whether the company uses a consistent method
was mentioned by seven analysts, with change
being an indicator of low quality earnings.
Whether a company adopts conservative account-
ing policies was mentioned by eight analysts.
‘There are lot of ways you can measure it. The
easiest way for retailers is depreciation. If you
write off an asset more quickly then you are
more conservative. You have positive or good
earnings quality. We also look for exceptional
costs in many years. Many exceptional items
mean low quality.’ (Retail analyst)
Finally, some 13 analysts described earnings
24. quality in terms of non-accounting information, in-
cluding factors such as the expected effectiveness
of the company’s business model in its chosen
markets and the perceived quality of management,
including the willingness of the management team
to disclose information and provide guidance. For
example, if the company has many divisions but
only group activities are presented, then this is
deemed to indicate low quality earnings.
Management can be helpful in guiding the estima-
tion of key value drivers, notably revenue, operat-
ing costs and capital expenditure. The following
response reflects some of these wide ranging is-
sues.
‘It is subjective. It depends on the quality of
disclosure. If there are lots of business lines, dif-
ferent products and you only have one account-
ing policy of revenue recognition which is only
Vol. 38 No. 4. 2008 319
10 An indication of the importance attached to manage-
ment control is that several interviewees mentioned frequent
change in earnings estimates as evidence of low predictive
ability.
two lines long – this does not give you much
confidence in terms of quality of earnings.’
(Accounting specialist)
The interview findings reveal that earnings qual-
ity is a multifaceted concept. Analysts broadly
25. consider two types of information in defining earn-
ings quality. The first, accounting-based informa-
tion, which is sourced directly from the financial
statements themselves, comprises income about
the sources of earnings, the impact of accruals and
the effects of accounting policies. The second,
non-accounting-based information, which is de-
rived from data outside the financial statements, is
more broadly concerned with the markets in which
the entity operates and the effectiveness of man-
agement in designing and implementing strategies
to compete successfully in those markets. To illus-
trate, two entities may have the same level of earn-
ings, but one may have a greater proportion of
those earnings in core businesses, backed by cash
and with consistently-applied underlying account-
ing policies, and so will have higher earnings qual-
ity, as judged using accounting-based information.
Alternatively, earnings quality could be judged to
differ on the basis of non-accounting information.
For example, two entities may be equivalent in
terms of the source of earnings, cash-backing and
accounting policy, yet the entity with the manage-
ment team that inspires greater confidence will be
deemed to have the higher quality earnings.
An interesting implication of these findings is
that non-accounting information is used to contex-
tualise and add meaning to accounting data, i.e. the
quality of earnings is not purely an accounting
concept. This finding adds insight to previous
studies, such as Barker (1999) and Breton and
Taffler (2001), which have sought to contrast ac-
counting vs non-accounting information, rather
than viewing each as offering alternative perspec-
tives on accounting data. A consistent finding of
26. previous survey research, such as Pike et al.
(1993), Barker (1999) and Holland (1998) is that
perceptions of management quality and discus-
sions with management on ostensibly non-ac-
counting subjects are a more important source of
information than the financial statements (see also
Day, 1986). If, however, these non-accounting in-
formation sources are in practice important in the
context of interpreting earnings quality (i.e. ac-
counting data) then, especially in the light of the
evidence reported earlier that the PE is the domi-
nant valuation model, the importance of account-
ing information is perhaps understated by these
studies. This interpretation is consistent with
Hussain (2002), who finds a relationship between
the size of firms of analysts and forecasting per-
formance, which he suggests may be due to larger
firms having superior access to company manage-
ment; this finding suggests that non-accounting-
based information is used to enhance the assess-
ment of the quality of current-period earnings and,
so, the forecasting of future earnings.11
5. Evidence from analysts’ reports
The data from the form-oriented analysis is sum-
marised in Tables 3 and 4. It is worth repeating that
this is not a simple word count but rather is a sum-
mary of keywords in context – i.e. words are
counted only if, first, they were used by analysts in
the interviews and, second, they were used in the
same context as in the interviews. Hence the con-
tent analysis is a direct test of the evidence from
the interviews.
Table 4 reports total accounting and non-ac-
27. counting keywords by sector. In total, there are
somewhat more non-accounting keywords used in
the reports, which reinforces the interview evi-
dence above that earnings quality is not an issue of
financial statement data alone. In other words,
while analysts will try to understand earnings qual-
ity from the financial statements themselves, they
acknowledge the inherent limitations of financial
statement data as a basis for understanding and
predicting future performance, relying somewhat
more heavily on information sources that are out-
side the financial statements. A chi-square test, as
reported in Table 4, finds that this difference in
usage between accounting and non-accounting in-
formation is highly significant.
While one might think that the reliance on non-
accounting-based information would vary by sec-
tor, because the financial accounting model is
more or less able to capture economic fundamen-
tals across sectors (see, for example, Hand and
Lev, 2003), a striking feature of Table 4 is that this
is not the case. Viewed on a sector basis, there is a
remarkable consistency in the ratio of accounting
to non-accounting keywords, with the former in
the narrow range 41%–46% across all five sectors.
This consistency suggests that a standardisation of
report-writing style and analytical approach domi-
nates any inherent variation in the usefulness of
accounting information that might exist across
sectors. Possibly this is because fund managers’
valuation models and hence information demands
are similar irrespective of sector and that they
therefore prefer sell-side analysts to present infor-
mation consistently. Alternatively, it demonstrates
inherent limitation in fundamental analysis, be-
28. cause a ‘one-size-fits-all’ approach is employed in
spite of underlying differences in economic and
accounting fundamentals across sectors.
In Table 5, in addition to the accounting and
320 ACCOUNTING AND BUSINESS RESEARCH
11 Hussain (2002) notes that the significance of this effect
appears to hold for short-term forecasts only. He notes but
does not explore the issue of whether broker status has an in-
cremental effect.
Vol. 38 No. 4. 2008 321
Ta
bl
e
3
K
ey
w
or
ds
d
ic
ti
on
93. by
to
ta
l s
en
te
nc
es
.
non-accounting classification used earlier, and in
the light of evidence on analysts’ bias towards
companies, sentences are also classified according
to whether keywords are used in a positive or neg-
ative context. This theme-based analysis adds
power to Table 4 in that the emphasis is now more
active – rather than simply counting keywords in
context, the analysis is directional and indicates
whether or not the analyst has a favourable view of
the company being analysed. So, for example, in
the industrial sector, there are 195 positive refer-
ences to earnings quality, of which the majority
(114) are from non-accounting sources, while
there are 123 negative references.12 Chi-square
tests, reported in Table 5, show a significant dif-
ference within sectors in the frequency of positive
and negative related themes relating to accounting
vs non-accounting information; the results are sig-
nificant at the 1% level for financial, media and re-
tail, and at the 5% level for industrial (although not
94. significant for technology).
Consistent with the evidence in Table 4, non-ac-
counting keywords are used more often than ac-
counting keywords. However, the directional data
in Table 5 offer four additional insights. First, there
are significantly more positive references to earn-
ings quality than there are negative references.
This is reassuringly consistent with the empirical
evidence summarised earlier that analysts have a
favourable bias towards companies, at least in the
context of their public communications. Second,
non-accounting words are used relatively more –
approximately twice as often – than for the non-di-
rectional data reported in Table 4. Alternatively
stated, when an analyst is expressing a positive or
negative opinion about a company’s earnings qual-
ity (as opposed to a neutral opinion), he or she is
more likely to do so by reference to non-account-
ing information. This is consistent with analysts
having the dual objective of generating commis-
sion income by introducing news stories to the
market (in this case in the form of opinions about
earnings quality) while also retaining credibility as
reliable providers of information (Barker, 2000).
Since accounting-based information is more read-
ily verifiable than non-accounting-based informa-
tion, analysts have more latitude in using
non-accounting-based information without being
shown to be wrong. Hence, they are more likely to
use non-accounting-based information as the basis
of news stories. This is consistent with Breton and
Taffler’s (2001) conclusions on the greater usage
of non-financial information, as well as with
Fogarty and Rogers (2005), who argue that while
accounting information provides essential support
95. for an analyst’s arguments, it is typically not used
as the main substance of a case. Finally, there is a
parallel here with Clatworthy and Jones (2003),
who identify inherent bias in the narrative of the
chairman’s statement, relative to the more objec-
tive and audited financial statements; the present
study identifies a comparable bias in the non-ac-
counting-based elements of analysts’ reports.
The third insight from Table 5 is that, in aggre-
gate, there are similar numbers of positive and
negative non-accounting references to earnings
quality, whereas accounting references are more
than twice as often positive as negative. This rein-
forces and adds to the first two insights above.
Given that, first, analysts are inherently biased to-
wards companies and, second, they are incen-
tivised to generate non-refutable news stories, it is
not surprising that negative opinions based upon
readily-verifiable accounting information are used
sparingly: of the total of 2,717 theme scores re-
ported in Table 5, a little fewer than 10% are neg-
ative and from accounting sources. If an analyst
has a biased predisposition towards a company, yet
he or she cannot credibly report only positive opin-
ions about the company, then making a relatively
objective, accounting-based case against the com-
pany is less appealing than making a negative case
using more subjective non-accounting-based in-
formation.
The final insight from Table 5, which is consis-
tent with Table 4, is that the findings are broadly
consistent across sectors. This applies in particular
to the relative usage of accounting and non-ac-
96. counting words, and also in most sectors to the ob-
servation that there is a similar number of positive
as negative non-accounting references to earnings
quality, whereas accounting references are more
than twice as often positive as negative. Hence, for
example, analysts’ disincentive to report negative,
accounting-based news is universal across sectors.
Table 6 explores further analysts’ bias towards
companies by classifying each report according to
whether the analyst is (on balance) positive on
both accounting-based and non-accounting-based
information, negative on both, or positive on one
and negative on the other. For example, if a report
is placed in Category 2, then the analyst perceives
earnings quality positively on the basis of account-
ing information but negatively on the basis of non-
accounting information. This might arise, for
example, if earnings are generated within core ac-
tivities and backed by operating cash flow, but the
management is perceived not to have in place an
effective strategy for sustainable performance.
Overall, the reports are positive, which is again
consistent with the evidence on analysts’ bias
(53% of reports are in Category 1 and uniformly
positive, against 19% in Category 4 that are uni-
formly negative; the corresponding chi-square test,
Vol. 38 No. 4. 2008 323
12 Note that the total number of keywords differs from Table
4 because neutral cases (i.e. where there is neither a positive
nor a negative opinion clearly expressed) are excluded.
97. as reported in Table 6, is highly significant). For
the most part, there is a strong congruence be-
tween the analysts’ views of earnings quality
measured according to both accounting-based and
non-accounting-based criteria – taken together,
Categories 1 and 4 account for 72 of the 98 reports,
or 73%. This is not surprising because it is likely
that there are similar factors behind the analysts’
perceptions of earnings quality from both account-
ing and non-accounting sources. Moreover, given
that the analyst’s aim is to persuade clients to trade
based upon an authoritative analysis and recom-
mendation, a report that contains conflicting sig-
nals is likely to be less effective.
Of the remaining two categories where the sig-
nals are conflicting, it is far more likely that ana-
lysts are positive based upon accounting sources
while being simultaneously negative based upon
non-accounting sources (Category 2, 22% of re-
ports) rather than vice versa (Category 3, 4% of
reports). Of the 57 cases where the analyst is pos-
itive with respect to non-accounting-based percep-
tions of earnings quality, it is most unlikely that he
or she would be negative on accounting criteria
(this happens in only four cases, or 7%). In contrast,
however, if an analyst is, on balance, negative with
respect to non-accounting-based perceptions of
earnings quality, then he or she is more or less
equally likely to be positive or negative on ac-
counting criteria (54% and 46%, respectively).
Hence, if, in spite of inherent bias in favour of
companies, an analyst is willing to be, on balance,
negative about accounting-based (and so relatively
verifiable) earnings quality, then this is typically
98. inconsistent with being positive about non-ac-
counting (and so relatively subjective) perceptions
of earnings quality. In other words, it is difficult
for an analyst to be glowing about a company hav-
ing great prospects and strong management if the
financials do not back up the claims. On the other
hand, a positive view of accounting-based earn-
ings quality does not guarantee that the non-ac-
counting view will be positive also. Here the
analyst has greater choice to express a subjective
opinion, for example, that the company has done
well but does not have the right strategy to sustain
performance. Overall, an analyst can be sceptical
if financial performance is strong but cannot be
optimistic if financial performance is weak. On
balance, therefore, accounting information matters
more than at first apparent.
This conclusion on the relative importance of
accounting information links in with the findings
from Tables 4 and 5. Taking Table 4 alone, it
would appear that non-accounting-based informa-
tion is somewhat more important in analysts’ per-
ceptions of earnings quality, while Table 5 adds to
this conclusion by showing that analysts’ direc-
tional views are even more likely to be based upon
non-accounting sources. Yet Table 5 also shows
that accounting-based information is more dis-
criminatory, in that negative views are relatively
infrequent. The evidence in Table 6 suggests this
infrequency of negative, accounting-based views
understates its importance, because taking a nega-
tive accounting-based view effectively rules out
taking a positive non-accounting-based view,
whereas the reverse is not true. This finding sup-
99. ports and provides insight into market-based evi-
dence that, given analysts’ inherent bias in favour
of companies, the market reacts more strongly to
analysts’ adverse opinions than to their favourable
opinions (e.g. Hirst et al., 1995).
These findings complement prior research into
qualitative information in financial reporting (see,
for example, Smith and Taffler, 1992a, 1992b and
2000). To the extent that there is obfuscation and
speculative content in analysts’ reports, the evi-
324 ACCOUNTING AND BUSINESS RESEARCH
Table 6
Classification of individual reports
Accounting information
Positive dominance Negative dominance Total
Non-accounting
information
Positive dominance Category 1 (53) Category 3 (4) 57
Negative dominance Category 2 (22) Category 4 (19) 41
Total 75 23 98
Note: The figures in parentheses show the number of reports in
each category. ‘Positive dominance’ for ac-
counting information means that within an individual report
there were more positive than negative sentences
concerning accounting-based information relating to earnings
quality, i.e. 75 reports were on balance positive
100. with respect to accounting-based information on earnings
quality. Chi-square is 20.53 (p = 0.000) which sug-
gests there are significant differences in accounting and non-
accounting positive v. negative dominance).
dence here is that this is more likely to arise where
non-accounting information is being used. In con-
trast, accounting-based opinions are more reliably
associated with analysts’ overall opinions, and
where there are conflicting messages in the ana-
lyst’s report, which may confuse rather than assist
the reader (as reported in a similar context by
Smith (1993), greater weight should be assigned to
the accounting-based signal.
This importance for accounting-based informa-
tion is reinforced further in Table 7, which tests the
validity of the findings reported so far by compar-
ing the outcome of Table 6 with analysts’ recom-
mendations. There is an implicit assumption being
made here, which must be acknowledged. In an ef-
ficient market, a company’s share price, against
which an analyst’s recommendation is made, em-
bodies a given information set, for example, pub-
licly-available information in the case of
semi-strong form efficiency. If an analyst is mak-
ing a recommendation, then he or she is implicitly
declaring a state of inefficiency, at least with re-
spect to the information on which the analyst is
recommending the trade. The assumption being
made in Table 7 is that the analyst’s positive or
negative statements with respect to earnings qual-
ity correspond to his or her views on information
that is not impounded in the share price, and which
101. is therefore the basis of the recommendation. This
is a fairly strong assumption but not an unreason-
able one. After all, if the analyst is making the case
to buy or sell, then he or she will stress the reasons
for this in the report on the company and, consis-
tent with the theory and evidence outlined in
Section 2, earnings quality is likely to be a major
focus.
Like other studies (Bradshaw, 2002; Demirakos
et al., 2004), Table 7 reports a dominance of posi-
tive recommendations, which is again consistent
with an underlying bias in favour of companies
(there are slightly more than three times as many
buy recommendations as sells). There is a strong
relationship between buy recommendations and
analysts being positive on both accounting-based
and non-accounting-based information relating to
earnings quality and, similarly, between sell rec-
ommendations and negative/negative. For exam-
ple, out of 53 Category 1 reports, an overwhelming
majority of reports (45 reports) had positive rec-
ommendations and only two had negative recom-
mendations; similarly, there were no buy
recommendations in Category 4. This evidence is
reassuring because it is consistent with earnings
quality as defined in this paper being decision-rel-
evant (i.e. the concept of earnings quality as de-
scribed by analysts in the interviews, and as then
measured in the content analysis of reports by
those analysts is indeed consistent with the invest-
ment recommendations made by the analysts).
Category 2 is noteworthy because it provides
some exception to the rule. The evidence is that if
102. accounting-based information on earnings quality
is positive, then when it comes to a recommenda-
tion the analyst is unlikely to propose a sell, even
if reservations based upon non-accounting infor-
mation are expressed. This suggests that when an-
alysts are positive on the basis of accounting data,
they tend to provide at least neutral recommenda-
tions and hardly any negative recommendations.
The reverse is not true. When negative accounting-
based information dominates (i.e. 23 reports in
Category 3 and 4), only one report had a positive
recommendation and 13 reports had negative rec-
ommendations.
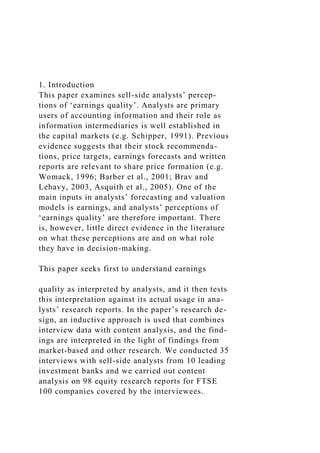
As reported in Panel A of Table 8, we fitted a lo-
gistic regression model to examine the association
Vol. 38 No. 4. 2008 325
Table 7
Association with recommendations
Financial Industrial Media Retail Technology Total
Category 1 Buy 8 7 9 12 9 45
Hold 1 2 0 1 2 6
Sell 0 2 0 0 0 2
Category 2 Buy 5 1 2 2 0 10
Hold 1 0 3 3 3 10
Sell 0 0 0 1 1 2
Category 3 Buy 0 0 1 0 0 1
Hold 0 1 0 0 1 2
Sell 0 1 0 0 0 1
103. Category 4 Buy 0 0 0 0 0 0
Hold 1 1 3 1 1 7
Sell 1 0 1 6 4 12
Total 17 15 19 26 21 98
between positive accounting dominance (i.e.
Category 1 and Category 2) and buy recommenda-
tions. Logistic regression is a generalised linear
model for binary dependent variables that uses the
logit as its link function, and has binomially dis-
tributed errors. The model takes the form
logit(pi) = loge(pi/(1 – pi)) = β0 + β1xi (1)
where pi is the predicted probability of Buy for re-
port i given values for the explanatory variable xi.
Model (1) can readily be rearranged to give the
following expression for pi
pi = exp(β0 + β1xi)/{1 + exp(β0 + β1xi)}
The model parameters β = (β0,β1) are estimated
by iterative reweighted least squares and are inter-
preted as effects on the odds ratio. In the case of a
dichotomous explanatory factor, with levels A and
B, the antilog of the estimated parameter for that
factor, exp(β
^
1), is an estimate of the odds-ratio of
level A of the factor versus level B. For our di-
chotomous categories, the model takes the form
104. (2)
The predicted probability p^ that analysts will
recommend Buy for report i is given by substitut-
ing the parameter estimates from Panel A of Table
8 into equation (2). We find, at the 1% significance
level, that positive accounting views relating to
earnings quality are positively associated with buy
recommendations. We infer that when analysts
have positive accounting-based views relating to
earnings quality, it is likely that they will recom-
mend a buy, irrespective of whether the positive
accounting view is expressed alongside either pos-
itive or negative non-accounting-based views.
We tested another version of the model to see
which category individually best explains ana-
lysts’ buy recommendations. Consistent with ex-
pectations, Panel B reports positive coefficients on
Categories 1, 2 and 3. These are statistically sig-
nificant on Category 1 and 2 at the 1% level, al-
though not significant on Category 3.13 The odds
ratio for Category 1 suggests that the odds of ana-
lysts recommending a stock ‘buy’, having both
positive accounting and non-accounting views re-
lating to earnings quality, is 28.6 times higher ver-
sus Category 4, as opposed to 17.1 (5.1) times in
case of holding positive (negative) views of ac-
counting while simultaneously holding negative
(positive) views on non-accounting – all other fac-
tors being equal. We infer that more positive ac-
counting and non-accounting views relating to
earnings quality should result in more buy recom-
mendations, in particular when the accounting per-
spective is positive. These findings reinforce
105. further the importance of accounting-based infor-
mation on earnings quality, which plays a domi-
nant role in analysts’ recommendations despite a
greater prevalence of non-accounting words and
themes in analysts’ reports.
6. Conclusion
Prior research has evidenced the importance of an-
alysts and financial statement data (notably earn-
ings) in the process of share price determination.
There is relatively little evidence, however, on an-
alysts’ interpretation and use of earnings data.
Combining survey research and content analysis,
this paper contributes to the literature in this area
by focusing on analysts’ perceptions of earnings
quality. It is shown that these perceptions are de-
termined by both accounting and non-accounting
information. Consistent with theory and prior evi-
dence, analysts’ primary concern regarding ac-
counting-based information is to derive a measure
of sustainable earnings. It is striking, however, that
references to earnings quality in analysts’ reports
are more often based upon non-accounting infor-
mation. This is especially the case when a direc-
tional opinion (positive or negative) is being
expressed.
Prior research suggests that analysts’ economic
incentives lead them to introduce news to the mar-
ket in order to generate commission income and to
show a favourable bias towards companies.
Analysts are therefore drawn towards making
greater relative use of non-accounting-based infor-
mation, because it is inherently subjective and
more amenable to variation in opinion and to the
generation of news. When using accounting-based
106. information, analysts are particularly sparing in
their use of negative references to earnings quali-
ty, because these are more readily verifiable and
demonstrably inconsistent with analysts’ inherent
bias in favour of companies. Overall therefore,
positive and non-accounting-based references to
earnings quality are most common, which is evi-
dence that analysts use information opportunisti-
cally.
It is shown, however, that the greater prevalence
of non-accounting-based information does not
suggest that such information dominates analysts’
perceptions of earnings quality, but rather that the
reverse is the case. First, when accounting and
non-accounting information provide conflicting
signals with regards to earnings quality, it is the ac-
counting-based view that provides the dominant
signal. Specifically, where analysts are positive on
326 ACCOUNTING AND BUSINESS RESEARCH
13 The Hosmer and Lemeshow goodness-of-fit test divides
reports up into deciles based on predicted probabilities, and
then computes a chi-square statistic from observed and ex-
pected frequencies. The p-value = 0.432 (chi-square = 8.01)
computed for the fitted model of equation (2) indicates that the
model fits the data very well.
accounting aspects of earnings quality, they are
‘free’ to be either positive or negative on non-ac-
counting aspects, but that if they are negative on
accounting aspects, then they are, in effect, con-
strained to be negative overall. Second, when mak-
107. ing investment recommendations, it is again the
accounting-based signal that is dominant. If ana-
lysts are positive on accounting-based information
they are very unlikely to recommend a sell, re-
gardless of whether their non-accounting-based
view is positive or negative. Yet if their account-
ing-based view is negative, they are effectively
unable to recommend a buy. Overall, accounting-
based information is argued to be more important
than it might at first seem, because while it is not
dominant in its frequency of usage, it is dominant
in its impact on the analyst’s overall assessment of
earnings quality.
This paper raises several questions for future re-
search. First, while the paper identifies bias in an-
alysts’ research, which affects the relative usage of
accounting-based and non-accounting-based infor-
mation in research reports, an open question is
how investors respond to this information – for ex-
ample, do they understand analysts’ inherent bias
and so compensate for it, or are they misled?
Second, while the presentation of financial state-
ments is audited and driven by the requirements of
accounting standards, the relative freedom with
which companies present non-accounting informa-
tion serves to feed analysts’ more liberal usage of
the same. A question therefore is whether greater
standardisation and audit in the reporting of non-
accounting information would reduce bias in ana-
lysts’ research reports. Third, the paper reports re-
markable stability in the relative importance of
accounting-based vs non-accounting-based infor-
mation across sectors, which stands in contrast
with inherent variation in the usefulness of ac-
108. counting information, and which therefore war-
rants further investigation. Finally, while the paper
provides evidence on analysts’ adjustments to re-
ported earnings, which supports prior evidence on
the importance of the PE valuation model, it re-
mains to be explored how, in practice, adjusted
earnings are used in the forecasting of future earn-
ings, how subjective notions of earnings quality
feed into this process and how non-accounting-
based information is used to supplement account-
ing-based information.
References
Abrahamson, E. and Amir, E. (1996). ‘The association be-
tween the information content of the president’s letter to
shareholders and accounting market variables’. Journal of
Business Finance and Accounting, 23(8): 1157–1182.
ASB (1992). FRS 3: Reporting Financial Performance.
London: Accounting Standards Board.
Arnold, J.A. and Moizer, P. (1984). ‘A survey of the meth-
ods used by UK investment analysts’ to appraise invest-
ments in ordinary shares’. Accounting and Business
Research, 14: 195–207.
Asquith, P., Mikhail, M. and Au, A. (2005). ‘Information
content of equity analyst reports’. Journal of Financial
Economics, 75: 245–270.
Barber, B., Lehavy, R., McNichols, M. and Trueman, B.
(2001). ‘Can investors profit from the prophets? Security
analyst recommendations and stock returns’. Journal of
Finance, 56: 531–563.
109. Barker, R. G. (1999). ‘The role of dividends in valuation
Vol. 38 No. 4. 2008 327
Table 8
Parameter and estimates for the model of equation (2)
Panel A: Association between positive/negative accounting
dominance and Buy recommendations
Model Term Estimate SE t-ratio exp(Estimate)
β
^
0 Constant –0.262 0.421 –0.62 0.7692
β
^
CAT Positive accounting
dominance (Category 1
and Category 2) 2.901** 0.623 4.66 18.20
** Significant at 1% level
Model χ2 =25.244, p = 0.000
Panel B: Association between four individual categories and
Buy recommendations
Model Term Estimate SE t-ratio exp(Estimate)
β
^
0 Constant –0.539 0.476 –1.13 0.5833
110. β
^
CAT [Category 1] 3.352** 0.754 4.44 28.56
[Category 2] 2.842** 0.88 3.23 17.14
[Category 3] 1.64 1.25 1.31 5.143
**Significant at 1% level
Model χ2 = 27.508, p = 0.000
models used by analysts and fund managers’. European
Accounting Review, 8(2): 195–218.
Barker, R.G. (2000). ‘FRS3 and analysts’ use of earnings’.
Accounting and Business Research, 30(2): 95–109.
Barker, R.G. (2004). ‘Reporting financial performance’.
Accounting Horizons, 18(2): 157–172.
Barth, M.E., Cram, D.P. and Nelson, K.K. (2001).
‘Accruals and the prediction of future cash flows’.
Accounting Review, 76(1): 27–58.
Bhattacharya, N., Black, E.L., Christensen, T. and Larson,
C.R. (2003). ‘Assessing the relative informativeness and
permanence of pro forma earnings and GAAP rating earn-
ings’. Journal of Accounting and Economics, 36(1–3):
285–319.
Bradshaw, M.T. (2002). ‘The use of target prices to justify
sell-side analysts’ stock recommendations’. Accounting
Horizons, 16(1): 27–41.
111. Bradshaw, M.T. and Sloan, R.G. (2002). ‘GAAP versus the
street: an empirical assessment of two alternative defini-
tions of earnings’. Journal of Accounting Research, 40(1):
41–66.
Brav, A. and Lehavy, R. (2003). ‘An empirical analysis of
analysts’ target prices: short-term informativeness and
long-term dynamics’. Journal of Finance, 58: 1933–1967.
Breton, G. and Taffler, R.J. (2001). ‘Accounting informa-
tion and analyst stock recommendation decisions: a con-
tent analysis approach’. Accounting and Business
Research, 31: 91–101.
Bricker, R., Previts, G., Robinson, T. and Young, S. (1995).
‘Financial analyst assessment of company earnings quali-
ty’. Journal of Accounting, Auditing and Finance, 19(3):
541–554.
Brown, L. and Sivakumar, K. (2003). ‘Comparing the
value relevance of two operating income measures’.
Review of Accounting Studies, 8: 561–572.
Burgstahler, D. and Dichev, I. (1997). ‘Earnings manage-
ment to avoid earnings decreases and losses’. Journal of
Accounting and Economics, 24: 99–126.
Clatworthy, M. and Jones, M.J. (2003). ‘Financial report-
ing of good news and bad news: Evidence from account-
ing narratives’. Accounting and Business Research, 33(3):
171–186.
Clement, M.B. (1999). ‘Analyst forecast accuracy: do abil-
ity, resources, and portfolio complexity matter?’ Journal
of Accounting and Economics, 27(3): 285–303.
112. Day, J.F.S. (1986) .‘The use of annual reports by UK in-
vestment analysts’, Accounting and Business Research,
16(4): 295–307.
Dechow, P.M. (1994). ‘Accounting earnings and cash flow
as measures of firm performance: The role of accounting
accruals’. Journal of Accounting and Economics, 18(1):
3–42.
Dechow, P., Sloan, R. and Sweeney, A. (1995). ‘Detecting
earnings management’. Accounting Review, 70(2):
193–226.
DeFond, M.L. and Hung, M. (2003). ‘An empirical analy-
sis of analysts’ cash flow forecasts’. Journal of
Accounting and Economics, 35(1): 73–100.
Demirakos, E.G., Strong, N. and Walker, M. (2004). ‘What
valuation models do analysts use?’ Accounting Horizons,
18(4): 221–240.
Dugar, A. and Nathan, S. (1995). ‘The effect of investment
banking relationships on financial analysts’ earnings fore-
casts and investment recommendations’. Contemporary
Accounting Research, 12: 131–160.
Easterby-Smith, M., Thorpe, R. and Lowe, A. (2002).
Management Research: An Introduction. London: Sage
Publications.
Fogarty, T. and Rogers, R.K. (2005). ‘Financial analysts’
reports: an extended institutional theory evaluation’.
Accounting, Organizations and Society, 30: 331–356.
Forbes, W.P. and Skerratt, L.C.L. (1992). ’Analysts’ fore-
113. cast revisions and stock price movements’. Journal of
Business Finance and Accounting, 19(4): 555–569.
Francis, J. and Soffer, L. (1997). ‘The relative informative-
ness of analysts’ stock recommendations and earnings
forecast revisions’. Journal of Accounting Research,
35(2): 193–211.
Frankel, R. M., Kothari, S.P. and Weber, J P. (2006).
‘Determinants of the informativeness of analyst research’.
Journal of Accounting and Economics, 41: 29–54.
Graham, C., Cannice, M. and Sayre, T. (2002). ‘Analyzing
financial analysts: what they look for in financial reports
and how they determine earnings quality’. Journal of
Management Research, 2: 63–72.
Gu, Z. and Chen, T. (2004). ‘Analysts’ treatment of nonre-
curring items in street earnings’. Journal of Accounting
and Economics, 38: 129–170.
Hand, J. and Lev, B. (2003). Intangible Assets. Oxford:
Oxford University Press.
Hicks, J.R. (1939). Value and Capital: An Inquiry into
Some Fundamental Principles of Economic Theory.
Oxford: Clarendon Press.
Hirst, E., Koonce, L. and Simko, P. (1995). ‘Investor reac-
tions to financial analysts’ research reports’. Journal of
Accounting Research, 33(2): 335–351.
Holland, J. (1998). ‘Private disclosure and financial report-
ing’. Accounting and Business Research, 28(4): 255–269.
Holsti, O.R. (1968). ‘Content analysis’, in, Lindzey, G. and
114. Aronson, E. (Eds.) The Handbook of Social Psychology.
Reading: Addison-Wesley Publishing Company.
Hussain, S. (1996). ‘Overreaction by security market ana-
lysts: the impact of broker status and firm size’. Journal
of Business Finance and Accounting, 23(9/10): 1223–1244.
Hussain, S. (2002). ‘UK brokers’ characteristics: does size
matter?’ Accounting and Business Research, 32(3):
153–170.
Hussainey, K., Schleicher, T. and Walker, M. (2003).
‘Undertaking large-scale disclosure studies when AIMR-
FAF ratings are not available: the case of prices leading
earnings’. Accounting and Business Research, 33(4):
275–294.
Jacob, J., Lys, T.Z. and Neale, M.A. (1999). ‘Expertise in
forecasting performance of security analysts’. Journal of
Accounting and Economics, 28(1): 51–82.
Jones, J. (1991). ‘Earnings management during import re-
lief investigations’. Journal of Accounting Research,
29(2): 193–228.
Kormendi, R. and Lipe, R. (1987). ‘Earnings innovations,
earnings persistence, and stock returns’. Journal of
Business, 60: 323–345.
Krippendorff, K. (1980). Content Analysis: An
Introduction to its Methodology. Beverly Hills: Sage
Publications.
Krishnan, R. and Booker, D.M. (2002). ‘Investors’ use of
analysts’ recommendations’. Behavioral Research in
Accounting, 14: 129–156.
115. Lin, H. and McNichols, M. (1998). ‘Underwriting relation-
ships, analysts’ earnings forecasts and investment recom-
mendations’. Journal of Accounting and Economics, 25:
101–127.
Lin, S. and Walker, M. (2000). ‘FRS3 earnings, headline
earnings, and accounting-based valuation models’.
Accounting and Business Research, 30: 299–306.
Michaely, R. and Womack, K. (1999). ‘Conflict of interest
and the credibility of underwriter analysts’ recommenda-
tions’. Review of Financial Studies, 12: 653–686.
Miles, M.B. and Huberman, A.M. (1994). Qualitative Data
328 ACCOUNTING AND BUSINESS RESEARCH
Analysis: An Expanded Sourcebook. California: Sage
Publications.
Neuendorf, K.A. (2003). The Content Analysis Guidebook.
Thousand Oaks, CA: Sage Publications.
O’Brien, P., McNichols, M. and Lin, H., (2005). ‘Analyst
impartiality and investment banking relationships’.
Journal of Accounting Research, 43: 623–650.
Ohlson, J.A. (1995). ‘Earnings, book values and dividends
in security valuation’. Contemporary Accounting
Research, 11: 661–687.
Penman, S.H. (2004). Financial Statement Analysis and
Security Valuation. New York, NY: McGraw-Hill.
116. Pike, R., Meerjanssen, J. and Chadwick, L. (1993). ‘The
appraisal of ordinary shares by investment analysts in
United Kingdom and Germany’. Accounting and
Business Research, 23: 489–99.
Schipper, K. (1991). ‘Analysts’ forecasts’. Accounting
Horizons, 5: 105–121.
Schipper, K. and Vincent, L. (2003). ‘Earnings quality’.
Accounting Horizons, 17: 97–110.
Siegel, J.G. (1982). ‘The “quality of earnings” concept –
a survey’. Financial Analysts Journal, March–April:
60–68.
Sloan, R. (1996). ‘Do stock prices fully reflect information
in accruals and cash flows about future earnings’.
Accounting Review, 71(3): 289–315.
Standard and Poor (2002). Measures of Corporate Earnings.
Available at: http://www.standardandpoors.com.
Stickel, S.E. (1991). ‘Common stock returns surrounding
earnings forecast revisions: more puzzling evidence’. The
Accounting Review, 66: 402–416.
Smith, M. (1993). ‘Decision-making in the face of con-
flicting evidence’. Management Accounting, 71(2):
34–36.
Smith, M. (2003). Research Methods in Accounting.
London: Sage Publications.
Smith, M. and Taffler, R.J. (1992a). ‘Readability and un-
117. derstandability: different measures of the textual com-
plexity of accounting narrative’. Accounting, Auditing
and Accountability Journal, 5(4): 84–98.
Smith, M. and Taffler, R.J. (1992b). ‘The chairman’s state-
ment and financial performance’. Accounting and
Finance, 32(2): 75–90.
Smith, M. and Taffler, R.J. (2000). ‘The chairman’s state-
ment: a content analysis of discretionary narrative disclo-
sures’. Accounting, Auditing and Accountability Journal,
13(5): 624–647.
UKSIP. (1993). The Definition of Headline Earnings.
London: United Kingdom Society of Investment
Professionals.
Weber, R.P. (1990). Basic Content Analysis. Newbury
Park, California, CA: Sage Publications.
Wild, J.J., Subramanyam, K.R. and Halsey, R.F. (2003).
Financial Statement Analysis. Boston, MA: McGraw-Hill.
Womack, K.L. (1996). ‘Do brokerage analysts’ recommen-
dations have investment value?’ Journal of Finance, 51:
137–167.
Vol. 38 No. 4. 2008 329
Reproduced with permission of the copyright owner. Further
reproduction prohibited without permission.
118. Instructions
Define the corporation of your choosing, the industry, and the
financial statement and year to be analyzed. Respond to the
following questions about your analysis:
1. Describe the researched corporation and industry being
investigated. Provide background of the corporation and
industry.
2. Provide a detailed explanation of your analysis, including the
corporate and industry financial analysis and ratios for
comparison
3. Discuss the methods used to analyze financial statement and
ratios
4. Describe the results of the financial and ratio analysis as well
as how it served to extend the knowledge in the relevant vein of
research that you are undertaking.
5. Propose recommendations to the corporation’s financial
situation i.e., what would you recommend or suggest be done to
improve the statement results and any ratio metrics you feel are
in need of improvement.
6. Future steps that the corporation might consider improving or
continuing growth, thinking out of the box.
Support your paper with a minimum of five (5) external
resources In addition to these specified resources, other
appropriate scholarly resources, including older articles, may be
included.
Length: 5-7 pages not including title and reference pages and
supporting diagrams or spreadsheets
Your paper should demonstrate thoughtful consideration of the
ideas and concepts presented in the course and provide new
thoughts and insights relating directly to this topic. Your
response should reflect scholarly writing and current APA
standards.