
Recommended
More Related Content
What's hot
What's hot (12)
Viewers also liked
Viewers also liked (17)
Similar to Houstonitopia: Everything You're Looking For
Similar to Houstonitopia: Everything You're Looking For (20)
Recently uploaded
Recently uploaded (20)
Houstonitopia: Everything You're Looking For
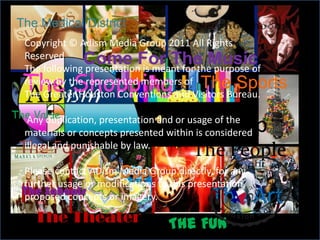
- 1. The Medical District The Neighborhoods Copyright © Adism Media Group 2011 All Rights Reserved Come For The Music The following presentation is meant for the purpose of The Shopping The Sports review by the represented members of The Greater Houston Conventions and Visitors Bureau. The Value HOUSTON Presents Group Media Any duplication, presentation and or usage of the materials or concepts presented within is considered illegal andIT’S EVERYTHING YOU’RE LOOKING FOR! The Food punishable by law. The People Please contactThe Opportunities any ADism Media Group directly, for further usage or modifications to this presentation, The Schools proposed concepts or imagery. The Art The Theater The Fun
- 2. • Introduction: Houston What’s The Problem As the fourth largest city in the United States, Houston is known worldwide for being big bold and innovative. It receives worldwide recognition for Medical, Space, Business & Enviormental advancements and boasts: •One of the largest Art and Theater Districts in the U.S. • Great Education and Business opportunties •Hosts one of Largest shopping malls in the U.S., and offers dozens of family, nature and entertainment attractions. However despite these positive attrirbutes, the city is not traditionally known as a tourist or leisure destination. Why isn’t Houston being recognized? • Observation • The Solution We believe, the problem is people really don’t know Houston, everything you’re looking for! anything about “ Houston”, persay. Offers a multifacueted campaign, that presents the city as a utopian mix of art, culture, music, entertainment, business The city is not viewed as a unique entity, but rather a and opportunity. direct extension of Texas, which evokes ancient imagery of cowboys and the like. By highlighting Houston’s diversity, we reveal a cosmopolitan city that offers a myraid of activities and leisure In addition Houston’s conservative business nature lends entertainment. to the unfair stigmas of the city being dull and boring. Simply put, This new perspective sets the city apart and redefines People rarely get to see all that Houston has to offer. Houston as a contemporary brand that is consumer friendly, wonderful and exciting.
- 3. SAMPLE SLIDES The creative concept for the Houstonitopia campaign started over six years ago with the devastation of Hurricane Katrina. As the city of Houston hosted many New Orleans residents, one artist in particular was especially grateful. As a new resident, visual artist Janetha Richard admits that coming from a place as lively as New Orleans, Houston seemed tamed to say the least. However, as she became familiar with Houston, she was impressed with the wonderment, opportunity, and diversity of the city she has now come to love. “I decided to make a re-emergence with a piece that would pay homage to the city that offered her refuge after the storm, hence the inspiration for the custom mural entitled, ‘Houstonitopia’. My goal for Houstonitopia, is to let everyone see the city as I view it. And with Houston’s rich art culture, what better way to relay that imagery than through art. So I used my paint brush to describe visually what I see when I look at Houston. And of course Houston is so large and vast only a mural would do. It is truly a place that has a little bit of everything for everyone.” Janetha Richard CMM has translated the sentiment and imagery of this artwork into our proposed campaign – “Houstonitopia: It’s Everything Your’re Looking For.”
- 4. • Market Risk • Fiscal Year 2005 Annual Report Annual Report Quarter Ended 1st Qtr. 2nd Qtr. 3rd Qtr. 4th Qtr. Total 2004 2005 Average Fiscal year 2003 200 Revenue $7,746 $8,541 $7,835 $8,065 $32,187 150 Gross profit 6,402 6,404 6,561 6,761 26,128 100 Net income 2,041 1,865 2,142 1,483 7,531 Basic earnings per share 0.19 0.17 0.2 0.14 0.7 50 Diluted earnings per share 0.19 0.17 0.2 0.14 0.69 0 Fiscal year 2004 Interest rates Currency rates Equity prices Commodity prices Revenue $8,215 $10,153 $9,175 $9,292 $36,835 • Fiscal Year 2004 Gross profit 6,735 7,809 7,764 7,811 30,119 Net income 2,614 1,549 1,315 2,690 8,168 Basic earnings per share 0.24 0.14 0.12 0.25 0.76 Diluted earnings per share 0.24 0.14 0.12 0.25 0.75 25% 22% 1st Qtr Fiscal year 2005 2nd Qtr Revenue $9,189 $10,818 $9,620 $10,161 $39,788 25% 28% 3rd Qtr Gross profit 7,720 8,896 8,221 8,751 33,588 4th Qtr Net income 2,528 3,463 2,563 3,700 12,254 Basic earnings per share 0.23 0.32 0.24 0.34 1.13 Diluted earnings per share 0.23 0.32 0.23 0.34 1.12 (1) Includes charges totaling $750 million (pre-tax) related to the Fabrikam settlement and $1.15 billion in impairments of investments. Gross Profit Net Revenue (2) Includes stock-based compensation charges totaling $2.2 billion for the employee stock option transfer program. (3) Includes charges totaling $756 million (pre-tax) related to Contoso subsidiaries and other 10000 matters. 5000 0 1st Qtr 2nd Qtr 3rd Qtr 4th Qtr
- 5. • 1st Year Sales Figures • Market Distribution 180 Market Summary Analysis East West North 100 East West North 80 160 60 140 40 20 120 0 1st Qtr 2nd Qtr 3rd Qtr 4th Qtr 100 • Financial Summary 80 • Our perennial 3rd Quarter boost was larger than expected contributing to an exceptionally strong year. Distribution of 60 sales across the geographic markets looks fairly steady. 40 • Our new product line, released this year, is early in its adoption phase. We expect to 20 see substantial revenue contribution from these products over the next two years. 0 1st Qtr 2nd Qtr 3rd Qtr 4th Qtr
- 6. • Market Share by Division • Business Process Model Product Division Electronics Consumer Goods 2002 10.3 % 1.3% Business Summary 2003 12.1% 2.3% 2004 13.2% 2.2% 2005 17.0% 2.7% Operating Services 12.0% 11.0% 8.9% 9.2% Widget Sales 78.0% 82.3% 82.5% 84.0% Installations 5.3% 7.9% 12.2% 15.1% Changing Supporting (1) Percentages based on domestic comparison to competitors in directly related industries. (2) Percentages based on standing at the end of each fiscal year. (3) Values provided by a third party agency. Optimizing • Organizational Structure • Summary • This has been a pivotal year for the Contoso company in growth, but also development of our infrastructure and business processes. We’ll continue to focus on our internal systems over the next year. Product Human Finance Development Resources • Specific growth areas include Electronics where Contoso has seen as 6.7% increase in market share over the last three years. An area to monitor closely is the Services Design Manufacturing Quality Headquarters Subsidiaries division where market share has dropped Assurance slightly.