Make a difference in a girl's life by donating to her education!
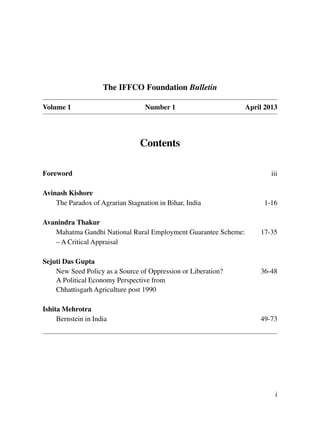
The IFFCO Foundation Bulletin Vol.1 No.1
1. i
Contents
Foreword iii
Avinash Kishore
The Paradox of Agrarian Stagnation in Bihar, India 1-16
Avanindra Thakur
Mahatma Gandhi National Rural Employment Guarantee Scheme: 17-35
– A Critical Appraisal
Sejuti Das Gupta
New Seed Policy as a Source of Oppression or Liberation? 36-48
A Political Economy Perspective from
Chhattisgarh Agriculture post 1990
Ishita Mehrotra
Bernstein in India 49-73
The IFFCO Foundation Bulletin
Volume 1 Number 1 April 2013
2. ii
Foreword
In recent years the IFFCO Foundation has emerged as a credible Think Tank in the area of
rural and agrarian development and has successfully established itself as an authority in
the area. As a Think Tank, it is engaged in policy analysis, policy dialogue and holds
regular workshops and conferences on a wide range of specific topics identified by our
Governing Body as the Foundation’s thrust areas: skill development, women’s
empowerment, cooperative development, governance, art and culture and climate change.
The IFFCO Foundation Bulletin is an effort to connect the field dynamics with theoretical
propositions and gain insights into pressing socio-economic issues in the national and
international context in an effort to inform policy-making.
It is in this background that we, at IFFCO Foundation, are pleased to launch our thrice-
yearly research journal, The IFFCO Foundation Bulletin. It is a small endeavour on our
part to promote rural and agrarian studies, especially by young scholars. Our objective is to
encourage and bring centre-stage new knowledge, build on existing knowledge and subject
existing works to new enquiry in relevant areas. Operating as medium of expression for
field researchers, theorists, policy-makers and grass-roots organisations, the Bulletin explores
how best to respond to challenges faced by rural India. This is imperative considering that
though majority of our population directly or indirectly depends on agriculture, this sector
has been completely bypassed the comparatively higher economic growth rate in recent
years. Moreover, despite concerted efforts of various stakeholders, oppressive and
exploitative socio-economic relations and social structures still persist. Promotion of critical
initiatives and interventions is one way we can arrive at realistic, feasible and viable
alternatives.
The IFFCO Foundation is a non partisan Think Tank. The Foundation does not identify
itself with one particular political ideology, nor does it enter into any ideological alliance.
The opinions expressed by authors are personal and not those of the IFFCO Foundation as
such. However, IFFCO Foundation does provide a forum for free and frank discussion on
important issues facing society, for a multi-perspective analysis and deliberation. I wish
the Bulletin the very best of luck in its mission and hope that in the coming time it will
evolve into a powerful voice and an honourable medium for free-exchange of ideas.
(J.N.L. Srivastava)
Managing Trustee
3. 1
Avinash Kishore Paradox of Agrarian Stagnation in Bihar, India
The Paradox of Agrarian Stagnation in Bihar, India
Avinash Kishore1
Agriculture in Bihar has remained stagnant for more than a century now. Over the last 40
years, value of agricultural output grew at a mere 0.7 per cent per annum—the slowest
growth rate among all states in India. Till recently, this stagnation was blamed on the slow
adoption of yield enhancing inputs like chemical fertilisers, hybrid seeds, irrigation and
agricultural implements like pump sets and tractors. The argument was that the annual
flood risk and semi-feudal production relations reduce farmers’—landowners’ and
sharecroppers’—incentives to invest in productivity enhancing inputs. However, recent
data shows that Bihar has caught up with the rest of India in the use of fertilisers, hybrid
seeds, tractors and pump sets in the last two decades. This catch-up has happened in spite
of poor institutional credit and agricultural extension infrastructure in the state. Still,
agricultural productivity in Bihar continues to lag behind the rest of India. The productivity
is not only low, but also highly sensitive to inter-annual variability in rainfall, more so
than the rest of India even when the state has rich resources of groundwater, considered
the best protection against vagaries of rainfall. We argue that ‘the energy squeeze’ faced
by farmers due to dependence on expensive irrigation with diesel pump sets makes farmers
economise on the use of groundwater, resulting in low and variable yields and low cropping
intensity. Lack of electricity and high price of diesel are the key reasons as to why Bihar is
unable to convert abundant groundwater into livelihoods.
Keywords: groundwater irrigation, agricultural growth, cost of irrigation, weather
dependence
1. Background
In 1876,APMcdonnell, in his ‘Report on Food-grain Supply of Bengal and Behar’, recorded
average rice yield to be 1,000 to 1,200 kg/hectare (ha) in Tirhut and 500 to 1,700 kg/ha in
Champaran (district average being 979 kg/ha) in a good year. He reported double-cropped
area to be 30-32% of cultivated land (cropping intensity of 1.3-1.32). In some parts of
Champaran, cropping intensity was as high as 1.62 (McDonell, 1876 cited in Hunter, 1877/
1
Avinash Kishore, Post-Doctoral Fellow, International Food Policy Research Institute, New Delhi Office,
India.
E-mail: A.Kishore@cgiar.org
The author would like to thank the Challenge Program on Water and Food (www.cpwf.org) for funding
this research. This research was carried out as a part of the IWMI-CPWF project of National River Linking
Project. The author would like to thank Upali Amarasinghe of International Water Management Institute
for sharing the relevant datasets with us. Thanks are also due to Mark Giordano of IWMI for his valuable
comments on an earlier draft.
4. 2
Avinash Kishore Paradox of Agrarian Stagnation in Bihar, India
1976). One hundred and thirty-five years later, in 2011—when the population pressure on
land has increased five folds and most people (74 per cent of the workforce) are still
employed in agriculture as they were in 1876; when nearly two-thirds of land has been
brought under irrigation; and use of chemical fertilisers and hybrid seeds have become
common – average rice yield is not much higher in these parts of Bihar. Cropping intensity,
now at around 1.4, has not increased significantly either. Green revolution by-passed the
state in its first wave in 1960s and 1970s. Subsequently, there was a short interval in the
late nineteen eighties and early nineteen nineties when agricultural growth rate reached
almost 3 per cent per year, one of the highest in the country, though, over a smaller base.
Even this modest growth was short-lived and stagnation has set in again. This article explores
why.
Section two of this article points out an inconsistency in the public data that has misled
some researchers and policy makers to conclude that agricultural growth in the state had
accelerated to more than 5 per cent per annum after 2000-01. We show that it is not the case
after the data inconsistency is accounted for. Section three discusses the slow change in
cropping pattern, cropping intensity, and crop yields in Bihar and uses recent data to show
that productivity has remained low in spite of rapid intensification of input use in the state
over the last three decades. In section four, we present the argument that high cost of
irrigation is one of the main reasons why crop productivity and cropping intensity continue
to be low in the state. Section five, the last section, discusses some policy imperatives for
engendering sustained agricultural growth in the state.
2. Discrepancies in the Central Statistical Organisation (CSO) Data
There have been a number of recent papers and government documents reporting rapid
growth in agrarian economy of Bihar in the last few years (World Bank, 2007; GoI, 2008;
Gulati et al, 2009, GoB, 2009). A report of the Special Task Force on Bihar claims that
from 1993 to 2003, agricultural GDP of Bihar grew at 2.7 per cent per year “which was
next only to West Bengal and Andhra Pradesh among the major Indian states. A study for
the period 1995-96 to 2004-05 not only confirms above findings, but also shows that Bihar
went ahead of both these states, though marginally” (GoI, 2008, page 17-18). Similarly,
Gulati et al (2009) show that Bihar’s agrarian economy grew at 5 per cent p.a. from 2000-
01 to 2007-08, compared to the national average growth rate of 2.9 per cent. A report card
by the Government of Bihar (GoB) claims 5.58 per cent annual growth in agriculture between
2004-05 and 2008-09. All these growth figures have been calculated from CSO’s annual
estimates of value of output of agriculture and allied sectors in Bihar. A closer scrutiny
reveals an inconsistency in the CSO data that inflated the agricultural growth rate of Bihar
over the last decade.
If we look at crop-wise data, we find that there was a sharp decline in value of output of all
major crops: rice (by 48.9 per cent), wheat (by 21.4 per cent), all cereals (by 31.2 per cent)
and all pulses (by 15.1 per cent) in year 2004-05 compared to the triennium before it, and
the slump persisted in the subsequent years. These crops account for about 85 per cent of
the gross cropped area (GCA) of Bihar. During this time (1999-00 to 2005-06), the share of
5. 3
Avinash Kishore Paradox of Agrarian Stagnation in Bihar, India
milk and other livestock products in value of the total agricultural output increased from
27.2 per cent to 38.73 per cent. Clearly, much of the reported high growth in Bihar’s
agricultural gross domestic product (GDP) was driven by growth in the livestock sector.
But did livestock sector grow as sharply as the CSO data suggest? CSO reports a sudden
jump in the value of milk output from 43.3 billion rupees in 2003-04 to 63.6 billion rupees
in 2004-05, an increase of 50 per cent in just one year. Growth rate before and after this
year has never exceeded 10 per cent per year. Increase in value of milk alone is responsible
for 53.6 per cent of the total reported increase in the value of output during this period and
the overall livestock and fisheries sector accounts for 84 per cent of the increase. What
explains the sudden jump in the value of livestock sector output in 2004-05 in Bihar? It is
a data inconsistency.
Unlike crops, whose production is estimated from crop-cutting experiments, estimates of
livestock products (milk and meat) are based on the number of livestock of different types.
Livestock census, which is conducted once in every five years, is the source of these numbers.
Livestock census was not conducted in Bihar in 1987, 1992 and 1997. Projections based on
1977 and 1982 census were used in subsequent years. When actual census was conducted
in Bihar in 2003, after a gap of more than two decades, the number of livestock was found
to be much higher than what earlier projections suggested. This led to a sharp upward
revision in value of dairy and other livestock output in the year 2004-05. This revision in
value of livestock output accounts for a large fraction of the 5 per cent growth in agriculture
and allied sector reported for the period of 1999-2005. Actual growth rate would be much
lower. It also means that the growth rate of agriculture and allied sector from 1982-83 to
2003-04 was somewhat higher than what the CSO data suggests as the CSO underestimated
the growth in the value of livestock outputs during this period. In sum, agricultural growth
in Bihar was slightly faster during 1982-2003 and much lower during 1999-2005 than what
we infer from the CSO data.
If we look at the long-term trend, agricultural growth in Bihar has been the slowest of all
states in India over the last five decades. According to Bhalla and Singh (2009), the
compound annual growth rate (CAGR) in the value of agricultural output was a mere 0.7
per cent from 1962-65 to 2003-06 (see Table 1). Total population and the population of
agricultural workers grew almost three times as fast during this period. In effect, per capita
(and per worker) value of output of agriculture has been shrinking over the last four decades
in Bihar (see Figure 1).
Table 1: Compound Annual Growth Rate (%) in value of outputs (44 crops) in Bihar
State 1962-65 to 1970-73 to 1980-83 to 1990-93 to 1962-65 to
1970-73 1980-83 1990-93 2003-06 2003-06
Bihar 1.12% -0.41% 2.07% 0.26% 0.7%
Source: Bhalla and Singh (2009).
Note: The state of Bihar here includes both Bihar and Jharkhand of today. Agriculture growth after
2006 has been slow too due to three drought years in 2009, 2010, and 2012.
6. 4
Avinash Kishore Paradox of Agrarian Stagnation in Bihar, India
Source: Calculated using NSDP data from Directorate of Economics and Statistics, Government.
There is an impression in the media and policy circles that like the rest of the economy,
agricultural economy of Bihar has also turned corners in the last six years. Recent data on
crop production, however, betrays a different reality. Productivity remains low and subject
to extreme fluctuations. There has not been two consecutive years of growth in the real
NSDPof agriculture in the state between 1993-94 and 2010-11.Ayear of increase is regularly
followed by a decline next year and the magnitude of fluctuation is quite high (GoB, 2009).
The last two rows in table 4 (see p.11) show the coefficient of variation of wheat and paddy
yield of Bihar and all of India for the period of 1993-94 to 2010-11. The coefficient of
variation is significantly higher in Bihar for both paddy and wheat in spite of better irrigation
coverage. Thus, apart from persistent low yields, vulnerability to weather is another cause
of worry for agriculture in Bihar.
3. Understanding Agrarian Stagnation
There are three ways in which the value of agricultural output could grow: i) cropping
pattern shifts from low to high value crops, ii) gross cropped area increases due to increase
in land area sown more than once and iii) crop productivity increases. We explore trends in
cropping pattern, cropping intensity and crop productivity in this section. The fourth source
of growth in value is, of course, increase in the relative price of agricultural products. All
our data are in constant prices adjusted by the GDP deflator.
Figure 1: Per capita NSDP-Agriculture at 1993-94 constant
prices in Bihar, 1960-2006
0
200
400
600
800
1000
1200
1400
1600
1800
2000 1960
1962
1964
1966
1968
1970
1972
1974
1976
1978
1980
1982
1984
1986
1988
1990
1992
1994
1996
1998
2000
2002
2004
2006
PercapitaNSDPin1993-94Rupees
7. 5
Avinash Kishore Paradox of Agrarian Stagnation in Bihar, India
3.1 Cropping Pattern
First let us look at the cropping pattern. Agriculture in Bihar is dominated by the rice-
wheat system (72 per cent of GCA in 2007-08) that offers low returns to land – the scarce
resource, and does not use much labour or water, two resources that are in abundance in the
state. Food grains (cereals and pulses) account for nearly 85 per cent of the gross cropped
area (GCA) – the highest of all states in India and their share in GCA has not significantly
declined over the years, unlike in the rest of the country.
Kharif (monsoon) crop is beset by problems of flood and water logging in large areas of
Bihar. In north Bihar, more than half of all the cultivable land is flood prone. Altogether
floods frequently affect 41 per cent of the total cropped area in Bihar. Lowlands (Tal, diara
and chaunrs) occupy another half a million hectares (mha) of land in both north and south
Bihar (GoI, 2008).2
There is not much scope of crop diversification and incentives are poor
for intensive practices in such areas in Kharif season. Agro-ecology does limit options in
the Kharif season, but Indian Council ofAgricultural Research’s (ICAR) field experiments
show that yields of both rice and wheat crops could be increased by advancing transplantation
of Kharif paddy by a month in areas where flood and water logging is not a problem (Singh
et al, 2001). Advancing the schedule would require intensive irrigation in preparation and
transplantation of seedbeds. With diesel pumps and the current diesel prices, it is
prohibitively expensive. Hence farmers prefer to wait for monsoon rains and forego the
opportunity to increase yields. High cost of irrigation is, therefore, the biggest hurdle in
large scale adoption of this proven strategy of yield enhancement in rice-paddy systems of
Bihar (Kishore, 2004).
Given that options are limited in Kharif, one would expect that farmers would make the
most of rabi (winter) and garma (summer) seasons using cheap labour and abundant water
available to grow crops that may be labour and water intensive, but offer high returns to
land. One such crop is ‘boro’ paddy that farmers in neighbouring West Bengal grow with
much enthusiasm and which propelled the state to high agricultural growth in the mid-
1990s. There is hardly any cultivation in the summer season in Bihar and Rabi cropping is
dominated by wheat (60 per cent of sown area), followed by pulses (18 per cent), maize
(11-12 per cent) and oilseeds (4-5 per cent). Wheat and pulses are neither labour nor water
intensive and also offer low returns to land – the scarce resource in the state.
Wheat yields are low in Bihar and if farmers continue to follow the current crop-calendar,
yields are likely to remain low and somewhat unresponsive to input intensification. The
recommended sowing time for wheat in Bihar is 19-25 November when the winter paddy is
still in the field in large areas of the state. Sowing delayed by a month reduces wheat yield
by more than 50 per cent (Singh et al, 2001). Furthermore, growing wheat requires relatively
low labour input (55 man-days/ha) and only 2-3 irrigations (less than 2,000 m3
of water/ha)
are applied (Kishore, 2004). Net return from wheat is less than Rs 5,000/ha. If one includes
2
Tals (low order monsoon stream), Diaras (saucer shaped flood plain of a river) and chaunrs (remnants of
river course) are low lying lands that remain inundated under deep water throughout the monsoon season
and even afterwards.
8. 6
Avinash Kishore Paradox of Agrarian Stagnation in Bihar, India
implicit costs of family labour and land rent, the net return turns negative (GoI, 2008). Yet
farmers in Bihar continue to grow wheat. Area under wheat has grown from one-sixth (17
per cent) of GCA in 1970-71 to nearly one-third (27.4 per cent) of GCA in 2007-08 even as
yield remains stagnant and returns are low. Similarly, pulses, the second major rabi crop
group, are grown on soil moisture; traditional seeds are used, and are not labour intensive.
Pulse yields are low (<1,000 kg/ha) and have not increased in last three decades. This is
true not only in Bihar, but throughout India.
Thus, with the exception of winter maize, agriculture in Bihar, even in the non-monsoon
season, is set in a subsistence mode with low use of labour and water and low returns to
land.
There is an old body of literature ascribing agrarian stagnation in eastern India to its flood
prone ecology (Ballabh & Sharma, 1992; Ballabh & Pandey, 1999; Boyce, 1987). Crop
yields are indeed lower in parts of Bihar where flood is a bigger problem (see Table 2).
However, the fact that agrarian dynamism is missing even in flood free regions (south
Bihar) and seasons (winter and summer) shows that ecology, though a challenge, is not the
main constraint to agrarian change and dynamism.3
Table 2: Flood affected area and crop yields in the three agro-climatic zones of Bihar
Agro-climatic Zone % Net Sown Area Rice Yield Wheat Yield
affected by floods (tons/ha) (tons/ha)
North-west Bihar 44 1.30 1.81
North-east Bihar 84 1.14 1.58
South Bihar 6 1.88 2.20
Source: Percentage net sown area affected by floods calculated from Annex III, GoI (2008).
Bihar is land scarce but rich in labour and water. There are more cultivators and agricultural
labourers per hectare of cultivable land in Bihar than in any other state of India. There were
3.8 cultivators and agricultural labourers/ha of net sown area (NSA) in Bihar in 2001.
Today this number is close to 5 cultivators/ha of NSA. Providing full employment would
mean creating at least 500 man-days of employment on every hectare of land in Bihar. The
current rice-wheat system can provide at most around 160 days/ha of employment (Joshi et
al, 2004). Clearly, there is a large hidden unemployment in Bihar and the problem is getting
worse as population grows. No wonder, outmigration from the state increased three-folds
between 1991 and 2001 (Gupta, 2009). Agricultural wages are low and freshwater too is
available in plenty at low depths. But this is not reflected in the choice of crops and crop
practices of farmers. Instead of maximising return to land, they seem to be economising on
irrigation, growing crops that require less water and also less labour.
3
Less than 3 per cent of the total land in south Bihar is regularly affected by floods (Source: http://
disastermgmt.bih.nic.in/; last accessed on 18th
October, 2012).
9. 7
Avinash Kishore Paradox of Agrarian Stagnation in Bihar, India
We hypothesize that one of the reasons is high cost of groundwater irrigation due to use of
diesel pumps. These costs can be as high as Rs 120/hour of irrigation for a farmer who buys
water from a pump owner. Most farmers in Bihar are water buyers. Before us, Kalpana
Wilson (1999), in her survey of a village in Nalanda district of Bihar, also found that:
“Different classes of cultivators in Chandkura are unanimous in identifying the increased
costs of irrigation as one of the principal factors currently preventing them from
accumulating agricultural surpluses on any significant scale” (p. 330).
3.2 Cropped Area
Bihar had NSA of about 5.9 mha and gross cropped area (GCA) of about 8.2 mha in 1967.
Both NSA and GCA peaked in the triennium of 1976-78 and have declined since then by
about 5-10 per cent. There has been a reduction of 0.3 mha in NSA and 0.9mha in GCA
from 1976-78 to 2007-08. Overall, the long-term picture is that of stagnation, or even
slight decline in both net and gross cropped areas. The same is true of cropping intensity
(CI). CI has hovered around 140 per cent over this period. For a short while it reached 146-
147%, but did not sustain the high level and has fallen back to its long-term level. This is
slightly higher than the national average (135 per cent), but much lower than CI in
neighbouring states like West Bengal (179 per cent) and Uttar Pradesh (UP) (151 per cent)
with similar population pressures and irrigation ratios.
Increase in population pressure creates demand for agricultural intensification (Boserup,
1965) and access to irrigation makes agrarian intensification possible by allowing cultivation
of second and third crops. In Bihar, rural population and agricultural labour force (cultivators
plus agricultural labourers) have increased by more than 80 per cent; per capita agricultural
land available has reduced by half (from 0.13 ha in 1971 to 0.07 ha in 2001) and gross
irrigated area has increased by 67 per cent between 1971 and 2001. Yet gross cropped area
has remained stagnant or has even declined.
Could floods be the reason for this stagnation and decline in cropped area? Recent reports
suggest that floodwater stays longer and it spreads to a wider area than it used to till a few
decades ago (Mishra, 2008). This could be part of the explanation of stagnation and decline
in cropped area since its peak levels in 1970s. However, the fact that long term trends and
year to year variation in GCA are similar in flood prone north Bihar and largely flood free
south Bihar, suggests that flood and drought are not the main drivers of observed trends in
cropped area and cropping intensity in Bihar. Since the pattern is similar in both agro-
climatic regions, the causal factor is probably something that is common to both regions.3
Our surmise is that sharp increase in the price of diesel is one such factor. We see a decline
in NSA, GCA and cropping intensity in years when retail price of diesel increased sharply.
Our hypothesis is that the patterns in NCA, GCAand CI are driven, at least partly, by diesel
prices. Eighty five per cent of pump sets in Bihar are run on diesel (GoI, 2001) and 97 per
cent of irrigators irrigate their lands from diesel pumps (NSS estimate cited in World Bank,
4
Similarly, the variability in yield of paddy, the main flood season crop, is also about the same for north and
south Bihar: 19 per cent and 17 per cent, respectively.
10. 8
Avinash Kishore Paradox of Agrarian Stagnation in Bihar, India
2007), the highest proportion among all Indian states. Increase in the price of diesel raises
the cost of irrigation for those who irrigate from diesel pumps. The increase in cost is even
higher for water buyers (Shah, 1993, 2007).
In a survey by World Bank in 1997-98 that covered a random sample of 1,035 households
in Bihar, more than 70 per cent of farmers reported buying irrigation (Living Standards
Measurement Survey, 1997-98). This is corroborated by the NSSO 54th round (1999), that
shows that 68.6 per cent of farmers in Bihar report hiring in irrigation services from others
– the highest among all states in India (Mukherji, 2008). Thus, more farmers in Bihar
depend on diesel pumps for irrigation than in any other state and a large proportion of them
buy water. Sharp rise in the price of diesel discourages these farmers from growing second
and third crops, which gets reflected in reduced cropping intensity. Nominal price of diesel
is negatively correlated with cropping intensity (ñ = -0.46). Once we control for time trend,
the association becomes stronger (ñ =-0.61) and it is statistically significant at 99 per cent
confidence level (see Table 3). The coefficient implies that a one-rupee increase in the
nominal price of diesel is associated with reduction in cropping intensity by more than half
a percentage point in Bihar. High diesel prices and the fact that rise in diesel price is
disproportionately passed on to the water buyers (majority of farmers in Bihar are water
buyers) discourages them from growing high value, but water intensive crops. This is a
classic example of ‘economic scarcity’ of water amidst physical abundance.
Table 3: Effect of Price of Diesel on Cropping Intensity and Production of Wheat
(1) (2)
Variables CI Wheat production
Diesel price -0.606* -52.61*
(0.146) (15.24)
Wheat area 1.48*
(0.54)
year 0.324* 98.02*
(0.111) (15.00)
Constant -498.8** -194093*
(219.2) (29047.18)
Observations 33 32
R-squared 0.39 0.93
Standard errors in parentheses
* p<0.01, ** p<0.05
Source: Regression using data on retail price of diesel on 31 March every year, cropping intensity and wheat
production from www.Indiastat.com on 8 October, 2012.
Note: CI is Cropping intensity (%), wheat production is in thousand tons and wheat area is in thousand
hectares.
3.3 Production and Yield: Stagnant in spite of Increased Input Use
Even if the net sown area and gross cropped area stagnate and cropping pattern does not
change, it is possible to increase the total value of agricultural output by increasing yields
and hence overall production of crops. However, yields have been rising very slowly in
11. 9
Avinash Kishore Paradox of Agrarian Stagnation in Bihar, India
Bihar. From 1970-71 to 2006-08, yield growth has been slow for rice (1.27 per cent per
year) and wheat (1.49 per cent per year), two main crops that account for more than 70 per
cent of gross cropped area of the state.5
If we consider all crops, the value of output per
hectare of GCA at constant price has increased at 1.06 per cent per year in Bihar from
1962-65 to 2003-06 compared to 1.6 per cent per year in the eastern region and 2.01 per
cent per year in all-India (Bhalla & Singh, 2009).
Average rice yield in Bihar was 1,271 kg/ha in the triennium ending in 2010-11, which puts
it in the lowest productivity group by the Directorate of Rice Development (DoRD)
classification. If we look at the district level data, all districts of north Bihar, except West
Champaran (1,863 kg/ha), are low productivity districts with yield less than 1,500 kg/ha
while in south Bihar, six out of fifteen districts are in the low productivity group. The
picture is not much better for wheat either. Though wheat yield is higher than rice yield (2
tons/ha), the yield gap between Bihar and the rest of India is higher for wheat than for rice.
This record of stagnation in crop yields is striking especially when it is seen against trends
in availability or use of yield enhancing assets and inputs. Both net and gross irrigated
areas in Bihar have increased by more than 60 per cent between 1971 and 2008. Almost
twice as many cultivators and agricultural labourers are available to cultivate land. Density
of tractors has increased from 4 to 17 per thousand hectares of NSA and use of high yielding
varieties (HYV) is much more common now (see table 4). Even more remarkable is the
increase in the use of chemical fertilisers. In 1971, chemical fertilisers were barely used in
Bihar (9.06 kg/ha) and the use remained quite low till early 1990s (57.2 kg/ha in 1992-93),
but has increased rapidly since then (see Figure 2).
5
We are not considering the most recent triennium (2008-10) because 2009 and 2010 were two consecutive
years of drought with lower yields. If we consider the triennium 2008-10, yield growth will be 0.8 per cent
and 1.4 per cent per year for rice and wheat respectively.
Figure 2: Increase in use of chemical fertilisers (NPK) in Bihar from 1993-94 to 2010-11
0
20
40
60
80
100
120
140
160
180
200
NPKUse(kg/ha)
NPKK Use…
Source: Annexure XXV, GoI (2008) and http://krishi.bih.nic.in/Fertilizer.htm. Site accessed on 4 October
2012.
12. 10
Avinash Kishore Paradox of Agrarian Stagnation in Bihar, India
Table 4: Input Use and Yields of Major Crops in Bihar and India in 1981-82 and 2001-03
Bihar India
2001-03 1981-82 2001-03 1981-82
Labour Availability (Cultivators + 379 222 166 104.28
Ag Labourers/100 ha)
% Area Irrigated 61 49 39 29
Fertiliser Use (NPK/ha GCA) 95.79 21.54 91.45 34.34
Tractor Density (#/1000 ha) ~17 2.46 ~17 3.65
Pumps/100 ha 12.05 6 11.05 4.7
HYV as % cropped area of Rice 73.9 24.7 NA NA
HYV as % cropped area of Wheat 92 76.9 NA NA
Rice Yield (kg/ha) 1,469 858 1,967 1,266
Wheat Yield (kg/ha) 1,912 1,353 2,695 1,691
*CV (Rice yield) [1993-94 to 2010-11] 15% 7%
CV (Wheat yield) [1993-94 to 2010-11] 9% 6%
*CV is coefficient of variation. **NA = Data not available.
Source: Percentage cropped area under HYV for rice and wheat is from Annexure XX of GoI (2008).All other
data are from Indiastat.com accessed on 15th
October 2012.
Labour, irrigation, fertilisers, high yielding varieties and mechanisation are main inputs to
increase yield. Today Bihar is at par or ahead of the national average in availability (or use)
of all these inputs (see Table 4). This is confirmed from several data sources, such as the
NSSO’s Situation Assessment Survey of Farmers in 2002-03 (NSSO, 2005) that shows
that 89 and 91 per cent of farmers in Bihar reported using chemical fertilisers in Kharif and
Rabi respectively as against the national average of 76 and 54 per cent. In a primary survey
done in 18 villages in Bihar by International Livestock Research Institute (ILRI), 100 per
cent of respondents reported using chemical fertilisers and 80 per cent of the land was
under irrigation–almost exclusively irrigated by diesel pump sets (Thorpe et al, 2007). Yet
the yield gap between Bihar and India persists; in fact the gap has widened from the time
when Bihar lagged behind the rest of India in the availability of these inputs. This paradox
of stagnant or declining output in spite of increasing use of inputs is difficult to explain.
Why would farmers continue to invest in fertilisers if the yields are not increasing? Similarly,
why would farmers continue to buy new pump sets if the existing ones are already severely
underutilised due to high price of diesel?
We do not yet have good answers to these questions. Part of the explanation could be in
what Shah (2007) found in Simra village of Bihar, where sharecroppers and marginal farmers
had started intensive cultivation of irrigated onion crop during the summer “as a strategy to
beat the rising cost of irrigation of wheat and other crops” (p. 4008). Onion required thirteen
13. 11
Avinash Kishore Paradox of Agrarian Stagnation in Bihar, India
irrigations (against 3-4 for wheat) and intensive use of fertilisers and labour, but also offered
much higher returns than wheat. As the area under onion expanded, it stimulated more
diesel pump purchases.
It may be so that, as in Simra, farmers across large areas of Bihar are shifting to cultivation
of input intensive high value crops on small parcels of land and this change is not being
fully accounted for by our current data collection system resulting in underestimation of
value of agricultural output. We could not find enough recent primary studies to verify this
conjecture.
Stagnant yield, in spite of high input use, is a puzzle and further research is needed to
unravel it.
4. The Puzzle of Agrarian Stagnation and a Hypothesis
In 1970s, the agrarian stagnation in Bihar and the rest of eastern India was believed to be
due to low use of modern technologies and inputs. The big research question was: why are
farmers in eastern India slow to adopt yield enhancing inputs and practices? However, the
input use patterns shown in table 4 suggest that the big question of 1970s and 80s has
become somewhat irrelevant today. Farmers in Bihar have caught up with the rest of India
in the last two decades by investing heavily into assets like tractors and pump sets and
rapidly increasing their use of inputs like hybrid seeds and chemical fertilisers. If agrarian
dynamism were to be measured by trends in farmers’ investments in yield enhancing assets
and inputs, we see greater dynamism in Bihar than in the rest of India in the last two
decades. So, the question now is why do these technologies and inputs have low returns in
Bihar? In the face of such low returns, why is it that farmers have kept investing in them for
at least two decades now?
We hypothesize that it is the indifferent public policy in the form of poor infrastructure,
poor incentives and non-existent technological support—that negates private initiative and
makes it less productive. In other words, assets created by private initiative and investment
are not being leveraged well due to lack of public support both in the form of infrastructure
and incentives. Nowhere is this clearer than in case of irrigation as we shall show in this
section.
Farmers in Bihar have invested heavily into pump sets and bores over the last three decades.
As a result, access to irrigation is widespread now across all landholding groups. In the
World Bank’s LSMS survey in 1998, 78 per cent marginal, 70 per cent small, 57 per cent
semi-medium, 54 per cent medium and 59 per cent large farmers report all (100 per cent) of
their land as irrigated at least once in the year. Public data also shows that 61 per cent of
NSA in Bihar is irrigated against the national average of 40 per cent. But irrigation intensity
remains low in the state. Farmers under-irrigate their crops because irrigation is expensive,
though plenty of water is available at shallow depths. Almost all groundwater irrigators in
Bihar irrigate from diesel pump sets, either of their own or rented. Retail price of diesel has
increased rapidly over last few years while food prices have failed to keep up (see Figure
3). Price of diesel quadrupled between 1997 and 2009 while farm harvest price of paddy
14. 12
Avinash Kishore Paradox of Agrarian Stagnation in Bihar, India
and wheat increased only half as fast (World Bank, 2007). This worsening of terms of trade
is one of the drivers of trends in production and yield that we observe in Bihar: the return
back to slow growth after a short period of acceleration in 1980s and early 1990s. Rapid
development of groundwater irrigation in 1980s unleashed agricultural growth, but it was
quickly reversed by the pincer movement of falling food prices and rising diesel prices.
This phenomenon was observed in West Bengal (Mukherji, 2006) and eastern UP too: two
neighbouring regions with high dependence on diesel fuelled irrigation. However, the effect
was deeper on agriculture in Bihar because: a) there is a greater dependence on diesel
pumps and b) lower productivity of agriculture in the state to begin with. Low productivity
makes agriculture more vulnerable to an input price shock.
0
10
20
30
40
50
60
70
Litres
Wheat Paddy
Figure 3: Litres of diesel that could be purchased by selling
one quintal of wheat and paddy
Source: Data on retail price of diesel and farm-gate prices of wheat and paddy taken from indiastat.com on 8
October 2012.
High cost of irrigation negates the natural advantage that Bihar enjoys of being water rich.
The drought of 2009 illustrates how. Bihar was one of the states’ worst hit by the drought.
The area transplanted under Kharif paddy went down to 18 mha from the normal area of 34
mha due to the drought. After Jharkhand, this was the highest percentage reduction in area
under paddy of all states. As on 12 August 2009, rainfall was deficient or scanty in 27 of
the 36 meteorological sub-divisions of India. In Bihar, rainfall was 40 per cent below the
normal. The deficit was comparable in Punjab (35 per cent), and much worse in eastern UP
(53 per cent), western UP (68 per cent), Haryana (66 per cent) and Andhra Pradesh (46-59
per cent). Yet, the percentage reduction in area under paddy was much lower in all these
other states. In Punjab, the reduction was barely perceptible in the data (0.7 per cent); in
Haryana it was just 10 per cent. The figures were high for AP (29 per cent) and UP (36 per
cent), yet significantly lower than in Bihar (57.7 per cent). At the national level, there was
15. 13
Avinash Kishore Paradox of Agrarian Stagnation in Bihar, India
a 20 per cent reduction in area under Kharif paddy from 341.44 mha in 2008 to 272.83 mha
in 2009; in Bihar the reduction was 57.7 per cent – more than twice as high (Business Line,
2009). The reason for such a drastic decline in Bihar, and not elsewhere, we claim, is due
to lack of affordable irrigation. In Punjab, farmers coped with rainfall shock by resorting to
groundwater irrigation, made affordable by free electricity. In Bihar, farmers could not
afford to transplant paddy using groundwater irrigation–simply because the cost of providing
that irrigation was uneconomic given the overall crop economics.
Access to irrigation is the best bet against droughts and among the different sources of
irrigation, groundwater from alluvial aquifers provides the most effective drought proofing
(Dhawan,1985). If so, one would expect Bihar (and eastern UP and West Bengal) to be
least vulnerable to droughts. The region has rich stores of groundwater at shallow depths
and a high concentration of mechanised wells to access it. But the latest data on areas left
fallow due to drought shows that the reality is just the opposite: Bihar was one of the worst
affected states by the drought even when rainfall deficit was not the highest there.
The economic scarcity of water in Bihar, in spite of physical abundance of the resource and
investments by farmers, is the reason behind this paradox. Irrigation is completely dependent
on diesel pump sets in the state and diesel is expensive. Further, cash-strapped farmers
have to make upfront payment for diesel in cash. In the absence of institutional lenders,
they borrow at high rates. Bihar is not only the least electrified state of India; it is also the
least banked. Bihar has only one bank branch for every 13 villages and the C-D ratio is 32
per cent, against 73 per cent at the national level (GoI, 2008). High cash outlay of irrigation
combined with costly and scarce credit makes intensive irrigation unviable for most farmers
in Bihar.
The problem of energy squeeze and credit squeeze is only worsened by the price squeeze.
Let us illustrate how. On 20 August 2009, the Agriculture Minister, Mr Sharad Pawar,
announced an increase in the minimum support price (MSP) of rice from Rs 850/quintal to
Rs 1,000/quintal. He also promised open market interventions by Food Corporation of
India (FCI) to keep food grains prices in check and discourage speculators and hoarders.
Increase in MSP of rice would have encouraged farmers of Punjab, Haryana, Western Uttar
Pradesh and Andhra Pradesh—from where FCI procures bulk of rice – to invest up to Rs
4,500/ha in supplementary irrigation and other inputs to drought proof their rice crop. In
Bihar, this increase in support price did not matter to farmers’ crop economics because
there is little procurement by FCI in the state. In year 2005, FCI procured only 7 per cent of
the total Kharif production of Bihar while in AP, Haryana, Punjab, and UP, it procured 78
per cent, 64 per cent, 87 per cent and 28 per cent of Kharif production respectively.
At the same time, open market intervention announced by the government – when
successful—means that prices remain suppressed in spite of scarcity. Producers of Bihar
would have gained little from the first (price support) policy, but lost substantially due to
the second (open market intervention). Thus, in face of a natural calamity (deficit rainfall
in 2009), Bihar was unable to make good use of both nature’s bounty (rich groundwater
aquifer) and the federal government’s generosity (raised MSP). This, we argue, is at the
heart of the agrarian stagnation in Bihar.
16. 14
Avinash Kishore Paradox of Agrarian Stagnation in Bihar, India
5. Policy Imperatives
Bihar’s gross state domestic product (GSDP) increased at 9 per cent per year between
2004-05 and 2009-10, and yet, the head count ratio (HCR) did not decline from a high 55
per cent. With 600 poor people/sqkm, Bihar harbours the highest concentration of rural
poverty in the world. The impressive growth in the state’s economy failed to make any dent
in poverty because even as the overall economy grew rapidly, agriculture remained stagnant.
Rapid growth in agriculture is essential for poverty reduction when 90 per cent people in
the state still live in villages and 81 per cent of workforce reports agriculture as main
source of income.
Government of Bihar is making serious efforts to jumpstart agricultural growth. The state’s
planned expenditure on agriculture has increased from Rs 0.25 billion in 2004-05 to Rs
8.44 billion in 2011-12—a thirty-fold increase. Bihar became the first state in India to
constitute an agriculture cabinet with ministers from 17 departments to improve coordination
in the government in implementation of agricultural projects. At the grassroots level,
agricultural extension workers called krishi-mitras (farmers’ friends) have been hired in all
panchayats of the state to bring new technologies and practices to farmers. The state
government is offering generous subsidies on farm implements (tractors, power tillers,
harvesters, pump sets, etc.) and quality seeds and has simplified the process of accessing
these subsidies. Fifty seven thousand kilometres of new roads have been built between
March 2004 and March 2011, raising the road density from 78.41 km to 138.74 km. per
100 sqkm of area (www.indiastat.com) and the quality of existing roads has also improved.
All these efforts and investments, however, have failed to unleash agricultural growth in
the state. Agricultural productivity remains low and variable. We propose that this is partly
because there has been no improvement in power availability in the state. Power situation
remains grim in rural Bihar. More than half of the villages do not have electricity and in the
other half, supply is poor and unreliable. Rural electrification has to improve in Bihar to
catalyse agrarian dynamism. Investing in improving rural power supply can be the most
effective stimulus plan for the stagnant agrarian economy of the state. Both the state and
the centre should come together to make it possible before the end of the twelfth five-year
plan.
The state government’s ongoing programme of subsidising diesel pump sets is unlikely to
work. As several large surveys (like LSMS, 1997-98; NSSO, 1999; Thorpe et al, 2007)
show, almost all of the cultivable land in Bihar has access to irrigation. What Bihar needs
is intensification of irrigation and not so much the expansion of it. Intensification will take
place only if the variable cost of irrigation comes down. Rural electrification will make it
possible. Providing one time capital subsidy to small and marginal farmers, along with
metered electricity connection at non-trivial tariff rates (thereby keeping subsidy to a
minimum), much like the neighbouring state of West Bengal (Mukherji et al. 2009), will
make irrigation much cheaper than the current option of diesel pumps. Provision of electricity
will have several other spin-off effects too, such as investment in cold storages and agro-
processing units that will enable farmers to diversify towards high value perishable crops
such as fruits and vegetables.
17. 15
Avinash Kishore Paradox of Agrarian Stagnation in Bihar, India
References
Ballabh, Vishwa, Sharma, B.M., 1992. HYV adoption, productivity gaps and production adjustment
mechanisms in flood-prone areas of Uttar Pradesh: a synthesis. Research Report 5, Anand: IRMA.
Ballabh, Vishwa, Pandey, Sushil, 1999. Transitions in rice production systems in eastern India:
evidence from two villages in Uttar Pradesh. Economic and Political Weekly, Vol.34, No.13. pp.A111-
A116.
Bhalla, G.S., Singh, Gurmail, 2009. Economic liberalisation and Indian agriculture: a statewise
analysis. Economic and Political Weekly, Vol.44, No.52. pp. 34-44.
Boserup, Ester, 1965. The conditions of agricultural growth: the economics of agrarian change
under population pressure. Chicago: Aldine.
Boyce, James K., 1987. Agrarian impasse in Bengal: agricultural growth in Bangladesh and West
Bengal 1949-1980. New York: Oxford University Press.
Business Line, 2009. Paddy acreage shortfall widens to almost 70 lakh hectares, 27 August, Page
16.
Dhawan, B. D., 1985. Irrigation performance during drought. Economic and Political Weekly, Vol.20,
No.28. pp.1191-1196.
Hunter, W.W., 1976. A statistical account of Bengal. Vol. XIII: Tirhut and Champaran. New Delhi:
Concept Publishing Company.
Gulati, Ashok, Tushaar, Shah, Sreedhar, Ganga, 2009. Agricultural performance in Gujarat since
2000: can it be a divadandi (lighthouse) for other states? IWMI and IFPRI Joint Working Paper.
Government of Bihar, 2009. Towards accelerated agricultural development in Bihar. Report of the
Steering Group on Vision of Agricultural Development in Bihar. Patna: Government of Bihar.
Government of India, 2001. Report of the 3rd Minor Irrigation Census, Ministry of Water Resources
Development. New Delhi: Government of India.
– 2008. Bihar’s agriculture development: opportunities & challenges. A Report of the Special Task
Force on Bihar. New Delhi: Government of India.
Gupta, Dipankar, 2009. Implement Bandyopadhyay commission recommendations for land reforms
in Bihar, Bihar Times.
Available at: http://www.bihartimes.com/Newsbihar/2009/August/Newsbihar07Aug4.html
(Accessed 24 December 2009).
Joshi, P. K., Gulati, Ashok, Birthal, Pratap S., Tewari, Laxmi, 2004. Agriculture diversification in
South Asia: patterns, determinants and policy implications. Economic and Political Weekly, Vol.39,
No.24. pp.2457-2467.
Kishore, Avinash, 2004. Understanding agrarian impasse in Bihar. Economic and Political Weekly,
Vol.39, No.31. pp.3484-3491.
LSMS, 1997-98. Survey of living conditions in Uttar Pradesh and Bihar. World Bank.
Mishra, Dinesh Kumar, 2008. Floods – need to look beyond the blame game, Splash, pp.12
Available at: http://www.indiaenvironmentportal.org.in/content/floods-need-look-beyond-blame-
game
18. 16
Avinash Kishore Paradox of Agrarian Stagnation in Bihar, India
[Accessed at: 10 January 2010].
Mukherji, A., 2006. Political economy of groundwater markets in West Bengal, India: evolution,
extent and impacts. PhD Thesis, University of Cambridge, United Kingdom.
– 2008. Spatio-temporal analysis of markets for groundwater irrigation services in India, 1976-77 to
1997-98. Hydrogeology Journal, Vol.16, No.6. pp.1077-1087.
Mukherji, A., B. Das, N. Majumdar, Nayak, N.C., Sethi, R. R., Sharma, R. R., 2009. Metering of
agricultural power supply in West Bengal, India: who gains and who loses? Energy Policy, Vol.37,
No.12. pp.5530-5539.
NSSO, 1999. 54th
round: Cultivation Practices in India, January 1998-June 1998, Department of
Statistics and Programme Implementation, Government of India, New Delhi.
– 2005. 59th
round: Some Aspects of Farming, 2003, National Sample Survey Organisation,
Department of Statistics, New Delhi, Government of India.
Shah, Tushaar, 1993. Groundwater markets and irrigation development: political economy and
practical policy. New Delhi: Oxford University Press.
– 2007. Crop per drop of diesel? Energy squeeze on India’s smallholder irrigation. Economic
and Political Weekly, Vol.42, No.39. pp.4002-4009.
Singh, Sita Ram, Gautam, U. S., Kumar, Ujjwal, Rahman, A., Sinha, S. K., 2001. Groundwater
development to enhance surface and rain water utilisation and agricultural productivity in southern
Bihar, ICAR-IWMI Ground Water Policy Initiative, Policy Dialogue on Groundwater Management,
CSSRI.
Thorpe, W., Erenstein, O., Singh, J., Varma, A., 2007. Crop–livestock interactions and livelihoods
in the Gangetic plains of Bihar, India. Crop – livestock interactions scoping study – Report 3. Research
Report 12. Nairobi: ILRI (International Livestock Research Institute).
Wilson, Kalpana, 1999. Patterns of accumulation and struggles of rural labour: some aspects of
agrarian change in central Bihar. Journal of Peasant Studies, Vol.26, Nos.2-3. pp.316-54.
World Bank. 2007. Bihar agriculture: building on emerging models of success. Agriculture and
Rural Development Sector Unit, South Asia Region Discussion Paper Series, Report No. 4.
19. 17
Avanindra Thakur MGNREGA in Bihar
Mahatma Gandhi National Rural Employment Guarantee Scheme:
A Critical Appraisal
Avanindra Thakur1
Employment generation was one of the most important objective and a challenge for Indian
Planning since Independence. Several decades, policies and initiations later, an evaluative
retrospect hardly satisfies us in terms of achievements in this regard. Nevertheless, the
decades of 1970s and 80s might be seen as exceptional decades, undoubtedly reflecting
some improvements in employment conditions. A brief note of the then existing political
scenario and policy regime indicates comprehensible government initiations and focus on
employment generation. But the streak of silver lining proved short lived. The initiation of
neo-liberal reforms since 1991 and the consequent withdrawal of the state from various
activities virtually doomed the overall prospects of employment generation. The neo-liberal
regime has been witnessing accelerating unemployment rate as well as deteriorating
employment conditions. An improvement in the existing condition was deemed necessary
and the enactment of a ‘right’based employment programme was the need of the day. The
culmination of intellectual engagement found its creative manifestation in the Mahatma
Gandhi National Rural Employment Guarantee Act. Time is ripe to analyse the impact of
this scheme and the extent to which it has succeeded in achieving its goal. Criticisms are
rampant and often correctly so about the inadequate allocation of funds, poor
implementation of the programme, widespread corruptions etc. for the unsatisfactory
performance of MGNREGA. Despite the well acknowledged weaknesses, the role of
MGNREGA in putting upward pressure on rural wage rate, enhancement in the negotiating
power of the rural labour in general etc. cannot be denied. This paper reviews the scheme
and analyse its relevance in the present day context.
Keywords: MGNREGA, employment, neo-liberal reforms, fiscal and monetary policy, real
wage.
1. Introduction
In a regime of neo-liberal reforms where state has continuously been retreating from an
active role in the economic process, the initiation of the Mahatma Gandhi National Rural
Employment Guarantee Scheme (MGNREGA) can be definitely termed as a well intentioned
and timely exception. The neoliberal policies have been marked distinctly by the decline in
public expenditure, credit availability in rural sector and massive cut in the overall subsidy
in the economy; particularly in farm related subsidies.Against this backdrop, MGNREGA,
despite being in contrast to the overall policy framework, is one of the most progressive
1
Avanindra Thakur, PhD candidate, Centre for Economic Studies and Planning, School of Social Sciences,
Jawaharlal Nehru University, New Delhi, India.
Email: avanindra.cesp@gmail.com
20. 18
Avanindra Thakur MGNREGA in Bihar
step seen in the last two decades. Time is ripe to investigate the factors responsible for this
policy initiation and to evaluate its performance and suggest remedies for inadequacies, if
any, in order to have a more comprehensive, integrated and focussed targeting of the problems
of rural economy.
With an introductory prelude about the overall macro-economic conditions and policies
since 1991 and analysing their impact on the employment conditions in rural areas, this
article proceeds with a critical appraisal of MGNREGA. This paper relies on various rounds
of National Sample Survey (NSS) reports for the all India scenario and the primary data
draws on a household survey conducted by the author in some of the villages in Katihar
district in Bihar during the first half of 2012. The change in the overall employment
conditions vis-à-vis the initiation of MGNREGA would be emphasised by looking at the
trends and patterns evident in employment related data and reports on MGNREGA in the
period since its start in 2006. The field based analysis of MGNREGA and its impact would
provide a critical vantage point to analyse the policy and its actual implementation. The
concluding part of the article suggests some measures in order to have more adequate and
long term redressal of the employment related problems prevailing in rural India.
2. Situating MGNREGA: Macroeconomic Policy and Employment Conditions
post ’91
2.1 Employment Conditions Prior to the Enactment of MGNREGA
Broadly speaking, during the last three decades the developing world has been witnessing
the ascendency of market led reforms and India has been no exception. The implications of
the globally ascendant neo-liberal policy regime for the employment scenario and overall
well-being of labour have generated much debate both in favour as well as in opposition.
Persistence of high levels of unemployment in different regions of the global economy
during the recent decades of neo-liberal reforms lends strong support in favour of the view
that the macro-economic policies based on such doctrines are hardly consistent with a
progressive employment agenda, even in the structurally more advantageously placed
economies. As is well-known, one of the major premises of neo-liberalism is the argument
that in the case of developing countries, the inward looking capital-intensive import
substitution policy has resulted in a bias against agriculture and other employment-intensive
activities, with respect to both the domestic and external markets and thus labour utilisation
had been well below potential. It has been hoped by the advocates of neo-liberalism that
the market reforms would rectify this bias and facilitate a surge of investment, both from
domestic and foreign sources, in labour-intensive projects with significant export-orientation.
However, all the available evidence since the ascendancy of the neo-liberal economic policy
package leave very little scope of optimism about greater labour utilisation in the global
economy, through changes in the structure and intensity of employment.
The developing world provides overwhelming evidence of very low employment elasticity
in recent years, thus supporting the view that the employment elasticity of whatever growth
that has occurred in the recent years has been extremely low. Based on a careful survey of
the relevant literature, Chandrasekhar and Ghosh (2002) conclude: “what is striking is how
21. 19
Avanindra Thakur MGNREGA in Bihar
most of the employment elasticities appear to be. Even more striking is the negative
elasticities that emerge in some cases, also in a range of manufacturing sectors that are
typically thought of as being labour-intensive”. The study also reports that employment
scenario for aggregate industry, rather than just manufacturing, has been as grim during the
period under consideration. The conclusion that emerges is: the period of globalisation and
liberalisation has been far off the mark in creating a conducive scenario from the point of
view of employment expansion. Clearly the hopes of the advocates of neo-liberal market
reforms seem far from being materialised.
In the Indian context, by all accounts, the post reform decades provide a progressively grim
depiction of employment scenario across all sectors of the economy. The rate of employment
generation during the recent years has fallen considerably and the unemployment rate, on
current daily basis, as per the NSS rounds, went up to over 9 per cent in 2004"05 (NSS 61th
Round) from around 6 per cent in 1993-”94 (NSS 50th
Round). Moreover, during the entire
period of planned development, not unexpectedly, increase in the incidence of unemployment
has been sharper for relatively more vulnerable social and economic groups. Various major
data sources such as the Economic Census of 2001, Population Census of 2001, Employment
Exchange statistics for different years, the various rounds of NSS etc., have acknowledged
the increasing gravity of the unemployment problem.
A careful gleaning through the numbers unmistakably brings forth the fact that the challenges
of labour absorption for Indian economy have been further aggravated in the post reform
era. Moreover, even the traditional parking lot, namely agriculture, has been unable to
perform the function of the residual sector and the rural areas have borne the brunt of sharp
deceleration in employment generation. In fact, the much talked about process of
diversification of employment from the mid-1970s to the late 1980s, away from agriculture
and primary activities towards a variety of non-agricultural avenues, primarily through the
generation of employment in public sector as well as promotion of suitable environment
for non-agriculture self employment, has tended to come under pressure and the growth of
latter has also slowed down considerably. As is well known, it was primarily on account of
very significant acceleration in public expenditure in rural areas in 1970s and 80s that the
above noted diversification had gathered momentum. However, the 1990s witnessed a policy
shift for the worse in this regard.
Factors like substantial compression of rural development expenditures, increasing input
prices, vulnerability to world market price fluctuations due to greater openness, inadequate
/non-existent crop insurance and substantial weakening of the provisioning for credit, along
with the governments’ apathy to the demand for remunerative prices for farm produce are
among the obvious causal correlates of decline in the labour absorption in the rural economy
as a whole (Sen, 1996; Patnaik, Utsa, 2007; Jha 2007; Chavan, 2004; Chandrasekhar &
Ray, 2004; Patnaik, Prabhat, 2007).
During the period from 1991 to 2004"05, the condition of rural employment has not been
much different from the overall scenario and was marked by relatively worsening trends.
This is also evident in the trends and patterns of rural wage during this period. The rate of
growth of real wage for the period since 1991 has not been impressive in spite of some rise
22. 20
Avanindra Thakur MGNREGA in Bihar
in the real wage during the decade of 1990s.The growth of real wage rate shows a definite
pattern and strong correlation with various policy related factors. For instance, with the
increased government spending in rural areas, the decade of 1980s witnessed a sharp rise
in the rural wage for both agriculture and non-agriculture sector. The macroeconomic
instability of late 1980s had halted this trend and for the period from 1987 to 1993"94 there
had been sharp deceleration in the real wage rate for both these sectors in the rural areas.
However, from 1993"94 to 1999"2000, the rural economy witnessed some acceleration in
these wage rates which was partially the base effect and partially because of the long term
stagnation in nominal wage of rural labour and consequently their raised voices against it.
This acceleration did not sustain for long and during the next period from 1999"2000 to
2004"05 there was a sharp deceleration in the real wage rate in both the agricultural and
non-agricultural sectors. During the entire period from 1987"88 to 2004"05, the rate of
growth of real wage on an annual basis was substantially lower than what had been observed
for the period from 1993"94 to 1999"2000. Quite expectedly, the deceleration of real wage
in rural areas affected the absorption capacity quite adversely. Sure enough, the deceleration
of real wage in rural areas has a lot to do with the decline in the absorption capacity of the
farm sector as well as lack of non-farm employment opportunities during the reform period.
Deficiencies in the demand for additional labour, in obvious ways, were the effect of
contractionary fiscal and monetary policies that have been given paramount importance
under the neo-liberal reform period.
2.2 Employment Conditions After the Enactment of MGNREGA
After the defeat of the National Democratic alliance in 2004, it became increasingly clear
that a significantly large proportion of the Indian population did not find ‘India Shining’,
in spite of the announcement of large scale infrastructural projects, some of which even
targeted to the rural areas. However, the political necessity of the hour was aptly identified
to be the direct targeting of the lower rung of the population. Under the pressure of some of
the coalition parties, the newly formed government of the United Progressive Alliances
initiated the right based employment programme in the name of National Rural Employment
Guarantee Scheme in 2006 in selected 200 districts and in 2008 it was extended to all the
districts. This act guaranteed 100 days of employment at a statuary minimum wage for all
the households who demanded manual work. In case of unavailability of work on behalf of
the concerned authority, the demanding household is to be given compensation.
Though the programme was started with great enthusiasm as well as expectations on behalf
of the concerned academicians and policy makers, the performance, ever since the beginning,
has clearly been off the mark. The actual benefits for the target groups as well as spill over
effects on the other part of the economy remained far below the potential. Nevertheless,
even after accommodating several systemic as well as implementation level inadequacies,
the overall impact of this employment guarantee scheme has been sufficient enough to
make the period since its inception, particularly in relation to the employment conditions
of rural India, a distinguishable part of the reform era. If we look at the various indicators
reflecting the performance of the programme now known as Mahatma Gandhi National
Rural Employment Guarantee (Act) Scheme (MGNREGA), its deficiencies are quite evident.
23. 21
Avanindra Thakur MGNREGA in Bihar
Table 1 shows the summary of the performance of MGNREGA based on latest round of
NSS reports (66th round).
Table 1: Employment pattern under MGNREGA
Job
cards
Less
than 20
days
20 to
50
days
50 to
100
100
and
above
Total
Job card
no work
Sought
and not
get
Did not
seek
job
Average
days
Persons per
thousand
347.2 102 76 63 2 242 105 193 538 37
Percentage
of job cards
holder
100 29.38 21.9 18.15 0.06 69.7 30.3
Source: Employment and Unemployment Report, 66th
round NSS
Till 2010, i.e. the end of the survey of 66th round, nearly 34.72 per cent of the rural population
was given the job card. Of course this proportion is very high not only in terms of absolute
number but also in terms of the gross labour force participation rate in rural India. There is
no doubt that as far as distribution of job cards is concerned, the success rate of this
programme has been impressive. However, in terms of providing employment to these job
card holders, the MGNREGA remained far below the targets. In terms of percentage, it is
evident from the table that only 0.06 per cent of the total job card holders got the full
employment days of 100 and more days. A significant proportion of them, nearly 29.38 per
cent of job card holders got less than twenty days of work. In other words, more than 29 per
cent of job card holders got less than one fifth of the total number of working days that is
provided in the Act. More importantly, nearly half of the job card holders did not get even
fifty days of employment under this scheme. Evidently, the provision of 100 days of
employment to all the interested households is nowhere near the target. More than 30 per
cent of the eligible persons did not get any employment under this scheme. Besides, more
than 19 per cent of the rural population sought for job and did not get any; some of them
did not even get job cards. Thus, in spite of having a right based approach, the programme
has hardly been able to ensure the realisation of the rights of the targeted population.
In terms of the wage rate given to these workers, the average for men and women was
90.93 and 87.20 rupees respectively in 2009"10. Thus the average wage rate for a person as
a whole during the same period was nearly eighty-nine rupees. Therefore, as compared
with the minimum wage rate for different states, the average wage rates for both male and
female remained significantly lower than that stated in the Act itself. Nonetheless, for
females, this wage rate has been much higher than the prevailing rate in rural areas for
casual work other than public works.
An attempt to evaluate the scheme requires a prior understanding of the basic objective of
such right based approach. The role of MGNREGA could easily be defined by addressing
the broad issues related to the well-being of rural labour during the neo-liberal policy
regime. First among them which needed to be addressed on priority basis is the decline in
24. 22
Avanindra Thakur MGNREGA in Bihar
the labour absorption capacity of the entire rural economy in general and the agricultural
sector in particular. Second, near stagnation in real wage rate in rural areas for male and
female, both in agriculture and non-agriculture. Third, increasing growth rate of rural-
urban migration and consequently worsening of living conditions of migrant population in
urban areas. Fourth, in an economy where everything is getting monetized, the real
purchasing power of the rural mass in general has continuously been subject to contraction.
And last, given the inadequacies regarding the infrastructural facilities, decent livelihood
conditions of more than 70 per cent of the country’s population is hardly achievable.
Therefore the need as well as focus of the right based employment scheme should have
been to address these problems in an adequate manner. Thus, in order to assess the efficiency
of the scheme, one should necessarily look at the performance of MNREGA with respect
to addressing these issues.
With regard to the first issue, it is quite evident that the initiation of the scheme improved
the availability of the employment days in rural areas but has hardly been satisfactory.
Thus, if we look at the availability of employment days in rural areas, though there has
been some improvement after the initiation of this scheme, the scale of the improvement
has been far from satisfactory. The average number of days available under this scheme
was only 37 days during 2009"10 as observed by NSS 66th round. Clearly, this number is
little more than one third of what was mentioned in the scheme as the minimum provision.
So, in terms of generating sufficient days of employment which would be adequate to
compensate the decline in the systemic labour absorption capacity in rural areas, MGNREGA
has had a limited impact. Nevertheless, in some regions the performance of the scheme
attained appreciable results.
On the second front, i.e., on the issue of stagnant real wage in rural areas, the impact of
MGNREGA has really been significant. In spite of the fact that the enactment of the scheme
was not sufficient enough to bring about tightness in the labour market, it remained
instrumental in raising the floor wage rate in rural areas in both farm and non-farm sectors.
As may be seen in figure 1, there has been a sharp rise in the real wage rate in rural areas
for both males and females in agricultural as well as non-agricultural works during the
period 2004"05 to 2009"10. Further, the rate of rise has been significantly higher for females
in both agricultural and non-agricultural works. This is not unexpected, as under the scheme
there is the provision of same wage rate for males as well as females.And even in realisation,
the gap between male and female wage rates under the scheme remained more or less
moderate and within an acceptable range. Till 2004"05 the real wage rate for females was
much lower as compared to their counterpart, and therefore, with the provision of equal
wage for males and females, the wage rate for female workers rose at a much higher rate
than that of male workers.
25. 23
Avanindra Thakur MGNREGA in Bihar
Figure 1: Growth in the real wage during the last three decades in rural areas
0.00
10.00
20.00
30.00
40.00
50.00
60.00
70.00
80.00
90.00
38 43 50 55 61 66
agr male nonagr male agr female
nonagr female total male total female
Source: Various rounds of NSS reports.
On the issue of migration, the impact of MGNREGA has been significantly lower than
expected. The generation of additional employment as well as income under this scheme
has been too low to curb the rate of growth of migration. In other words, the additional
income generated under this scheme nowhere matched the income of the rural migrants.
Thus, migration to urban areas remained an important labour strategy to ensure decent
livelihood conditions in rural areas. Nonetheless, the NSS report on migration in 2007-08
reflects a clear deceleration in the growth rate of migration during recent period. This
deceleration can be identified in obvious ways as an impact of MGNREGA and thus to a
certain extent, it still holds the promise of casting a significant impact on the incidence of
migration, if implemented at a high level of efficiency.
Last, the requirement of having better infrastructural facilities has been the least addressed
issue. Inadequacies in infrastructural development under this programme can be explained
through two perspectives. Firstly, the primary objective of the scheme being generation of
employment as well some kind of Keynesian multiplier in the rural economy, the role of
the MGNREGA in creating asset and developing infrastructure at the village level largely
remained ignored. Second probable cause is the high level of corruption involved in the
scheme. In most cases, this led to improper planning as well as underutilisation of workers.
Further, since a major part of the working days are only provided on paper and not at the
26. 24
Avanindra Thakur MGNREGA in Bihar
actual ground level, the level of work actually done and shown in the official paper has
been substantially different, both in quantity as well as quality. Furthermore, given the
restriction in the use of machineries in any construction project, the work performed under
this scheme itself suffers from severe limitations, both in terms of quality as well as quantity.
In other words, mostly the work performed under this scheme remained limited to soil
work and failed to generate sustainable or durable assets in rural areas, except a few localities
where some collective efforts have been successful in creating quality infrastructural
development. But one can hardly view the scenario with much optimism.
3. Observations from the Field
To develop a nuanced understanding of the issues related to the well-being of the labour
discussed in the forgoing, this article will bring forth the observations made during a field
study and attempt to have a realistic understanding of the situation. This section is based
on a survey of randomly selected 466 households from five villages in Katihar district of
Bihar during the first half of 2012.
3.1 Socio-Economic Conditions of the Rural Masses and the Need of MGNREGA
Of the total sample of 466 households surveyed, 298 were interested in MGNREGA work.
Therefore, in this analysis only those 298 households are included. Of the 298 households,
most were either landless labourers or marginal farmers having operational holdings less
than two acres. Broadly, their income constituted four parts: agricultural income, wage
earnings, income from migration, and wage income under the MGNREGA. It is important
to look at the economic conditions of these households in order to judge the relevance and
impact of MGNREGA in this region. In other words, the need and performance of
MGNREGA can only possibly be evaluated if an attempt is made to understand the real
economic conditions of rural masses in general and rural labour in particular.
In case of agricultural income, it was clear from the survey that the profitability of agriculture
has declined significantly over the years. The decline is primarily accounted for by the
increasing cost of production (as the cost of fertiliser, seeds, weedicides etc. rose
significantly) on the one hand, and the decline and fluctuations in prices of various farm
output on the other. Depending on the quality of land, the income per acre of land has
remained in between 5,000 to 9,000 rupees. However, the profitability also depended on
the level of capital investment by the farmers because farmers were not able to use adequate
inputs in proper proportions due to lack of funds.
It was very clear from the survey that agriculture has lost its capacity to sustain a family
and to provide basic needs even in case of holdings of more than two acres. In some cases,
it was found that small land holders with more than five acres of land had gradually started
either leasing out or even selling their land in order to sustain their families. All of them
reported that the cost structure and the low sale price of their produce made agriculture
unviable. All of them generally sold their produce just after harvesting and often the rate
that they get is as low as half of the minimum support price fixed by the government for the
concerned crop. Therefore, most of the farmers have resorted to sustainable cultivation,
27. 25
Avanindra Thakur MGNREGA in Bihar
only to meet their food requirements and show little or no intention of selling their produce
in the market. In almost all the surveyed areas, it was found that farmers were reluctant to
use cash crops or high value crops in order to generate more profit from a given small unit
of land, especially because of low level of infrastructure and the absence of any guarantee
of minimum support price of these produces at the time of harvesting.
In case of wage earnings, the problem was not much different. People were not getting
sufficient working days in rural areas. This can be primarily attributed to three reasons.
Firstly, limitation to labour requirements in the process of farming, i.e., not more than
ninety days of work were available in the agricultural sector for a year, accompanying with
the tendency of the farmers to use family labour as much as possible to avoid high labour
cost. Secondly, excessive use of weedicides in all categories of farms has contributed
significantly to the decline of labour absorption in the agricultural processes in general.
Thirdly, lack of non-farm activity in the rural areas as a whole during the recent period has
also weakened the possibility of getting out of the farm employment. This is also, to a
certain extent, reflected in the lack of public work, particularly low level of infrastructure
development in villages. Lower availability of works both in the farm and non-farm activities
have been responsible for unsustainable annual wage income not only for landless labourers,
but also for marginal and small farmers who supplement their agricultural income with
wage income.
The level of agrarian distress in the villages automatically aggravates the possibilities of
out migration from the villages. This is also quite evident in the survey itself. More than
half of the households of the total sample stated that at least one member of the family has
resorted to migration”either seasonal or permanent in nature. However, migration in itself
did not solve the problem. These migrants reported that they were not able to get employed
in the organised sector and remained attached with the unorganised sector with low wage
rates. Moreover, in case of migration in rural areas, these migrants were not getting sufficient
days of employment. Therefore their income from migration was not only insufficient but
also declining over time. The majority of the migrants undertook migration only for a
period of two to six months, which happened to be the slack season in terms of employment
in these villages. Clearly, the fundamental factor behind such migration was not the attraction
of better jobs outside the village economy, but the lack of employment availability in villages.
A careful observation of the period of migration clearly reveals that more than 90 per cent
of the migration takes place seasonally between July and October. This is the period in
which the employment availability in the farm sector has been minimal. Further, during
this season, mostly paddy is cultivated and in recent period, the demand for male workers
in the paddy cultivation has declined significantly.
The main factor behind such a decline has been the extensive use of weedicides in the
cultivation process. Initially inter-culture and field preparation were the major sources of
male labour demand and most of the demand for transplantation and sowing was fulfilled
by female workers. However, in recent times, with a sharp rise in the use of weedicides,
inter-culture and field preparation became almost a labour-free activity. Thus, in the said
period, the seasonality of migration increased significantly. Further, during the last five
28. 26
Avanindra Thakur MGNREGA in Bihar
years or so, the cultivation of maize gained momentum. Being a highly labour intensive
crop, maize cultivation has created additional demand for labour in the rabi season.
Therefore, the incidence of migration during this season has been low. Less than five per
cent of the total migrants are out of the villages during this season. Clearly, additional
demand of labour generated with rise in the acreage of maize has been instrumental in the
shift to seasonal migration and raised the seasonality component of migration. Nonetheless,
the cropping pattern presently witnessed in these villages has created huge employment
gap for around four to five months mostly from June to October and in this period August,
September, and October show negligible demand for labour. In effect, for about six months
straight, from June to November, the demand for male labour is negligible.
Quite evidently, the survey reveals that these villages are suffering from severe distress
and this is not only true for marginal farmers and the landless, but also for the small and to
some extent large farmers. Further there is a near absence of employment availability for a
large part of the year, in addition to declined employment availability during the entire
year. Income of the farmers, who are mostly marginal or small land holders, has been far
from adequate and often needed some supplementary income to have a command over
decent livelihood conditions. Hence, these situations give rise to the need of the enactment
of MGNREGA, which is in these circumstances expected to generate additional employment
and income and thereby check out migration. The question arises that how far MGNREGA
has been successful in addressing these problems?
3.2 The Impact and Assessment of MGNREGA in the Survey Region
A look at the performance of MGNREGA in the surveyed villages does not inspire much
optimism. The average days of employment under MGNREGA remained below twenty
days. Since the labourers were generally illiterate, they were not able to get the desired
benefit from the scheme. In some of the villages, no type of work was undertaken.
Nevertheless, the job cards were full of signature.
Table 2 (and figures 2 and 3) show that nearly 53.36 per cent of the total persons, in spite
of being interested in work, did not possess job cards. Even holding of job cards did not
ensure employment to more than 14 per cent of persons. Only 3.36 per cent of the total of
298 workers got more than twenty days of work. Of the total job card holders, nearly 31 per
cent of workers did not get work and as high as nearly 50 per cent of them got less than ten
days of work under this scheme for the year 2011-12. The limited success of this scheme in
this region is reflected in the fact that only little more than 7 per cent of the job car holders
got more than twenty days of work and an insignificant proportion of them got 90 or more
days of work under MGNREGA during 2011-12.
29. 27
Avanindra Thakur MGNREGA in Bihar
Table 2: Distribution of persons according to the number of days of MGNREGA work
Figure 2: Distribution of workers according to number of days
worked under MGNREGA
Source: Field survey.
Number of days Persons Percentage of total
Percentage of total
working
No job card 159.0 53.36
Only job card 43.0 14.43 30.94
1 to 10 69.0 23.15 49.64
11 to 20 17.0 5.70 12.23
21 to 100 10.0 3.36 7.19
Total 298.0 100 100
Source: Field survey.
30. 28
Avanindra Thakur MGNREGA in Bihar
Figure 3: Percentage distribution of persons according to number of days of
MGNREGA employment out of total job card holders
Source: Field survey.
The wage rate in the MGNREGA work does not hold out much hope though the situation
has been comparatively better to that of the number of employment days made available
for job card holders. Nearly 28 per cent of the total workers who worked under the scheme,
got less than 100 rupees of wage per day and little more than 52 per cent of them got in
between 100 and 120 rupees. Further, slightly lower than 18 per cent got the wage rate
between 120 and 140 and nearly 2 per cent got more than 140 rupees. In other words,
nearly 72 per cent of those who worked under MGNREGA got a wage rate higher than 100
rupees per day in these villages (see Table 3, Figure 4 and Figure 5). The prevailing wage
rate in agricultural operations in these villages was less than 100 rupees per day prior to the
enactment of MGNREGA. Further, it is not very difficult to trace the movement of local
agricultural as well as non-agricultural wage rates during the last three to four years. There
is clear evidence that the wage rate in local operations for both males and females moved
with a certain lag along with the MGNREGA wage rate. In other words, the MGNREGA
wage, being much higher than the prevailing rate in the rural areas, has been instrumental
in raising the floor wage rate for the entire rural economy of this region. Since the female
wage rate was much lower than the wage rate given under MGNREGA, a sharp rise in the
wage rate for female workers has been experienced during the recent period in these areas.
Thus, there have been two major impacts on the prevailing wage rate in the economy with
the enactment of MGNREGA. Firstly, the gap between the MGNREGA wage rates for
males as well as females lowered over the last two or three years and therefore a significant
rise in these rates were observed in the survey. And secondly, during the last three and four
years the MGNREGA wage has itself risen, putting further upward pressure on all kind of
wage rates other than the MGNREGA. Indeed, in the last three years, on an average the
31. 29
Avanindra Thakur MGNREGA in Bihar
local wage rate in almost all the villages under this study rose by nearly 50 to 70 per cent in
line with the rise in the MGNREGAwage over the same years. Thus, similar to the national
experience, this region also witnessed a sharp rise in the wage rate for males and females in
both farm and non-farm sectors. This rise is attributed to the fact that the enactment of
MGNREGA has raised the floor wage rate in rural areas to a much higher level than what
had prevailed prior to the enactment of the same. Sure enough, the success of MGNREGA
on this aspect has been far reaching than on any other aspects of rural life and for rural
masses in general.
Table 3: Distribution of persons according to MGNREGA wage
Wage rate Persons Percentage of total
Percentage of total
working
No wage 202.0 67.79
Up to 100 27.0 9.06 28.13
101 to 120 50.0 16.78 52.08
121 to 140 17.0 5.70 17.71
141 and above 2.0 0.67 2.08
298.0 100 100
Source: Field survey.
Figure 4: Distribution of persons according to MGNREGA wage
Source: Field survey.
32. 30
Avanindra Thakur MGNREGA in Bihar
Figure 5: Percentage distribution of persons according to various MGNREGA wage
group out of total working under MGNREGA
Source: Field survey.
The survey also conforms to the all India experience about the limited performance of the
scheme in generating sufficient amount of additional income for the poor working class in
rural areas and in lowering the rate of migration in these villages. Given the extremely low
provision of working days, this scheme remained far below its potential in addressing
some of these issues in general. Table 4 and figure 6 show that only 3 per cent of the total
persons working under this scheme got more than 10,000 rupees and more income and
nearly 50 per cent of them got insignificant amount of additional income through this
scheme. In nutshell, more than 86 per cent of the total workers in MGNREGA got less than
2,000 rupees as total wage income.
Sure enough, this meagre additional income generated through MGNREGA has been far
from sufficient to help a substantial proportion of the rural masses at the margin to move
out from their distressed economic conditions. Further, the amount provided under the
scheme also proved to be inadequate in having any permanent impact on the migration
pattern in these villages. From the survey, it can be observed that most of these works were
provided during the rabi agricultural season in which availability of farm employment is
not very low. Instead of providing employment in relatively slack agricultural season such
as between June and November, the actual provisions were made during February and
March in which maize cultivation already accommodates a substantial proportion of rural
labour. Ironically, on being enquired, one of the panchayat representatives replied that
during the agricultural slack season most of the workers migrated from the villages and
this made it difficult to implement any work during this period. Since most of the workers
returned during the period of maize cultivation, it was easier to get workers for MGNREGA
works. In fact, the number of days of employment provided in this scheme has been too
low to prevent people from migrating.Aprovision of 100 days of work might have lowered
33. 31
Avanindra Thakur MGNREGA in Bihar
the incidence of migration to an appreciable extent but that also seems too ideal to be true.
Besides, it is not migration which is the reason behind the unavailability of workers. Rather,
it is the unavailability of adequate number of working days under MGNREGA which is
responsible for not having significant impact on the rate of out-migration from these villages.
The migrants did not find sufficient incentive for staying back in the villages during the
agricultural slack season because they knew that the availability of employment under this
scheme is not at par with what they get from migrant work.
Table 4: Distribution of persons according to various MNREGA income group
Wage income Persons Percentage of total
Percentage of total
working
No income 202.0 67.79
Up to 1,000 48.0 16.11 50.00
1,001 to 2,000 35.0 11.74 36.46
2,001 to 10,000 10.0 3.36 10.42
10,000 and higher 3.0 1.01 3.13
Total 298.0 100 100
Source: Field survey.
Figure 6: Distribution of persons according to various MNREGA income groups
Source: Field survey.
34. 32
Avanindra Thakur MGNREGA in Bihar
Within the village, benefits of the scheme were unevenly distributed across different social
and political segments. The panchayat being the nodal agency of its implementation, the
role of its head in allocating the benefits of MNREGA has been extremely important. In
this context, personal relationships have been instrumental. The community or group of
individuals having a close relationship with the panchayat head undoubtedly reap higher
benefits from this scheme. For instance, the villages under the survey were dominated by
the Other Backward Caste (OBC) group and their influence in getting employment under
this scheme was clearly visible during the survey. The accessibility of Scheduled Castes
and Scheduled Tribes to this programme has been dismal. The average number of days for
these two groups has been significantly lower than that for the OBCs. Even within the
OBC group, people closely associated with the panchayat head remained the top beneficiaries
of the scheme. The upper caste, in this region, numerically a minority and relatively stronger
in economic terms, has not been significantly participative. However, the established social
hierarchy did not prevent them from fetching sufficiently higher days of employment than
any other caste group.
4. Some Concluding Remarks
Despite a great deal of variation in the actual need and performance across different regions
and states, a few general conclusions can be drawn with regard to the broad dimensions of
MGNREGA. First among these has been the fact that this scheme was initiated at a time
when the entire rural India was witnessing severe distress in employment conditions such
as decline in the absorption capacity of the farm sector, near absence of non-farm
employment, almost stagnant rural real wage for more than a decade, a high degree of
underemployment as well as disguised unemployment along with increasing rate of rural
unemployment etc. The need for such a right based employment scheme was inevitable
from the perspective of providing decent livelihood conditions for the rural masses in
general and rural labour in particular. However, in terms of implementation, there have
been serious deficiencies across all regions to varying degrees. The poor implementation
has limited the achievement of the actual goals as well as objectives as was conceived
during its inception. Therefore, the impact on the whole remained much below its potential.
The most important issue which needs urgent attention with respect to MGNREGA is the
provision of sufficient number of employment days during any year. The corruption involved
in the implementation of this scheme should be checked with utmost exigency. To counter
the problem, the Government has attempted to take effective steps like direct transfer of
funds to the Panchayat and more precisely to the account of job-card holders, provision of
social auditing etc. Greater decentralisation of policies and funds along with awareness
campaigns in rural areas and stronger and effective social audit would definitely prove
beneficial in countering the problem of corruption. At least 100 days and nothing less than
that would make this scheme worthy. Direct transfer of money in the account of workers
would be an appreciative step in this regard. Focussing on the better functioning and
targeting of MGNREGA is very important not only with regard to providing employment
in rural India and reducing poverty but also to make rural economy self-sufficient and
developed.
35. 33
Avanindra Thakur MGNREGA in Bihar
Any scheme enjoys the taste of success only when conceived with proper planning and
implemented with a view to achieve perceivable quality work. In fact, careful execution of
the former ensures the latter. Since there was a lack of long term planning within the villages
regarding implementation, the quality of assets created under the scheme was not satisfactory.
In most of the villages, kachchi (unpaved) road and ponds were constructed without analysing
their requirement and sustainability in the long term. Ponds were dry for more than three
months. So, when there was demand for water, these ponds were not able to meet the
demand. Moreover, there is a limit to having such ponds in the villages. In such cases, long
term sustainability of the scheme in creating assets, has been limited under the present
structure and nature of work in the scheme itself. Besides, the assets created under the
scheme have not always been sufficient to raise the productive capacity of villages. In
other words, they have been static in nature and have generated employment and income
only during the period of implementation. They have had a very limited role in generating
future stream of income and prospects for the villages or the entire rural area as a whole. In
sum, the type of work undertaken in the scheme is questionable on the grounds of
sustainability, enhancement of productive capacity, fulfilment of local demand, and long
term viability.
Achievement of these goals is a great challenge. In this regard, some measures can be
suggested. Firstly, proper long term as well as short term planning to address the need and
potentials of the concerned village is very important. Infrastructural need of the villages
should be identified on the priority basis and ordering of the need of that infrastructure
should be mentioned under village level planning.
There is no need to stick to works like digging ponds, making kachchi roads etc. Instead a
large number of works should be undertaken, based on an ordering of priorities including
‘pakki’(construction works using brick, cement etc.) works.Acomprehensive and integrated
approach towards irrigation needs to be taken under the scheme. If major irrigation work is
not feasible, then a large number of minor projects targeting small and marginal farmers
should be included under the scheme. Judicious linkage of Pradhan Mantri Gram Sadak
Yojana (a national scheme providing good all-weather road connectivity to unconnected
villages) to MGNREGA can also be a useful endeavour provided it maintains the minimum
requirement of labours and employment of local labourers. If a pond is made out of the
funds under the scheme, it should be ensured that along with adequate irrigation for a
whole year, fisheries are also promoted as an additional occupation. Some other
infrastructural projects based on local level demands such as levelling of lands, development
of community land as productive assets, building of cold storage or simple grain houses
etc. should also be undertaken based on comprehensive planning.
Thirdly, in order to raise the productive capacity of the villages, an altogether different
approach is needed. The work under the scheme should not be restricted to develop
infrastructure. Rather, it can be used to generate direct employment such as promotion of
food processing industries at the individual level. With the help of funds allocated under
MGNREGA, a grain bank at the village or block level can be created. Instead of allocating
cash wages, these workers should be provided with certain amounts of food grain so that
36. 34
Avanindra Thakur MGNREGA in Bihar
they can sell these grains after processing and earn a higher income than the direct wage. It
will not only generate employment at a point of time, but also enable them to generate a
future stream of income. Secondly, the creation of a grain bank would create sufficient
demand for food grain at the village level itself and raise the income of concerned farmers
without compromising the sale price of the products. Thirdly, it would solve the problem
of food insecurity at the village level itself. Food processing should not be limited to food
grains. It could also include other items such as pickles, fruit juices, chips etc. depending
on the local level of production.
However, to implement all these projects, adequate development of infrastructure is needed
and that should again be mentioned under the local level planning and be focused on a
priority basis. Similarly, fishery development can be addressed through the MGNREGA
funds and again instead of giving simple cash wage, fish worth the same amount can be
given to the workers to sell in the nearest market.Along with this, horticulture development
can also be undertaken, subject to the local conditions. Notably, this region being water
abundant possesses great potential for fishery and horticultural development. Furthermore,
a co-ordinated approach among villages, blocks and districts in order to identify and address
more demands at a broader level shall have to be undertaken. More precisely, small power
projects, canals for irrigation purposes, embankments in order to control flood, or other
projects depending on regional requirements can be considered under the project.
Lastly, it might be appropriate to suggest that the labour hours of the workers be considered
as their asset. Using their labour power as collateral, banks and other institutional credit
providers could provide them with adequate credit for self-employment activities and
development of skills. Moreover, imparting skills to the workers requires a comprehensive
skill development programme by the government to render the unskilled labourers capable
of generating higher and more sustainable incomes in the long term. The initiation of
MGNREGA is a welcome step in improving the lot of the deprived majority of the Indian
population. A careful reappraisal of its functions, a focussed approach towards its
implementation and a careful evaluation of its impact at regular intervals holds the prospect
of contributing to the overall development of the Indian economy as a whole by making
rural India self-sufficient and the centre-stage of the development process.
References
Chavan, Pallavi, 2004. ‘Banking sector liberalization and the growth and regional distribution of
rural banking.’In: V.K. Ramachandran & Madhura Swaminathan, eds., 2004. Financial liberalisation
and rural credit in India. New Delhi: Tulika.
Chandrasekhar, C.P. & Ghosh, Jayati, 2002. The market that failed: A decade of neoliberal economic
reforms in India. New Delhi: Leftword Books.
Government of India, various years. Employment-unemployment reports. New Delhi: NSSO.
Jha, Praveen, 2007. Some aspects of the well-being of India’s agricultural labour in the context of
contemporary agrarian crisis.
Available at: http://www.macroscan.org/anl/feb07/Agrarian_Crisis.pdf
[Accessed 15 January 2013].
37. 35
Avanindra Thakur MGNREGA in Bihar
Patnaik, Prabhat, 2007. A model of growth of the contemporary Indian economy. Economic and
Political Weekly, Vol.42, No.22. pp.2077-2081.
Patnaik, Utsa, 2007. Neoliberalism and rural poverty in India. Economic and Political Weekly, Vol.
42, No.30. pp.3132-3150.
Chandrasekhar, C.P., Ray, Sujit Kumar, 2004. Financial sector reforms and the trasnsformation of
banking. In: V.K. Ramachandran & Madhura Swaminathan, eds., 2004. Financial liberalisation
and rural credit in India. New Delhi: Tulika.
Sen, Abhijit, 1996. Economic reforms, employment and poverty: trends and options. Economic and
Political Weekly, Vol. 31, Nos.35-36-37. pp.2459-2477.