SlideShare a Scribd company logo
1 of 13
Download to read offline
International Journal of Mathematics and Statistics Invention (IJMSI)
E-ISSN: 2321 – 4767 P-ISSN: 2321 - 4759
www.ijmsi.org Volume 3 Issue 2 || February. 2015 || PP-39-51
www.ijmsi.org 39 | P a g e
Generalized Family of Efficient Estimators of Population Median
Using Two-Phase Sampling Design
1,
H.S. Jhajj , 2,
Harpreet Kaur , 3,
Puneet Jhajj
ABSTRACT : For estimating the population median of variable under study, a generalized family of efficient
estimators has been proposed by using prior information of population parameters based upon auxiliary
variables under two-phase simple random sampling design. The comparison of proposed family of estimators
has been made with the existing ones with respect to their mean square errors and biases. It has been shown
that efficient estimators can be obtained from the family under the given practical situations which will have
smaller mean square error than the linear regression type estimator, Singh et al estimator (2006), Gupta et al
(2008) estimator and Jhajj et al estimator (2014). Effort has been made to illustrate the results numerically as
well as graphically by taking some empirical populations considered in the literature which also show that bias
of efficient estimators obtained from the proposed family of estimators is smaller than other considered
estimators.
KEYWORDS: Auxiliary variable; Bias; Mean square error; Median; Two-phase sampling.
I. INTRODUCTION
In survey sampling, statisticians have given more attention to the estimation of population mean, total,
variance etc. but median is regarded as a more appropriate measure of location than mean when the distribution
of variables such as income, expenditure etc. is highly skewed. In such situations, it is necessary to estimate
median. Some authors such as Gross(1980), Kuk and Mak (1989), Singh et al (2001,2006), Jhajj et al (2013) etc.
have considered the problem of estimating the median.
Sometimes in a trivariate distribution consisting of study variable Y and auxiliary variables (X, Z),
the correlation between the variables Y and Z is only because of their high correlation with the variable X but
are not directly correlated to each other . For example:
1. In agriculture labour (say Z) and crop production (say Y) are highly correlated with the area under
crop (say X) but not directly correlated to each other.
2. In any repetitive survey, the values of a variables of interest corresponding to both the last to last
year (say Z) and current year (say Y) are highly correlated with the values of some variable
corresponding to the last year (say X), whereas the values corresponding to the last to last year (Z)
and the values corresponding to the current year (Y) are correlated with each other due to only
their correlation with values of the some variable (X) corresponding to the last year.
Suppose the prior information about population median ZM of variable Z is available where as the
population median XM of variable X is not known. Such unknown information is generally predicted by using
the two- phase sampling design.
Let u consider a finite population U= (1, 2,… i ,...N). Let iY and iX , iZ be the values of study
variable Y and auxiliary variables X, Z respectively on the
th
i unit of the population. Corresponding small
letters indicate the value in the samples. Let MY and MX, MZ be the population medians of study variable and
auxiliary variables respectively. Under two- phase sampling design, first phase sample of size n is selected
using simple random sampling without replacement and observations on Y, X and Z are obtained on the sample
units. Then second phase sample of size m under simple random sampling without replacement is drawn from
the first phase sample and observations on the variables Y, X and Z are taken on selected units. Corresponding
sample medians are denoted by , and for second phase sample while ˆ
YM , ˆ
XM and ˆ
ZM are
sample medians for the first phase sample.
Suppose that y(1), y(2),…,y(m) are the values of variable Y on sample units in ascending order such that
y(t)  MY  y(t +1) for some integral value of t. Let p = t/m be the proportion of Y values in the sample that are
less than or equal to the value of median MY (an unknown population parameter). If pˆ is an estimator of p ,
Generalized Family Of Efficient…
www.ijmsi.org 40 | P a g e
the sample median can be written in terms of quantiles as  pQY
ˆˆ with pˆ = 0.5.
Let the correlation coefficients between the estimators in  ˆ ˆ,X YM M ,  ˆ ˆ,Y ZM M and  ˆ ˆ,X ZM M are
denoted by xy , yz and xz respectively which are defined as
    11ˆ ˆ,
4 , 1
X Y
xy M M
P x y    , where    11 , X YP x y P X M Y M   
    11ˆ ˆ,
4 , 1
Y Z
yz M M
P y z    , where    11 , Y ZP y z P X M Y M   
    11ˆ ˆ,
4 , 1
X Z
xz M M
P x z    , where    11 , X ZP x z P X M Y M   
Assuming that as N→∞, the distribution of the trivariate variable (X, Y, Z) approaches a continuous
distribution with marginal densities , and of variables X, Y and Z respectively. This
assumption holds in particular under a superpopulation model framework, treating the values of (X, Y, Z) in the
population as a realization of N independent observations from a continuous distribution. Under these
assumptions, Gross (1980) has shown that conventional sample median is consistent and asymptotically
normal with median MY and variance
   
2
1 1
ˆ
4 ( )
Y
Y
m N
Var M
f M
 
 
  (1.1)
For the case of trivariate distribution of X, Y and Z and using two phase sampling design, linear regression type
estimator of population median MY is defined as
   ˆ ˆ ˆ ˆ ˆ
Ylr Y X X Z ZM M M M M M       (1.2)
where  and  are constants.
Up to the first order of approximation,  ˆ
YlrMSE M is minimized for
 
 
X
xy
Y
f M
f M
  and
 
 
Z
yz
Y
f M
f M
 
and its minimum is given by
   
2 2
2
1 1 1 1 1 1 1ˆ
4 ( )
Ylr xy yz
Y
MSE M
m N m n n Nf M
 
      
           
      
(1.3)
Singh et al (2006) defined a ratio type estimator of median under the two phase sampling design as
1 2 3
ˆ
ˆ ˆ
ˆ ˆ ˆ
X Z Z
S Y
X Z Z
M M M
M M
M M M
  
     
      
    
(1.4)
where ; 1,2,3i i  are constants.
Up to first order of approximation, they minimized MSE ( ˆ
SM ) for:
 
 1 2
1
xz yz xyX X
Y Y xz
M f M
M f M
  


 
  
 
,
 
 2 2
1
xz yz xyZ Z xz
Y Y xz
M f M
M f M
  


 
  
 
Generalized Family Of Efficient…
www.ijmsi.org 41 | P a g e
and
 
 3 2
1
xz xy yzZ Z
Y Y xz
M f M
M f M
  


 
  
 
   
2 2
.2min
1 1 1 1 1 1 1ˆ
4 ( )
S yz y xz
Y
MSE M R
m N n N m nf M

      
           
      
(1.5)
where
2 2
2
. 2
2
1
xy yz xy yz xz
y xz
xz
R
    

 


Using the knowledge of range ZR of variable Z along with its population median ZM , Gupta et al (2008)
defined the estimator of population median MY under the same sampling design considered by Singh et al
(2006) as
1 2 3
ˆ
ˆ ˆ
ˆ ˆ ˆ
X Z Z Z Z
P Y
X Z Z Z Z
M M R M R
M M
M M R M R
  
       
      
      
(1.6)
where  1,2,3i i  are constants.
Up to the first order of approximation, they minimized MSE of ˆ
PM for
 
 1 2
1
xz yz xyX X
Y Y xz
M f M
M f M
  


 
  
 
,
 
 2 2
1
1
xz yz xyZ Z xz
Y Y xzZ
Z Z
M f M
M f MM
M R
  


 
  
   
  
and,
 
 3 2
1
1
xz xy yzZ Z
Y Y xzZ
Z Z
M f M
M f MM
M R
  


 
  
   
  
The bias and MSE of optimum estimator of ˆ
PM obtained by them are:
Generalized Family Of Efficient…
www.ijmsi.org 42 | P a g e
 
    
 
 
  
    
 
 
  
2 2 2
2 2
2
2
2
ˆ( )
8 ( ) (1 )
1 1
2 1
1
1 1
2
1
1 1
Y
P
Y Y xz
xy yz xz xy xy yz xz xz
Y Y
xy yz xz xz
X X
yz xy xz xz xy yz xz yz xy xz
Y Y Z
yz xy xz xz
Z Z Z Z
M
Bias M
M f M
m n
M f M
M f M
m N
M f M M
M f M M R
n N

       
   
         
   


 
      
 
  
 
      
 
 
   
 

 

    
 
 
  
22 2
2
2 1
1
xz xy yz xz yz xz xy yz xz xz
Y Y Z
xz xy yz xz xz
Z Z Z Z
M f M M
M f M M R
         
    

    

 
    
  
(1.7)
and
   
2 2
.2min
1 1 1 1 1 1 1ˆ
4 ( )
P yz y xz
Y
MSE M R
m N n N m nf M

      
           
      
(1.8)
=  min
ˆ
SMSE M
Recently Jhajj et al (2014) defined an efficient family of estimators of median using the same information used
by Singh et al (2006) under same sampling design as
 3
1 2
ˆ ˆ
ˆ ˆ
ˆ ˆ
ˆ ˆ
X X
X X
M M
M M
Z Z
YH Y
Z Z
M M
M M e
M M
 
  
 
  
 
   
    
    (1.9)
here 1 , 2 and 3 are constants.
Up to the first order of approximation, they minimized MSE of ˆ
YHM for
 
 1 2
1
xz yz xyZ Z xz
Y Y xz
M f M
M f M
  


 
  
 
,
 
 2 2
1
xy xz yzZ Z
Y Y xz
M f M
M f M
  


 
  
 
and
 
 3 2
2
1
yz xz xyX X
Y Y xz
M f M
M f M
  


 
  
 
Generalized Family Of Efficient…
www.ijmsi.org 43 | P a g e
The bias and MSE of optimum estimator of ˆ
YHM obtained by them are:
 
    
 
 
  
    
    
 
 
2 2 2
2 2
2
2
2
ˆ( )
8 ( ) (1 )
1 1
2 1
1
1 1
2
2 1 1
Y
YH
Y Y xz
xy yz xz xy xy yz xz xz
Y Y
xy yz xz xz
X X
yz xy xz xz xy yz xz yz xy xz
Y Y
yz yz xy xz xz yz xy xz xz
Z Z
M
Bias M
M f M
m n
M f M
M f M
m N
M f M
M f M

       
   
         
        


 
      
 
  
 
      
 
      
    
 
 
  
2
22 2
2
1 1
2 1
1
xz xy yz xz yz xz xy yz xz xz
Y Y
xz xy yz xz xz
Z Z
n N
M f M
M f M
         
    
 
      
 

   

(1.10)
and
   
2 2
.2min
1 1 1 1 1 1 1ˆ
4 ( )
YH yz y xz
Y
MSE M R
m N n N m nf M

      
           
      
(1.11)
=  min
ˆ
SMSE M
II. PROPOSED ESTIMATOR AND ITS RESULTS
Assuming that MZ is known for a trivariate distribution of variables X,Y and Z, in which variables Y
and Z are highly correlated with variable X and correlated among themselves through X only. Then we
proposed a family of estimators of population median YM under two phase sampling design described in
Section 1 as
 
1 2
3
ˆ ˆ ˆ
ˆ ˆ ˆ ˆ exp 2
ˆ ˆ ˆ ˆ
X Z Z Z
YHL Y Y Y
X Z Z Z
M M M M
M M M M
M M M M
 
  
                          
(2.1)
where 1 , 2 , 3 are constants and 0  .
To find the bias and MSE of the estimator ˆ
YHLM  , we define
0
ˆ
1Y
Y
M
M
   , 1
ˆ
1Y
Y
M
M


  , 2
ˆ
1X
X
M
M
   ,
3
ˆ
1X
X
M
M


  , 4
ˆ
1Z
Z
M
M
   , 5
ˆ
1Z
Z
M
M


 
such that ( ) 0iE   for i = 0, 1, 2, 3, 4, 5
Generalized Family Of Efficient…
www.ijmsi.org 44 | P a g e
Assuming i < 1 i , we expand ˆ
YHLM  in terms of s and retain the terms up to second degree of s in
the derivation of bias and mean square error for obtaining the expressions up to first order of approximation
 
  
  
  
 
  
 
  
  
  
 
  
  
  
  
1
22 2
2
2 21 1 3 3
1 1 1
1 3 1 3
11 1ˆ( )
4 2
1 11 1
2 2
1
Z ZY
YHL Z Z yz
Y Y
X X Z Z
X X X X Z Z
xz xy yz
Z Z Y Y Y Y
M f MM
Bias M M f M
n N M f M
M f M M f M
m n
M f M M f M M f M
M f M M f M M f M

 
 
   
      


 
  
    
     
    
   
   
 
 
     
    
(2.2)
      
  
  
          
  
  
  
  
  
  
1
2
2 22
3 3
2 2 22 2 2
1 2
1 1 1
1 2 1 2
1 1 1 1ˆ( ) 2
4
1 1
2
2(1 ) 2
Z ZY
YHL Y Y Z Z yz
Y Y
Y Y X X Z Z
X X Z Z X X
xy yz xz
Y Y Y Y Z Z
M f MM
MSE M M f M M f M
m N n N M f M
M f M M f M M f M
m n
M f M M f M M f M
M f M M f M M f M
   
   
      

 
  
  
    
        
    
 
     
 
 
    
 
 


(2.3)
For any fixed value of  ,  ˆ
YHLBias M  and  ˆ
YHLMSE M  are minimized for
 
 
 1 2
1 ,
1
yz xz xy X X
xz Y Y
M f M
M f M
  
 

 
   
 
 
 2
Z Z
yz
Y Y
M f M
M f M
 
and
 
 
 3 2
1
1
xy xz yz Z Z
xz Y Y
M f M
M f M
  
 

 
   
 
and their corresponding minimum values are given by
    
      
     
 
      
 
22 2
22 2
2 2
2 2 2 2
1 1 1ˆ( ) 1 2 1
8 1
1 2 1 2 1 1
1 1
YHL yz xz xy xy yz xz xy xz
Y Y xz
Y Y Y Y
yz xz xz yz yz xz xy xz yz xz yz
X X Z Z
Bias M
m nM f M
M f M M f M
M f M M f M
n N
         

           
               
     
                
       
 
 
 
      
 
  
2 2
1 1 2 1Y Y
xy xz yz yz xy xz yz xz
Z Z
M f M
M f M
         
   
               
(2.4)
  
   22 2 2
.2
1 1 1 1 1 1 1ˆ( ) 1 2
4
YHL yz y xz
Y
MSE M R
m N n N m nf M
    
                         
(2.5)
Generalized Family Of Efficient…
www.ijmsi.org 45 | P a g e
III. COMPARISON
We compare the proposed family of estimators with respect to its mean square error with Singh et al
(2006) estimator as well as linear regression type estimator ˆ
YlrM because it is generally considered best in
literature under the same conditions.
Using the expressions (1.3) and (2.5), we have
   
  
    2 2 2
.2
1 1 1ˆ ˆ 1 1 1
4
Ylr YHL y xz xy
Y
MSE M MSE M R
m nf M
  
 
       
 
0 1 1for K K     (3.1)
where
2
2
.
1
1
xy
y xz
K
R



Using the expressions (1.5) and (2.5), we have
0 0 2for    (3.2)
From (3.1) and (3.2), we note that the proposed family of estimators is always better than the linear regression
type estimator as well as Singh et al (2006) estimator for 0 2  .
Note: From the expressions of the biases obtained, we noted that no concrete conclusion can be obtained
theoretically by comparing proposed estimator with the others with respect to their biases. So, the biases are
compared numerically in Section 4.
IV. NUMERICAL ILLUSTRATION
For illustration of results numerically and graphically, we take the following data
Data 1 (Source: Singh, 2003). Y: the number of fish caught by marine recreational fishermen in 1995; X: The
number of fish caught by marine recreational fishermen in 1994; Z: The number of fish caught by marine
recreational fishermen in 1993.
N = 69, xy = 0.1505, YM =2068,  Yf M = 0.00014
n = 24, yz = 0.3166, XM =2011,  Xf M = 0.00014
m =17, xz = 0.1431, ZM =2307,  Zf M = 0.00013
Data 2 (Source: Aezel and Sounderpandian, 2004). Y: The U.S. exports to Singapore in billions of Singapore
dollars; X: The money supply figures in billions of Singapore dollars; Z: The local supply in U.S. dollors.
N = 67, xy = 0.6624, YM =4.8,  Yf M = 0.0763
n = 23, yz = 0.8624, XM =7.0,  Xf M = 0.0526
m =15, xz = 0.7592, ZM =151,  Zf M = 0.0024
Data 3. (Source: MFA, 2004). Y: District-wise tomato production (tones) in 2003; X: District-wise tomato
production (tones) in 2002; Z: District-wise tomato production (tones) in 2001.
N = 97, xy = 0.2096, YM =1242,  Yf M = 0.00021
n = 46, yz = 0.1233, XM =1233,  Xf M = 0.00022
m =33, xz = 0.1496, ZM =1207,  Zf M = 0.00023
   
  
  2 2
.2min
1 1 1ˆ ˆ 2 1
4
S YHL y xz
Y
MSE M MSE M R
m nf M
  
 
     
 
Generalized Family Of Efficient…
www.ijmsi.org 46 | P a g e
For Data 1
Table 4.1 : Bias and relative efficiency of estimators
 Bias Relative Efficiency of
eeeeeestimatorEstimators
ˆ
SM ˆ
PM ˆ
YHM ˆ
YHLM 
ˆ
GRM ˆ
YlrM ˆ
SM ˆ
YHLM 
-0.13
58.62 20.22 32.57 2.65E-07
100 107.5 105.83 96.134
-0.08
58.62 20.22 32.57 2.27E-07
100 107.5 105.83 99.781
-0.03
58.62 20.22 32.57 1.91E-07
100 107.5 105.83 103.53
0
58.62 20.22 32.57 1.69E-07
100 107.5 105.83 105.83
0.3
58.62 20.22 32.57 1.8E-08
100 107.5 105.83 129.96
0.6
58.62 20.22 32.57 1.8E-08
100 107.5 105.83 152.46
0.9
58.62 20.22 32.57 2.6E-07
100 107.5 105.83 165.48
1.2
58.62 20.22 32.57 3.1E-07
100 107.5 105.83 162.71
1.5
58.62 20.22 32.57 3.1E-07
100 107.5 1053 145.59
1.8
58.62 20.22 32.57 2.7E-07
100 107.5 105.83 121.79
2.1
58.62 20.22 32.57 1.8E-07
100 107.5 105.83 98.309
2.4
58.62 20.22 32.57 5.1E-08
100 107.5 105.83 78.415
Figure 4.1
-0.5 0.0 0.5 1.0 1.5 2.0 2.5
90
100
110
120
130
140
150
160
170
ˆ
YHLM 
ˆ
SMˆ
YlrM
ˆ
GRMGross(1980)Estimator
Regression type Estimator Singh et al estimator
Proposed Estimator
Efficiency

Generalized Family Of Efficient…
www.ijmsi.org 47 | P a g e
Figure 4.2
-0.5 0.0 0.5 1.0 1.5 2.0 2.5
0
10
20
30
40
50
60
70
ˆ
YHM
ˆ
YHLM 
ˆ
SM
ˆ
PM
Proposed Estimator
Singh et al Estimator
Jhajj et al Estimator
Gupta et al Estimator
Bias

For Data 2
Table 4.2 : Bias and relative efficiency of estimators
 Bias Relative Efficiency of Estimators
ˆ
SM ˆ
PM ˆ
YHM ˆ
YHLM 
ˆ
GRM ˆ
YlrM ˆ
SM ˆ
YHLM 
-1.7
0.37 0.28 0.026 0.023417
100 254.55 286.9 93.413
-1.2
0.37 0.28 0.026 0.017163
100 254.55 286.9 126.69
-0.7
0.37 0.28 0.026 0.011761
100 254.55 286.9 176.84
-0.2
0.37 0.28 0.026 0.00721
100 254.55 286.9 250.6
0
0.37 0.28 0.026 0.005628
100 254.55 286.9 286.91
0.4
0.37 0.28 0.026 0.002873
100 254.55 286.9 363.53
0.8
0.37 0.28 0.026 0.000662
100 254.55 286.9 419.55
1.2
0.37 0.28 0.026 0.001
100 254.55 286.9 419.55
1.6
0.37 0.28 0.026 0.00212
100 254.55 286.9 363.53
2
0.37 0.28 0.026 0.0027
100 254.55 286.9 286.91
2.4
0.37 0.28 0.026 0.00273
100 254.55 286.9 217.99
2.8
0.37 0.28 0.026 0.00222
100 254.55 286.9 165.11
3.2
0.37 0.28 0.026 0.00116
100 254.55 286.9 126.69
3.6
0.37 0.28 0.026 0.000446
100 254.55 286.9 99.041
4
0.37 0.28 0.026 0.002594
100 254.55 286.9 78.939
Generalized Family Of Efficient…
www.ijmsi.org 48 | P a g e
Figure 4.3
-2 -1 0 1 2 3 4
50
100
150
200
250
300
350
400
450
ˆ
YHLM 
ˆ
SM
ˆ
YlrM
ˆ
GRM
Regression type Estimator
Gross(1980) Estimator
Singh et al Estimator
Proposed Estimator
Efficiency

Figure 4.4
-2 -1 0 1 2 3 4
0.00
0.05
0.10
0.15
0.20
0.25
0.30
0.35
ˆ
YHM
ˆ
SM
ˆ
PM
ˆ
YHLM 
Singh et al estimator
Gupta et al estimator
Jhajj et al estimator
Proposed Estimator
BIAS

Generalized Family Of Efficient…
www.ijmsi.org 49 | P a g e
For Data 3
Table 4.3 : Bias and relative efficiency of estimators
 Bias Relative Efficiency of Estimators
ˆ
SM ˆ
PM ˆ
YHM ˆ
YHLM 
ˆ
GRM ˆ
YlrM ˆ
SM ˆ
YHLM 
-0.1
8.06 3.63 4.75 2.23E-07
100 102.8 103.7 95.277
0
8.06 3.63 4.75 1.77E-07
100 102.8 103.7 103.69
0.2
8.06 3.63 4.75 9.48E-08
100 102.8 103.7 122.2
0.4
8.06 3.63 4.75 2.44E-08
100 102.8 103.7 141.89
0.6
8.06 3.63 4.75 3.4E-08
100 102.8 103.7 160.36
0.8
8.06 3.63 4.75 8E-08
100 102.8 103.7 173.93
1
8.06 3.63 4.75 1.1E-07
100 102.8 103.7 178.99
1.2
8.06 3.63 4.75 1.4E-07
100 102.8 103.7 173.93
1.4
8.06 3.63 4.75 1.5E-07
100 102.8 103.7 160.36
1.6
8.06 3.63 4.75 1.5E-07
100 102.8 103.7 141.89
1.8
8.06 3.63 4.75 1.3E-07
100 102.8 103.7 122.2
2
8.06 3.63 4.75 1.1E-07
100 102.8 103.7 103.69
2.2
8.06 3.63 4.75 -6.8E-08
100 102.8 103.7 87.498
Generalized Family Of Efficient…
www.ijmsi.org 50 | P a g e
Figure 4.5
Figure 4.6
-0.5 0.0 0.5 1.0 1.5 2.0 2.5
0
1
2
3
4
5
6
7
8
ˆ
YHM
ˆ
YHLM 
ˆ
SM
ˆ
PM
Proposed Estimator
Gupta et al Estimator
Jhajj et al Estimator
Singh et al Estimator
Bias

From tables (4.1), (4.2) and (4.3), we note that proposed family of estimators have smaller mean square error
than Gross(1980) estimator, linear regression type estimator ˆ
YlrM , Singh et al (2006) estimator, Gupta et al
(2008) estimator and Jhajj et al estimator (2014) as well as have smaller bias than Singh et al (2006) estimator,
Gupta et al (2008) estimator and Jhajj et al estimator (2014) in all the three populations considered
corresponding to  0,2 . The graphical representation also supports the numerical results.
Generalized Family Of Efficient…
www.ijmsi.org 51 | P a g e
V. CONCLUSION
The range of variation of  involved in the proposed family of estimators of population median under
two-phase sampling design has been obtained theoretically under which its estimators are efficient than the
existing ones. It has been found theoretically that proposed family of estimators is efficient than the linear
regression type estimator ˆ
YlrM , Singh et al (2006) estimator Gupta et al (2008) estimator and Jhajj et al
estimator (2014) for  0,2 . Numerical results for all the three populations also show that optimum
estimator of proposed family having smaller bias is efficient than them. Graphical representation also gives the
same type of interpretation. Hence, we conclude that better estimators can be developed from the proposed
family by choosing suitable values of  0,2 . So, it is strongly recommended that proposed family of
estimators should be used for getting the accurate value of population median.
REFERENCES
[1]. Azel A.D., Sounderpandian J. (2004).Complete Business Statistics. 5th
ed. New York: McGraw Hill,
[2]. Gross S.T. (1980). Median estimation in sample Proc. Surv. Res. Meth. Sect. Amer. Statist Ass.,181-184.
[3]. Gupta S., Shabbir J. and Ahmad S.(2008). Estimation of median in two- phase sampling using two
auxiliary variables. Communication in Statistics-Theory and Methods, 37(11), 1815- 1822.
[4]. Jhajj H.S.and Harpreet Kaur (2013),Generalized estimators of population median using auxiliary
information, IJSER, 11(4), 378-389.
[5]. Jhajj H.S., Harpreet Kaur and Walia Gurjeet(2013), Efficient family of ratio-product type estimators
of median, MASA, Vol 9, 2014, 277-282.
[6]. Jhajj H.S., Harpreet Kaur and Jhajj Puneet (2014), Efficient family of estimators of median using two
phase sampling design, Communication in Statistics-Theory and Methods, Accepted.
[7]. Kuk Y.C.A. and Mak T.K. (1989). Median estimation in the presence of auxiliary information. J.R
Statist.Soc. B, (2), 261-269.
[8]. MFA (2004). Crops Area Production. Ministery of food and Agriculture. Islamabad: Pakistan.
Singh S. (2003).Advanced Sampling Theory with Applications. Vol. 1 & 2. London Kluwer Academic
Publishers.
[9]. Singh S. , Joarder A. H. and Tracy D. S.(2001), Median estimation using double sampling. Austral. N.J.
Statist. 43(1) , 33-46.
[10]. Singh S., Singh H.P and Upadhyaya L.N. (2006). Chain ratio and regression type estimators for median
estimation in survey sampling. Statist. Pap. 48, 23-46.

More Related Content

What's hot

Lecture 01 probability distributions
Lecture 01 probability distributionsLecture 01 probability distributions
Lecture 01 probability distributionsmohamed ali
 
Chapter 2 understanding the normal curve distribution
Chapter 2   understanding the normal curve distributionChapter 2   understanding the normal curve distribution
Chapter 2 understanding the normal curve distributionAntonio F. Balatar Jr.
 
Correlation measure for intuitionistic fuzzy multi sets
Correlation measure for intuitionistic fuzzy multi setsCorrelation measure for intuitionistic fuzzy multi sets
Correlation measure for intuitionistic fuzzy multi setseSAT Journals
 
Correlation measure for intuitionistic fuzzy multi sets
Correlation measure for intuitionistic fuzzy multi setsCorrelation measure for intuitionistic fuzzy multi sets
Correlation measure for intuitionistic fuzzy multi setseSAT Publishing House
 
Download-manuals-surface water-manual-sw-volume2referencemanualsamplingprinc...
 Download-manuals-surface water-manual-sw-volume2referencemanualsamplingprinc... Download-manuals-surface water-manual-sw-volume2referencemanualsamplingprinc...
Download-manuals-surface water-manual-sw-volume2referencemanualsamplingprinc...hydrologyproject001
 
Download-manuals-ground water-manual-gw-volume2referencemanualsamplingprinci...
 Download-manuals-ground water-manual-gw-volume2referencemanualsamplingprinci... Download-manuals-ground water-manual-gw-volume2referencemanualsamplingprinci...
Download-manuals-ground water-manual-gw-volume2referencemanualsamplingprinci...hydrologyproject001
 
Measures of central tendency
Measures of central tendencyMeasures of central tendency
Measures of central tendencyNadeem Uddin
 
M estimation, s estimation, and mm estimation in robust regression
M estimation, s estimation, and mm estimation in robust regressionM estimation, s estimation, and mm estimation in robust regression
M estimation, s estimation, and mm estimation in robust regressionjcmani
 
A System of Estimators of the Population Mean under Two-Phase Sampling in Pre...
A System of Estimators of the Population Mean under Two-Phase Sampling in Pre...A System of Estimators of the Population Mean under Two-Phase Sampling in Pre...
A System of Estimators of the Population Mean under Two-Phase Sampling in Pre...Premier Publishers
 
Normal curve in Biostatistics data inference and applications
Normal curve in Biostatistics data inference and applicationsNormal curve in Biostatistics data inference and applications
Normal curve in Biostatistics data inference and applicationsBala Vidyadhar
 
Modeling monthly average daily diffuse radiation for dhaka, bangladesh
Modeling monthly average daily diffuse radiation for dhaka, bangladeshModeling monthly average daily diffuse radiation for dhaka, bangladesh
Modeling monthly average daily diffuse radiation for dhaka, bangladesheSAT Journals
 

What's hot (17)

Lecture 01 probability distributions
Lecture 01 probability distributionsLecture 01 probability distributions
Lecture 01 probability distributions
 
Chapter4
Chapter4Chapter4
Chapter4
 
Chapter 2 understanding the normal curve distribution
Chapter 2   understanding the normal curve distributionChapter 2   understanding the normal curve distribution
Chapter 2 understanding the normal curve distribution
 
Correlation measure for intuitionistic fuzzy multi sets
Correlation measure for intuitionistic fuzzy multi setsCorrelation measure for intuitionistic fuzzy multi sets
Correlation measure for intuitionistic fuzzy multi sets
 
Correlation measure for intuitionistic fuzzy multi sets
Correlation measure for intuitionistic fuzzy multi setsCorrelation measure for intuitionistic fuzzy multi sets
Correlation measure for intuitionistic fuzzy multi sets
 
Chapter13
Chapter13Chapter13
Chapter13
 
Download-manuals-surface water-manual-sw-volume2referencemanualsamplingprinc...
 Download-manuals-surface water-manual-sw-volume2referencemanualsamplingprinc... Download-manuals-surface water-manual-sw-volume2referencemanualsamplingprinc...
Download-manuals-surface water-manual-sw-volume2referencemanualsamplingprinc...
 
Download-manuals-ground water-manual-gw-volume2referencemanualsamplingprinci...
 Download-manuals-ground water-manual-gw-volume2referencemanualsamplingprinci... Download-manuals-ground water-manual-gw-volume2referencemanualsamplingprinci...
Download-manuals-ground water-manual-gw-volume2referencemanualsamplingprinci...
 
Measures of central tendency
Measures of central tendencyMeasures of central tendency
Measures of central tendency
 
M estimation, s estimation, and mm estimation in robust regression
M estimation, s estimation, and mm estimation in robust regressionM estimation, s estimation, and mm estimation in robust regression
M estimation, s estimation, and mm estimation in robust regression
 
A System of Estimators of the Population Mean under Two-Phase Sampling in Pre...
A System of Estimators of the Population Mean under Two-Phase Sampling in Pre...A System of Estimators of the Population Mean under Two-Phase Sampling in Pre...
A System of Estimators of the Population Mean under Two-Phase Sampling in Pre...
 
J012236977
J012236977J012236977
J012236977
 
MISHRA DISTRIBUTION
MISHRA DISTRIBUTIONMISHRA DISTRIBUTION
MISHRA DISTRIBUTION
 
F0742328
F0742328F0742328
F0742328
 
Normal curve in Biostatistics data inference and applications
Normal curve in Biostatistics data inference and applicationsNormal curve in Biostatistics data inference and applications
Normal curve in Biostatistics data inference and applications
 
Chapter11
Chapter11Chapter11
Chapter11
 
Modeling monthly average daily diffuse radiation for dhaka, bangladesh
Modeling monthly average daily diffuse radiation for dhaka, bangladeshModeling monthly average daily diffuse radiation for dhaka, bangladesh
Modeling monthly average daily diffuse radiation for dhaka, bangladesh
 

Viewers also liked

Integrating Traditional and Social Media Webinar
Integrating Traditional and Social Media WebinarIntegrating Traditional and Social Media Webinar
Integrating Traditional and Social Media WebinarCapstrat
 
Making visible the invisible. Metrical patterns, contrafacture and compilatio...
Making visible the invisible. Metrical patterns, contrafacture and compilatio...Making visible the invisible. Metrical patterns, contrafacture and compilatio...
Making visible the invisible. Metrical patterns, contrafacture and compilatio...Gimena Del Rio Riande
 
Exact value of pi π = (17- 8√3)
Exact value of pi π = (17- 8√3)Exact value of pi π = (17- 8√3)
Exact value of pi π = (17- 8√3)inventionjournals
 
Some Generalization of Eneström-Kakeya Theorem
Some Generalization of Eneström-Kakeya TheoremSome Generalization of Eneström-Kakeya Theorem
Some Generalization of Eneström-Kakeya Theoreminventionjournals
 
investigacion cualitativa mercado forma 1
investigacion cualitativa mercado forma 1investigacion cualitativa mercado forma 1
investigacion cualitativa mercado forma 1Wei Tao
 
(511066082) cv2015
(511066082) cv2015(511066082) cv2015
(511066082) cv2015mostafa saad
 
LTR of Recommendation.Shirley
LTR of Recommendation.ShirleyLTR of Recommendation.Shirley
LTR of Recommendation.ShirleyJoanne Riassetto
 

Viewers also liked (9)

Integrating Traditional and Social Media Webinar
Integrating Traditional and Social Media WebinarIntegrating Traditional and Social Media Webinar
Integrating Traditional and Social Media Webinar
 
Making visible the invisible. Metrical patterns, contrafacture and compilatio...
Making visible the invisible. Metrical patterns, contrafacture and compilatio...Making visible the invisible. Metrical patterns, contrafacture and compilatio...
Making visible the invisible. Metrical patterns, contrafacture and compilatio...
 
Exact value of pi π = (17- 8√3)
Exact value of pi π = (17- 8√3)Exact value of pi π = (17- 8√3)
Exact value of pi π = (17- 8√3)
 
Some Generalization of Eneström-Kakeya Theorem
Some Generalization of Eneström-Kakeya TheoremSome Generalization of Eneström-Kakeya Theorem
Some Generalization of Eneström-Kakeya Theorem
 
investigacion cualitativa mercado forma 1
investigacion cualitativa mercado forma 1investigacion cualitativa mercado forma 1
investigacion cualitativa mercado forma 1
 
(511066082) cv2015
(511066082) cv2015(511066082) cv2015
(511066082) cv2015
 
LTR of Recommendation.Shirley
LTR of Recommendation.ShirleyLTR of Recommendation.Shirley
LTR of Recommendation.Shirley
 
Tafeeq
TafeeqTafeeq
Tafeeq
 
I like sport2
I like sport2I like sport2
I like sport2
 

Similar to Generalized Family of Efficient Estimators of Population Median Using Two-Phase Sampling Design

Class of Estimators of Population Median Using New Parametric Relationship fo...
Class of Estimators of Population Median Using New Parametric Relationship fo...Class of Estimators of Population Median Using New Parametric Relationship fo...
Class of Estimators of Population Median Using New Parametric Relationship fo...inventionjournals
 
Some Unbiased Classes of Estimators of Finite Population Mean
Some Unbiased Classes of Estimators of Finite Population MeanSome Unbiased Classes of Estimators of Finite Population Mean
Some Unbiased Classes of Estimators of Finite Population Meaninventionjournals
 
Mixed Model Analysis for Overdispersion
Mixed Model Analysis for OverdispersionMixed Model Analysis for Overdispersion
Mixed Model Analysis for Overdispersiontheijes
 
Refining Measure of Central Tendency and Dispersion
Refining Measure of Central Tendency and DispersionRefining Measure of Central Tendency and Dispersion
Refining Measure of Central Tendency and DispersionIOSR Journals
 
International Journal of Computational Engineering Research(IJCER)
International Journal of Computational Engineering Research(IJCER)International Journal of Computational Engineering Research(IJCER)
International Journal of Computational Engineering Research(IJCER)ijceronline
 
On Estimation of Population Variance Using Auxiliary Information
On Estimation of Population Variance Using Auxiliary InformationOn Estimation of Population Variance Using Auxiliary Information
On Estimation of Population Variance Using Auxiliary Informationinventionjournals
 
Application of stochastic lognormal diffusion model with
Application of stochastic lognormal diffusion model withApplication of stochastic lognormal diffusion model with
Application of stochastic lognormal diffusion model withAlexander Decker
 
Learning dyadic data and predicting unaccomplished co-occurrent values by mix...
Learning dyadic data and predicting unaccomplished co-occurrent values by mix...Learning dyadic data and predicting unaccomplished co-occurrent values by mix...
Learning dyadic data and predicting unaccomplished co-occurrent values by mix...Loc Nguyen
 
A Mathematical Model for the Hormonal Responses During Neurally Mediated Sync...
A Mathematical Model for the Hormonal Responses During Neurally Mediated Sync...A Mathematical Model for the Hormonal Responses During Neurally Mediated Sync...
A Mathematical Model for the Hormonal Responses During Neurally Mediated Sync...irjes
 
Ratio and Product Type Estimators Using Stratified Ranked Set Sampling
Ratio and Product Type Estimators Using Stratified Ranked Set SamplingRatio and Product Type Estimators Using Stratified Ranked Set Sampling
Ratio and Product Type Estimators Using Stratified Ranked Set Samplinginventionjournals
 
Use of the correlation coefficient as a measure of effectiveness of a scoring...
Use of the correlation coefficient as a measure of effectiveness of a scoring...Use of the correlation coefficient as a measure of effectiveness of a scoring...
Use of the correlation coefficient as a measure of effectiveness of a scoring...Wajih Alaiyan
 
tps5e_Ch10_2.ppt
tps5e_Ch10_2.ppttps5e_Ch10_2.ppt
tps5e_Ch10_2.pptDunakanshon
 
A Generalised Class of Unbiased Seperate Regression Type Estimator under Stra...
A Generalised Class of Unbiased Seperate Regression Type Estimator under Stra...A Generalised Class of Unbiased Seperate Regression Type Estimator under Stra...
A Generalised Class of Unbiased Seperate Regression Type Estimator under Stra...IOSRJM
 
Subgroup identification for precision medicine. a comparative review of 13 me...
Subgroup identification for precision medicine. a comparative review of 13 me...Subgroup identification for precision medicine. a comparative review of 13 me...
Subgroup identification for precision medicine. a comparative review of 13 me...SuciAidaDahhar
 
A Mathematical Model for the Enhancement of Stress Induced Hypoglycaemia by A...
A Mathematical Model for the Enhancement of Stress Induced Hypoglycaemia by A...A Mathematical Model for the Enhancement of Stress Induced Hypoglycaemia by A...
A Mathematical Model for the Enhancement of Stress Induced Hypoglycaemia by A...irjes
 
Efficiency of ratio and regression estimators using double sampling
Efficiency of ratio and regression estimators using double samplingEfficiency of ratio and regression estimators using double sampling
Efficiency of ratio and regression estimators using double samplingAlexander Decker
 
International Journal of Mathematics and Statistics Invention (IJMSI)
International Journal of Mathematics and Statistics Invention (IJMSI) International Journal of Mathematics and Statistics Invention (IJMSI)
International Journal of Mathematics and Statistics Invention (IJMSI) inventionjournals
 

Similar to Generalized Family of Efficient Estimators of Population Median Using Two-Phase Sampling Design (20)

Class of Estimators of Population Median Using New Parametric Relationship fo...
Class of Estimators of Population Median Using New Parametric Relationship fo...Class of Estimators of Population Median Using New Parametric Relationship fo...
Class of Estimators of Population Median Using New Parametric Relationship fo...
 
Some Unbiased Classes of Estimators of Finite Population Mean
Some Unbiased Classes of Estimators of Finite Population MeanSome Unbiased Classes of Estimators of Finite Population Mean
Some Unbiased Classes of Estimators of Finite Population Mean
 
Mixed Model Analysis for Overdispersion
Mixed Model Analysis for OverdispersionMixed Model Analysis for Overdispersion
Mixed Model Analysis for Overdispersion
 
Refining Measure of Central Tendency and Dispersion
Refining Measure of Central Tendency and DispersionRefining Measure of Central Tendency and Dispersion
Refining Measure of Central Tendency and Dispersion
 
International Journal of Computational Engineering Research(IJCER)
International Journal of Computational Engineering Research(IJCER)International Journal of Computational Engineering Research(IJCER)
International Journal of Computational Engineering Research(IJCER)
 
On Estimation of Population Variance Using Auxiliary Information
On Estimation of Population Variance Using Auxiliary InformationOn Estimation of Population Variance Using Auxiliary Information
On Estimation of Population Variance Using Auxiliary Information
 
Application of stochastic lognormal diffusion model with
Application of stochastic lognormal diffusion model withApplication of stochastic lognormal diffusion model with
Application of stochastic lognormal diffusion model with
 
Learning dyadic data and predicting unaccomplished co-occurrent values by mix...
Learning dyadic data and predicting unaccomplished co-occurrent values by mix...Learning dyadic data and predicting unaccomplished co-occurrent values by mix...
Learning dyadic data and predicting unaccomplished co-occurrent values by mix...
 
A Mathematical Model for the Hormonal Responses During Neurally Mediated Sync...
A Mathematical Model for the Hormonal Responses During Neurally Mediated Sync...A Mathematical Model for the Hormonal Responses During Neurally Mediated Sync...
A Mathematical Model for the Hormonal Responses During Neurally Mediated Sync...
 
Ratio and Product Type Estimators Using Stratified Ranked Set Sampling
Ratio and Product Type Estimators Using Stratified Ranked Set SamplingRatio and Product Type Estimators Using Stratified Ranked Set Sampling
Ratio and Product Type Estimators Using Stratified Ranked Set Sampling
 
Use of the correlation coefficient as a measure of effectiveness of a scoring...
Use of the correlation coefficient as a measure of effectiveness of a scoring...Use of the correlation coefficient as a measure of effectiveness of a scoring...
Use of the correlation coefficient as a measure of effectiveness of a scoring...
 
20320130406030
2032013040603020320130406030
20320130406030
 
tps5e_Ch10_2.ppt
tps5e_Ch10_2.ppttps5e_Ch10_2.ppt
tps5e_Ch10_2.ppt
 
A Generalised Class of Unbiased Seperate Regression Type Estimator under Stra...
A Generalised Class of Unbiased Seperate Regression Type Estimator under Stra...A Generalised Class of Unbiased Seperate Regression Type Estimator under Stra...
A Generalised Class of Unbiased Seperate Regression Type Estimator under Stra...
 
Subgroup identification for precision medicine. a comparative review of 13 me...
Subgroup identification for precision medicine. a comparative review of 13 me...Subgroup identification for precision medicine. a comparative review of 13 me...
Subgroup identification for precision medicine. a comparative review of 13 me...
 
K0745256
K0745256K0745256
K0745256
 
Lad
LadLad
Lad
 
A Mathematical Model for the Enhancement of Stress Induced Hypoglycaemia by A...
A Mathematical Model for the Enhancement of Stress Induced Hypoglycaemia by A...A Mathematical Model for the Enhancement of Stress Induced Hypoglycaemia by A...
A Mathematical Model for the Enhancement of Stress Induced Hypoglycaemia by A...
 
Efficiency of ratio and regression estimators using double sampling
Efficiency of ratio and regression estimators using double samplingEfficiency of ratio and regression estimators using double sampling
Efficiency of ratio and regression estimators using double sampling
 
International Journal of Mathematics and Statistics Invention (IJMSI)
International Journal of Mathematics and Statistics Invention (IJMSI) International Journal of Mathematics and Statistics Invention (IJMSI)
International Journal of Mathematics and Statistics Invention (IJMSI)
 

Recently uploaded

VIP Call Girls Ankleshwar 7001035870 Whatsapp Number, 24/07 Booking
VIP Call Girls Ankleshwar 7001035870 Whatsapp Number, 24/07 BookingVIP Call Girls Ankleshwar 7001035870 Whatsapp Number, 24/07 Booking
VIP Call Girls Ankleshwar 7001035870 Whatsapp Number, 24/07 Bookingdharasingh5698
 
Russian Call Girls in Nagpur Grishma Call 7001035870 Meet With Nagpur Escorts
Russian Call Girls in Nagpur Grishma Call 7001035870 Meet With Nagpur EscortsRussian Call Girls in Nagpur Grishma Call 7001035870 Meet With Nagpur Escorts
Russian Call Girls in Nagpur Grishma Call 7001035870 Meet With Nagpur EscortsCall Girls in Nagpur High Profile
 
Call for Papers - African Journal of Biological Sciences, E-ISSN: 2663-2187, ...
Call for Papers - African Journal of Biological Sciences, E-ISSN: 2663-2187, ...Call for Papers - African Journal of Biological Sciences, E-ISSN: 2663-2187, ...
Call for Papers - African Journal of Biological Sciences, E-ISSN: 2663-2187, ...Christo Ananth
 
BSides Seattle 2024 - Stopping Ethan Hunt From Taking Your Data.pptx
BSides Seattle 2024 - Stopping Ethan Hunt From Taking Your Data.pptxBSides Seattle 2024 - Stopping Ethan Hunt From Taking Your Data.pptx
BSides Seattle 2024 - Stopping Ethan Hunt From Taking Your Data.pptxfenichawla
 
University management System project report..pdf
University management System project report..pdfUniversity management System project report..pdf
University management System project report..pdfKamal Acharya
 
UNIT-III FMM. DIMENSIONAL ANALYSIS
UNIT-III FMM.        DIMENSIONAL ANALYSISUNIT-III FMM.        DIMENSIONAL ANALYSIS
UNIT-III FMM. DIMENSIONAL ANALYSISrknatarajan
 
UNIT - IV - Air Compressors and its Performance
UNIT - IV - Air Compressors and its PerformanceUNIT - IV - Air Compressors and its Performance
UNIT - IV - Air Compressors and its Performancesivaprakash250
 
MANUFACTURING PROCESS-II UNIT-5 NC MACHINE TOOLS
MANUFACTURING PROCESS-II UNIT-5 NC MACHINE TOOLSMANUFACTURING PROCESS-II UNIT-5 NC MACHINE TOOLS
MANUFACTURING PROCESS-II UNIT-5 NC MACHINE TOOLSSIVASHANKAR N
 
Porous Ceramics seminar and technical writing
Porous Ceramics seminar and technical writingPorous Ceramics seminar and technical writing
Porous Ceramics seminar and technical writingrakeshbaidya232001
 
KubeKraft presentation @CloudNativeHooghly
KubeKraft presentation @CloudNativeHooghlyKubeKraft presentation @CloudNativeHooghly
KubeKraft presentation @CloudNativeHooghlysanyuktamishra911
 
Glass Ceramics: Processing and Properties
Glass Ceramics: Processing and PropertiesGlass Ceramics: Processing and Properties
Glass Ceramics: Processing and PropertiesPrabhanshu Chaturvedi
 
(SHREYA) Chakan Call Girls Just Call 7001035870 [ Cash on Delivery ] Pune Esc...
(SHREYA) Chakan Call Girls Just Call 7001035870 [ Cash on Delivery ] Pune Esc...(SHREYA) Chakan Call Girls Just Call 7001035870 [ Cash on Delivery ] Pune Esc...
(SHREYA) Chakan Call Girls Just Call 7001035870 [ Cash on Delivery ] Pune Esc...ranjana rawat
 
Booking open Available Pune Call Girls Koregaon Park 6297143586 Call Hot Ind...
Booking open Available Pune Call Girls Koregaon Park  6297143586 Call Hot Ind...Booking open Available Pune Call Girls Koregaon Park  6297143586 Call Hot Ind...
Booking open Available Pune Call Girls Koregaon Park 6297143586 Call Hot Ind...Call Girls in Nagpur High Profile
 
Top Rated Pune Call Girls Budhwar Peth ⟟ 6297143586 ⟟ Call Me For Genuine Se...
Top Rated  Pune Call Girls Budhwar Peth ⟟ 6297143586 ⟟ Call Me For Genuine Se...Top Rated  Pune Call Girls Budhwar Peth ⟟ 6297143586 ⟟ Call Me For Genuine Se...
Top Rated Pune Call Girls Budhwar Peth ⟟ 6297143586 ⟟ Call Me For Genuine Se...Call Girls in Nagpur High Profile
 
Sheet Pile Wall Design and Construction: A Practical Guide for Civil Engineer...
Sheet Pile Wall Design and Construction: A Practical Guide for Civil Engineer...Sheet Pile Wall Design and Construction: A Practical Guide for Civil Engineer...
Sheet Pile Wall Design and Construction: A Practical Guide for Civil Engineer...Dr.Costas Sachpazis
 
Call Girls Pimpri Chinchwad Call Me 7737669865 Budget Friendly No Advance Boo...
Call Girls Pimpri Chinchwad Call Me 7737669865 Budget Friendly No Advance Boo...Call Girls Pimpri Chinchwad Call Me 7737669865 Budget Friendly No Advance Boo...
Call Girls Pimpri Chinchwad Call Me 7737669865 Budget Friendly No Advance Boo...roncy bisnoi
 
Coefficient of Thermal Expansion and their Importance.pptx
Coefficient of Thermal Expansion and their Importance.pptxCoefficient of Thermal Expansion and their Importance.pptx
Coefficient of Thermal Expansion and their Importance.pptxAsutosh Ranjan
 
AKTU Computer Networks notes --- Unit 3.pdf
AKTU Computer Networks notes ---  Unit 3.pdfAKTU Computer Networks notes ---  Unit 3.pdf
AKTU Computer Networks notes --- Unit 3.pdfankushspencer015
 

Recently uploaded (20)

(INDIRA) Call Girl Aurangabad Call Now 8617697112 Aurangabad Escorts 24x7
(INDIRA) Call Girl Aurangabad Call Now 8617697112 Aurangabad Escorts 24x7(INDIRA) Call Girl Aurangabad Call Now 8617697112 Aurangabad Escorts 24x7
(INDIRA) Call Girl Aurangabad Call Now 8617697112 Aurangabad Escorts 24x7
 
VIP Call Girls Ankleshwar 7001035870 Whatsapp Number, 24/07 Booking
VIP Call Girls Ankleshwar 7001035870 Whatsapp Number, 24/07 BookingVIP Call Girls Ankleshwar 7001035870 Whatsapp Number, 24/07 Booking
VIP Call Girls Ankleshwar 7001035870 Whatsapp Number, 24/07 Booking
 
Russian Call Girls in Nagpur Grishma Call 7001035870 Meet With Nagpur Escorts
Russian Call Girls in Nagpur Grishma Call 7001035870 Meet With Nagpur EscortsRussian Call Girls in Nagpur Grishma Call 7001035870 Meet With Nagpur Escorts
Russian Call Girls in Nagpur Grishma Call 7001035870 Meet With Nagpur Escorts
 
Call for Papers - African Journal of Biological Sciences, E-ISSN: 2663-2187, ...
Call for Papers - African Journal of Biological Sciences, E-ISSN: 2663-2187, ...Call for Papers - African Journal of Biological Sciences, E-ISSN: 2663-2187, ...
Call for Papers - African Journal of Biological Sciences, E-ISSN: 2663-2187, ...
 
BSides Seattle 2024 - Stopping Ethan Hunt From Taking Your Data.pptx
BSides Seattle 2024 - Stopping Ethan Hunt From Taking Your Data.pptxBSides Seattle 2024 - Stopping Ethan Hunt From Taking Your Data.pptx
BSides Seattle 2024 - Stopping Ethan Hunt From Taking Your Data.pptx
 
University management System project report..pdf
University management System project report..pdfUniversity management System project report..pdf
University management System project report..pdf
 
UNIT-III FMM. DIMENSIONAL ANALYSIS
UNIT-III FMM.        DIMENSIONAL ANALYSISUNIT-III FMM.        DIMENSIONAL ANALYSIS
UNIT-III FMM. DIMENSIONAL ANALYSIS
 
UNIT - IV - Air Compressors and its Performance
UNIT - IV - Air Compressors and its PerformanceUNIT - IV - Air Compressors and its Performance
UNIT - IV - Air Compressors and its Performance
 
MANUFACTURING PROCESS-II UNIT-5 NC MACHINE TOOLS
MANUFACTURING PROCESS-II UNIT-5 NC MACHINE TOOLSMANUFACTURING PROCESS-II UNIT-5 NC MACHINE TOOLS
MANUFACTURING PROCESS-II UNIT-5 NC MACHINE TOOLS
 
Porous Ceramics seminar and technical writing
Porous Ceramics seminar and technical writingPorous Ceramics seminar and technical writing
Porous Ceramics seminar and technical writing
 
KubeKraft presentation @CloudNativeHooghly
KubeKraft presentation @CloudNativeHooghlyKubeKraft presentation @CloudNativeHooghly
KubeKraft presentation @CloudNativeHooghly
 
Glass Ceramics: Processing and Properties
Glass Ceramics: Processing and PropertiesGlass Ceramics: Processing and Properties
Glass Ceramics: Processing and Properties
 
(SHREYA) Chakan Call Girls Just Call 7001035870 [ Cash on Delivery ] Pune Esc...
(SHREYA) Chakan Call Girls Just Call 7001035870 [ Cash on Delivery ] Pune Esc...(SHREYA) Chakan Call Girls Just Call 7001035870 [ Cash on Delivery ] Pune Esc...
(SHREYA) Chakan Call Girls Just Call 7001035870 [ Cash on Delivery ] Pune Esc...
 
Booking open Available Pune Call Girls Koregaon Park 6297143586 Call Hot Ind...
Booking open Available Pune Call Girls Koregaon Park  6297143586 Call Hot Ind...Booking open Available Pune Call Girls Koregaon Park  6297143586 Call Hot Ind...
Booking open Available Pune Call Girls Koregaon Park 6297143586 Call Hot Ind...
 
Top Rated Pune Call Girls Budhwar Peth ⟟ 6297143586 ⟟ Call Me For Genuine Se...
Top Rated  Pune Call Girls Budhwar Peth ⟟ 6297143586 ⟟ Call Me For Genuine Se...Top Rated  Pune Call Girls Budhwar Peth ⟟ 6297143586 ⟟ Call Me For Genuine Se...
Top Rated Pune Call Girls Budhwar Peth ⟟ 6297143586 ⟟ Call Me For Genuine Se...
 
Sheet Pile Wall Design and Construction: A Practical Guide for Civil Engineer...
Sheet Pile Wall Design and Construction: A Practical Guide for Civil Engineer...Sheet Pile Wall Design and Construction: A Practical Guide for Civil Engineer...
Sheet Pile Wall Design and Construction: A Practical Guide for Civil Engineer...
 
Call Girls Pimpri Chinchwad Call Me 7737669865 Budget Friendly No Advance Boo...
Call Girls Pimpri Chinchwad Call Me 7737669865 Budget Friendly No Advance Boo...Call Girls Pimpri Chinchwad Call Me 7737669865 Budget Friendly No Advance Boo...
Call Girls Pimpri Chinchwad Call Me 7737669865 Budget Friendly No Advance Boo...
 
Water Industry Process Automation & Control Monthly - April 2024
Water Industry Process Automation & Control Monthly - April 2024Water Industry Process Automation & Control Monthly - April 2024
Water Industry Process Automation & Control Monthly - April 2024
 
Coefficient of Thermal Expansion and their Importance.pptx
Coefficient of Thermal Expansion and their Importance.pptxCoefficient of Thermal Expansion and their Importance.pptx
Coefficient of Thermal Expansion and their Importance.pptx
 
AKTU Computer Networks notes --- Unit 3.pdf
AKTU Computer Networks notes ---  Unit 3.pdfAKTU Computer Networks notes ---  Unit 3.pdf
AKTU Computer Networks notes --- Unit 3.pdf
 

Generalized Family of Efficient Estimators of Population Median Using Two-Phase Sampling Design

  • 1. International Journal of Mathematics and Statistics Invention (IJMSI) E-ISSN: 2321 – 4767 P-ISSN: 2321 - 4759 www.ijmsi.org Volume 3 Issue 2 || February. 2015 || PP-39-51 www.ijmsi.org 39 | P a g e Generalized Family of Efficient Estimators of Population Median Using Two-Phase Sampling Design 1, H.S. Jhajj , 2, Harpreet Kaur , 3, Puneet Jhajj ABSTRACT : For estimating the population median of variable under study, a generalized family of efficient estimators has been proposed by using prior information of population parameters based upon auxiliary variables under two-phase simple random sampling design. The comparison of proposed family of estimators has been made with the existing ones with respect to their mean square errors and biases. It has been shown that efficient estimators can be obtained from the family under the given practical situations which will have smaller mean square error than the linear regression type estimator, Singh et al estimator (2006), Gupta et al (2008) estimator and Jhajj et al estimator (2014). Effort has been made to illustrate the results numerically as well as graphically by taking some empirical populations considered in the literature which also show that bias of efficient estimators obtained from the proposed family of estimators is smaller than other considered estimators. KEYWORDS: Auxiliary variable; Bias; Mean square error; Median; Two-phase sampling. I. INTRODUCTION In survey sampling, statisticians have given more attention to the estimation of population mean, total, variance etc. but median is regarded as a more appropriate measure of location than mean when the distribution of variables such as income, expenditure etc. is highly skewed. In such situations, it is necessary to estimate median. Some authors such as Gross(1980), Kuk and Mak (1989), Singh et al (2001,2006), Jhajj et al (2013) etc. have considered the problem of estimating the median. Sometimes in a trivariate distribution consisting of study variable Y and auxiliary variables (X, Z), the correlation between the variables Y and Z is only because of their high correlation with the variable X but are not directly correlated to each other . For example: 1. In agriculture labour (say Z) and crop production (say Y) are highly correlated with the area under crop (say X) but not directly correlated to each other. 2. In any repetitive survey, the values of a variables of interest corresponding to both the last to last year (say Z) and current year (say Y) are highly correlated with the values of some variable corresponding to the last year (say X), whereas the values corresponding to the last to last year (Z) and the values corresponding to the current year (Y) are correlated with each other due to only their correlation with values of the some variable (X) corresponding to the last year. Suppose the prior information about population median ZM of variable Z is available where as the population median XM of variable X is not known. Such unknown information is generally predicted by using the two- phase sampling design. Let u consider a finite population U= (1, 2,… i ,...N). Let iY and iX , iZ be the values of study variable Y and auxiliary variables X, Z respectively on the th i unit of the population. Corresponding small letters indicate the value in the samples. Let MY and MX, MZ be the population medians of study variable and auxiliary variables respectively. Under two- phase sampling design, first phase sample of size n is selected using simple random sampling without replacement and observations on Y, X and Z are obtained on the sample units. Then second phase sample of size m under simple random sampling without replacement is drawn from the first phase sample and observations on the variables Y, X and Z are taken on selected units. Corresponding sample medians are denoted by , and for second phase sample while ˆ YM , ˆ XM and ˆ ZM are sample medians for the first phase sample. Suppose that y(1), y(2),…,y(m) are the values of variable Y on sample units in ascending order such that y(t)  MY  y(t +1) for some integral value of t. Let p = t/m be the proportion of Y values in the sample that are less than or equal to the value of median MY (an unknown population parameter). If pˆ is an estimator of p ,
  • 2. Generalized Family Of Efficient… www.ijmsi.org 40 | P a g e the sample median can be written in terms of quantiles as  pQY ˆˆ with pˆ = 0.5. Let the correlation coefficients between the estimators in  ˆ ˆ,X YM M ,  ˆ ˆ,Y ZM M and  ˆ ˆ,X ZM M are denoted by xy , yz and xz respectively which are defined as     11ˆ ˆ, 4 , 1 X Y xy M M P x y    , where    11 , X YP x y P X M Y M        11ˆ ˆ, 4 , 1 Y Z yz M M P y z    , where    11 , Y ZP y z P X M Y M        11ˆ ˆ, 4 , 1 X Z xz M M P x z    , where    11 , X ZP x z P X M Y M    Assuming that as N→∞, the distribution of the trivariate variable (X, Y, Z) approaches a continuous distribution with marginal densities , and of variables X, Y and Z respectively. This assumption holds in particular under a superpopulation model framework, treating the values of (X, Y, Z) in the population as a realization of N independent observations from a continuous distribution. Under these assumptions, Gross (1980) has shown that conventional sample median is consistent and asymptotically normal with median MY and variance     2 1 1 ˆ 4 ( ) Y Y m N Var M f M       (1.1) For the case of trivariate distribution of X, Y and Z and using two phase sampling design, linear regression type estimator of population median MY is defined as    ˆ ˆ ˆ ˆ ˆ Ylr Y X X Z ZM M M M M M       (1.2) where  and  are constants. Up to the first order of approximation,  ˆ YlrMSE M is minimized for     X xy Y f M f M   and     Z yz Y f M f M   and its minimum is given by     2 2 2 1 1 1 1 1 1 1ˆ 4 ( ) Ylr xy yz Y MSE M m N m n n Nf M                             (1.3) Singh et al (2006) defined a ratio type estimator of median under the two phase sampling design as 1 2 3 ˆ ˆ ˆ ˆ ˆ ˆ X Z Z S Y X Z Z M M M M M M M M                      (1.4) where ; 1,2,3i i  are constants. Up to first order of approximation, they minimized MSE ( ˆ SM ) for:    1 2 1 xz yz xyX X Y Y xz M f M M f M             ,    2 2 1 xz yz xyZ Z xz Y Y xz M f M M f M            
  • 3. Generalized Family Of Efficient… www.ijmsi.org 41 | P a g e and    3 2 1 xz xy yzZ Z Y Y xz M f M M f M                 2 2 .2min 1 1 1 1 1 1 1ˆ 4 ( ) S yz y xz Y MSE M R m N n N m nf M                            (1.5) where 2 2 2 . 2 2 1 xy yz xy yz xz y xz xz R           Using the knowledge of range ZR of variable Z along with its population median ZM , Gupta et al (2008) defined the estimator of population median MY under the same sampling design considered by Singh et al (2006) as 1 2 3 ˆ ˆ ˆ ˆ ˆ ˆ X Z Z Z Z P Y X Z Z Z Z M M R M R M M M M R M R                          (1.6) where  1,2,3i i  are constants. Up to the first order of approximation, they minimized MSE of ˆ PM for    1 2 1 xz yz xyX X Y Y xz M f M M f M             ,    2 2 1 1 xz yz xyZ Z xz Y Y xzZ Z Z M f M M f MM M R                  and,    3 2 1 1 xz xy yzZ Z Y Y xzZ Z Z M f M M f MM M R                  The bias and MSE of optimum estimator of ˆ PM obtained by them are:
  • 4. Generalized Family Of Efficient… www.ijmsi.org 42 | P a g e                           2 2 2 2 2 2 2 2 ˆ( ) 8 ( ) (1 ) 1 1 2 1 1 1 1 2 1 1 1 Y P Y Y xz xy yz xz xy xy yz xz xz Y Y xy yz xz xz X X yz xy xz xz xy yz xz yz xy xz Y Y Z yz xy xz xz Z Z Z Z M Bias M M f M m n M f M M f M m N M f M M M f M M R n N                                                                               22 2 2 2 1 1 xz xy yz xz yz xz xy yz xz xz Y Y Z xz xy yz xz xz Z Z Z Z M f M M M f M M R                                 (1.7) and     2 2 .2min 1 1 1 1 1 1 1ˆ 4 ( ) P yz y xz Y MSE M R m N n N m nf M                            (1.8) =  min ˆ SMSE M Recently Jhajj et al (2014) defined an efficient family of estimators of median using the same information used by Singh et al (2006) under same sampling design as  3 1 2 ˆ ˆ ˆ ˆ ˆ ˆ ˆ ˆ X X X X M M M M Z Z YH Y Z Z M M M M e M M                          (1.9) here 1 , 2 and 3 are constants. Up to the first order of approximation, they minimized MSE of ˆ YHM for    1 2 1 xz yz xyZ Z xz Y Y xz M f M M f M             ,    2 2 1 xy xz yzZ Z Y Y xz M f M M f M             and    3 2 2 1 yz xz xyX X Y Y xz M f M M f M            
  • 5. Generalized Family Of Efficient… www.ijmsi.org 43 | P a g e The bias and MSE of optimum estimator of ˆ YHM obtained by them are:                             2 2 2 2 2 2 2 2 ˆ( ) 8 ( ) (1 ) 1 1 2 1 1 1 1 2 2 1 1 Y YH Y Y xz xy yz xz xy xy yz xz xz Y Y xy yz xz xz X X yz xy xz xz xy yz xz yz xy xz Y Y yz yz xy xz xz yz xy xz xz Z Z M Bias M M f M m n M f M M f M m N M f M M f M                                                                               2 22 2 2 1 1 2 1 1 xz xy yz xz yz xz xy yz xz xz Y Y xz xy yz xz xz Z Z n N M f M M f M                                 (1.10) and     2 2 .2min 1 1 1 1 1 1 1ˆ 4 ( ) YH yz y xz Y MSE M R m N n N m nf M                            (1.11) =  min ˆ SMSE M II. PROPOSED ESTIMATOR AND ITS RESULTS Assuming that MZ is known for a trivariate distribution of variables X,Y and Z, in which variables Y and Z are highly correlated with variable X and correlated among themselves through X only. Then we proposed a family of estimators of population median YM under two phase sampling design described in Section 1 as   1 2 3 ˆ ˆ ˆ ˆ ˆ ˆ ˆ exp 2 ˆ ˆ ˆ ˆ X Z Z Z YHL Y Y Y X Z Z Z M M M M M M M M M M M M                                 (2.1) where 1 , 2 , 3 are constants and 0  . To find the bias and MSE of the estimator ˆ YHLM  , we define 0 ˆ 1Y Y M M    , 1 ˆ 1Y Y M M     , 2 ˆ 1X X M M    , 3 ˆ 1X X M M     , 4 ˆ 1Z Z M M    , 5 ˆ 1Z Z M M     such that ( ) 0iE   for i = 0, 1, 2, 3, 4, 5
  • 6. Generalized Family Of Efficient… www.ijmsi.org 44 | P a g e Assuming i < 1 i , we expand ˆ YHLM  in terms of s and retain the terms up to second degree of s in the derivation of bias and mean square error for obtaining the expressions up to first order of approximation                                          1 22 2 2 2 21 1 3 3 1 1 1 1 3 1 3 11 1ˆ( ) 4 2 1 11 1 2 2 1 Z ZY YHL Z Z yz Y Y X X Z Z X X X X Z Z xz xy yz Z Z Y Y Y Y M f MM Bias M M f M n N M f M M f M M f M m n M f M M f M M f M M f M M f M M f M                                                               (2.2)                                           1 2 2 22 3 3 2 2 22 2 2 1 2 1 1 1 1 2 1 2 1 1 1 1ˆ( ) 2 4 1 1 2 2(1 ) 2 Z ZY YHL Y Y Z Z yz Y Y Y Y X X Z Z X X Z Z X X xy yz xz Y Y Y Y Z Z M f MM MSE M M f M M f M m N n N M f M M f M M f M M f M m n M f M M f M M f M M f M M f M M f M                                                                   (2.3) For any fixed value of  ,  ˆ YHLBias M  and  ˆ YHLMSE M  are minimized for      1 2 1 , 1 yz xz xy X X xz Y Y M f M M f M                  2 Z Z yz Y Y M f M M f M   and      3 2 1 1 xy xz yz Z Z xz Y Y M f M M f M               and their corresponding minimum values are given by                              22 2 22 2 2 2 2 2 2 2 1 1 1ˆ( ) 1 2 1 8 1 1 2 1 2 1 1 1 1 YHL yz xz xy xy yz xz xy xz Y Y xz Y Y Y Y yz xz xz yz yz xz xy xz yz xz yz X X Z Z Bias M m nM f M M f M M f M M f M M f M n N                                                                                         2 2 1 1 2 1Y Y xy xz yz yz xy xz yz xz Z Z M f M M f M                               (2.4)       22 2 2 .2 1 1 1 1 1 1 1ˆ( ) 1 2 4 YHL yz y xz Y MSE M R m N n N m nf M                                (2.5)
  • 7. Generalized Family Of Efficient… www.ijmsi.org 45 | P a g e III. COMPARISON We compare the proposed family of estimators with respect to its mean square error with Singh et al (2006) estimator as well as linear regression type estimator ˆ YlrM because it is generally considered best in literature under the same conditions. Using the expressions (1.3) and (2.5), we have            2 2 2 .2 1 1 1ˆ ˆ 1 1 1 4 Ylr YHL y xz xy Y MSE M MSE M R m nf M                0 1 1for K K     (3.1) where 2 2 . 1 1 xy y xz K R    Using the expressions (1.5) and (2.5), we have 0 0 2for    (3.2) From (3.1) and (3.2), we note that the proposed family of estimators is always better than the linear regression type estimator as well as Singh et al (2006) estimator for 0 2  . Note: From the expressions of the biases obtained, we noted that no concrete conclusion can be obtained theoretically by comparing proposed estimator with the others with respect to their biases. So, the biases are compared numerically in Section 4. IV. NUMERICAL ILLUSTRATION For illustration of results numerically and graphically, we take the following data Data 1 (Source: Singh, 2003). Y: the number of fish caught by marine recreational fishermen in 1995; X: The number of fish caught by marine recreational fishermen in 1994; Z: The number of fish caught by marine recreational fishermen in 1993. N = 69, xy = 0.1505, YM =2068,  Yf M = 0.00014 n = 24, yz = 0.3166, XM =2011,  Xf M = 0.00014 m =17, xz = 0.1431, ZM =2307,  Zf M = 0.00013 Data 2 (Source: Aezel and Sounderpandian, 2004). Y: The U.S. exports to Singapore in billions of Singapore dollars; X: The money supply figures in billions of Singapore dollars; Z: The local supply in U.S. dollors. N = 67, xy = 0.6624, YM =4.8,  Yf M = 0.0763 n = 23, yz = 0.8624, XM =7.0,  Xf M = 0.0526 m =15, xz = 0.7592, ZM =151,  Zf M = 0.0024 Data 3. (Source: MFA, 2004). Y: District-wise tomato production (tones) in 2003; X: District-wise tomato production (tones) in 2002; Z: District-wise tomato production (tones) in 2001. N = 97, xy = 0.2096, YM =1242,  Yf M = 0.00021 n = 46, yz = 0.1233, XM =1233,  Xf M = 0.00022 m =33, xz = 0.1496, ZM =1207,  Zf M = 0.00023          2 2 .2min 1 1 1ˆ ˆ 2 1 4 S YHL y xz Y MSE M MSE M R m nf M             
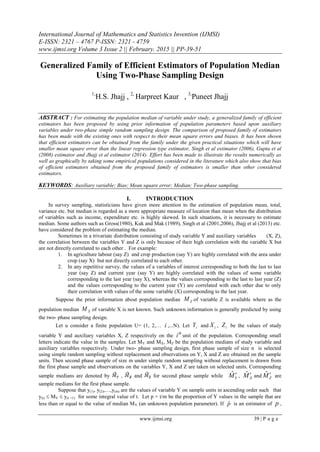
  • 8. Generalized Family Of Efficient… www.ijmsi.org 46 | P a g e For Data 1 Table 4.1 : Bias and relative efficiency of estimators  Bias Relative Efficiency of eeeeeestimatorEstimators ˆ SM ˆ PM ˆ YHM ˆ YHLM  ˆ GRM ˆ YlrM ˆ SM ˆ YHLM  -0.13 58.62 20.22 32.57 2.65E-07 100 107.5 105.83 96.134 -0.08 58.62 20.22 32.57 2.27E-07 100 107.5 105.83 99.781 -0.03 58.62 20.22 32.57 1.91E-07 100 107.5 105.83 103.53 0 58.62 20.22 32.57 1.69E-07 100 107.5 105.83 105.83 0.3 58.62 20.22 32.57 1.8E-08 100 107.5 105.83 129.96 0.6 58.62 20.22 32.57 1.8E-08 100 107.5 105.83 152.46 0.9 58.62 20.22 32.57 2.6E-07 100 107.5 105.83 165.48 1.2 58.62 20.22 32.57 3.1E-07 100 107.5 105.83 162.71 1.5 58.62 20.22 32.57 3.1E-07 100 107.5 1053 145.59 1.8 58.62 20.22 32.57 2.7E-07 100 107.5 105.83 121.79 2.1 58.62 20.22 32.57 1.8E-07 100 107.5 105.83 98.309 2.4 58.62 20.22 32.57 5.1E-08 100 107.5 105.83 78.415 Figure 4.1 -0.5 0.0 0.5 1.0 1.5 2.0 2.5 90 100 110 120 130 140 150 160 170 ˆ YHLM  ˆ SMˆ YlrM ˆ GRMGross(1980)Estimator Regression type Estimator Singh et al estimator Proposed Estimator Efficiency 
  • 9. Generalized Family Of Efficient… www.ijmsi.org 47 | P a g e Figure 4.2 -0.5 0.0 0.5 1.0 1.5 2.0 2.5 0 10 20 30 40 50 60 70 ˆ YHM ˆ YHLM  ˆ SM ˆ PM Proposed Estimator Singh et al Estimator Jhajj et al Estimator Gupta et al Estimator Bias  For Data 2 Table 4.2 : Bias and relative efficiency of estimators  Bias Relative Efficiency of Estimators ˆ SM ˆ PM ˆ YHM ˆ YHLM  ˆ GRM ˆ YlrM ˆ SM ˆ YHLM  -1.7 0.37 0.28 0.026 0.023417 100 254.55 286.9 93.413 -1.2 0.37 0.28 0.026 0.017163 100 254.55 286.9 126.69 -0.7 0.37 0.28 0.026 0.011761 100 254.55 286.9 176.84 -0.2 0.37 0.28 0.026 0.00721 100 254.55 286.9 250.6 0 0.37 0.28 0.026 0.005628 100 254.55 286.9 286.91 0.4 0.37 0.28 0.026 0.002873 100 254.55 286.9 363.53 0.8 0.37 0.28 0.026 0.000662 100 254.55 286.9 419.55 1.2 0.37 0.28 0.026 0.001 100 254.55 286.9 419.55 1.6 0.37 0.28 0.026 0.00212 100 254.55 286.9 363.53 2 0.37 0.28 0.026 0.0027 100 254.55 286.9 286.91 2.4 0.37 0.28 0.026 0.00273 100 254.55 286.9 217.99 2.8 0.37 0.28 0.026 0.00222 100 254.55 286.9 165.11 3.2 0.37 0.28 0.026 0.00116 100 254.55 286.9 126.69 3.6 0.37 0.28 0.026 0.000446 100 254.55 286.9 99.041 4 0.37 0.28 0.026 0.002594 100 254.55 286.9 78.939
  • 10. Generalized Family Of Efficient… www.ijmsi.org 48 | P a g e Figure 4.3 -2 -1 0 1 2 3 4 50 100 150 200 250 300 350 400 450 ˆ YHLM  ˆ SM ˆ YlrM ˆ GRM Regression type Estimator Gross(1980) Estimator Singh et al Estimator Proposed Estimator Efficiency  Figure 4.4 -2 -1 0 1 2 3 4 0.00 0.05 0.10 0.15 0.20 0.25 0.30 0.35 ˆ YHM ˆ SM ˆ PM ˆ YHLM  Singh et al estimator Gupta et al estimator Jhajj et al estimator Proposed Estimator BIAS 
  • 11. Generalized Family Of Efficient… www.ijmsi.org 49 | P a g e For Data 3 Table 4.3 : Bias and relative efficiency of estimators  Bias Relative Efficiency of Estimators ˆ SM ˆ PM ˆ YHM ˆ YHLM  ˆ GRM ˆ YlrM ˆ SM ˆ YHLM  -0.1 8.06 3.63 4.75 2.23E-07 100 102.8 103.7 95.277 0 8.06 3.63 4.75 1.77E-07 100 102.8 103.7 103.69 0.2 8.06 3.63 4.75 9.48E-08 100 102.8 103.7 122.2 0.4 8.06 3.63 4.75 2.44E-08 100 102.8 103.7 141.89 0.6 8.06 3.63 4.75 3.4E-08 100 102.8 103.7 160.36 0.8 8.06 3.63 4.75 8E-08 100 102.8 103.7 173.93 1 8.06 3.63 4.75 1.1E-07 100 102.8 103.7 178.99 1.2 8.06 3.63 4.75 1.4E-07 100 102.8 103.7 173.93 1.4 8.06 3.63 4.75 1.5E-07 100 102.8 103.7 160.36 1.6 8.06 3.63 4.75 1.5E-07 100 102.8 103.7 141.89 1.8 8.06 3.63 4.75 1.3E-07 100 102.8 103.7 122.2 2 8.06 3.63 4.75 1.1E-07 100 102.8 103.7 103.69 2.2 8.06 3.63 4.75 -6.8E-08 100 102.8 103.7 87.498
  • 12. Generalized Family Of Efficient… www.ijmsi.org 50 | P a g e Figure 4.5 Figure 4.6 -0.5 0.0 0.5 1.0 1.5 2.0 2.5 0 1 2 3 4 5 6 7 8 ˆ YHM ˆ YHLM  ˆ SM ˆ PM Proposed Estimator Gupta et al Estimator Jhajj et al Estimator Singh et al Estimator Bias  From tables (4.1), (4.2) and (4.3), we note that proposed family of estimators have smaller mean square error than Gross(1980) estimator, linear regression type estimator ˆ YlrM , Singh et al (2006) estimator, Gupta et al (2008) estimator and Jhajj et al estimator (2014) as well as have smaller bias than Singh et al (2006) estimator, Gupta et al (2008) estimator and Jhajj et al estimator (2014) in all the three populations considered corresponding to  0,2 . The graphical representation also supports the numerical results.
  • 13. Generalized Family Of Efficient… www.ijmsi.org 51 | P a g e V. CONCLUSION The range of variation of  involved in the proposed family of estimators of population median under two-phase sampling design has been obtained theoretically under which its estimators are efficient than the existing ones. It has been found theoretically that proposed family of estimators is efficient than the linear regression type estimator ˆ YlrM , Singh et al (2006) estimator Gupta et al (2008) estimator and Jhajj et al estimator (2014) for  0,2 . Numerical results for all the three populations also show that optimum estimator of proposed family having smaller bias is efficient than them. Graphical representation also gives the same type of interpretation. Hence, we conclude that better estimators can be developed from the proposed family by choosing suitable values of  0,2 . So, it is strongly recommended that proposed family of estimators should be used for getting the accurate value of population median. REFERENCES [1]. Azel A.D., Sounderpandian J. (2004).Complete Business Statistics. 5th ed. New York: McGraw Hill, [2]. Gross S.T. (1980). Median estimation in sample Proc. Surv. Res. Meth. Sect. Amer. Statist Ass.,181-184. [3]. Gupta S., Shabbir J. and Ahmad S.(2008). Estimation of median in two- phase sampling using two auxiliary variables. Communication in Statistics-Theory and Methods, 37(11), 1815- 1822. [4]. Jhajj H.S.and Harpreet Kaur (2013),Generalized estimators of population median using auxiliary information, IJSER, 11(4), 378-389. [5]. Jhajj H.S., Harpreet Kaur and Walia Gurjeet(2013), Efficient family of ratio-product type estimators of median, MASA, Vol 9, 2014, 277-282. [6]. Jhajj H.S., Harpreet Kaur and Jhajj Puneet (2014), Efficient family of estimators of median using two phase sampling design, Communication in Statistics-Theory and Methods, Accepted. [7]. Kuk Y.C.A. and Mak T.K. (1989). Median estimation in the presence of auxiliary information. J.R Statist.Soc. B, (2), 261-269. [8]. MFA (2004). Crops Area Production. Ministery of food and Agriculture. Islamabad: Pakistan. Singh S. (2003).Advanced Sampling Theory with Applications. Vol. 1 & 2. London Kluwer Academic Publishers. [9]. Singh S. , Joarder A. H. and Tracy D. S.(2001), Median estimation using double sampling. Austral. N.J. Statist. 43(1) , 33-46. [10]. Singh S., Singh H.P and Upadhyaya L.N. (2006). Chain ratio and regression type estimators for median estimation in survey sampling. Statist. Pap. 48, 23-46.