120-Moncada-EU corporate R&D Intensity gap
•
1 like•187 views

Blue Sky 3 - Poster Gallery
Recommended

Recommended
More Related Content
What's hot
What's hot (20)
Viewers also liked
Viewers also liked (8)
Similar to 120-Moncada-EU corporate R&D Intensity gap
Similar to 120-Moncada-EU corporate R&D Intensity gap (20)
More from innovationoecd
More from innovationoecd (20)
Recently uploaded
Recently uploaded (20)
120-Moncada-EU corporate R&D Intensity gap
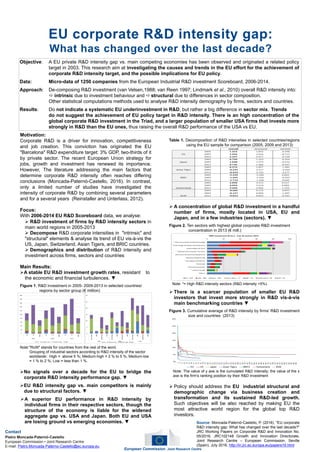
- 1. European Commission, Joint Research Centre Motivation: Corporate R&D is a driver for innovation, competitiveness and job creation. This conviction has originated the EU "Barcelona" R&D expenditure target: 3% GDP, two-thirds of it by private sector. The recent European Union strategy for jobs, growth and investment has renewed its importance. However, The literature addressing the main factors that determine corporate R&D intensity often reaches differing conclusions (Moncada-Paternò-Castello, 2016). In contrast, only a limited number of studies have investigated the intensity of corporate R&D by combining several parameters and for a several years (Reinstaller and Unterlass, 2012). Focus: With 2006-2014 EU R&D Scoreboard data, we analyse: R&D investment of firms by R&D intensity sectors in main world regions in 2005-2013 Decompose R&D corporate intensities in "intrinsic" and "structural" elements & analyse its trend of EU vis-à-vis the US, Japan, Switzerland, Asian Tigers, and BRIC countries. Demographics and distribution of R&D intensity and investment across firms, sectors and countries Main Results: A stable EU R&D investment growth rates, resistant to the economic and financial turbulences. ▼ Figure 1. R&D investment in 2005- 2009-2013 in selected countries/ regions by sector group (€ million) Note:"RoW" stands for countries from the rest of the word. Grouping of industrial sectors according to R&D intensity of the sector worldwide: High = above 5 %; Medium-high = 2 % to 5 %; Medium-low = 1 % to 2 %; Low = less than 1 %. No signals over a decade for the EU to bridge the corporate R&D intensity performance gap. ▼ EU R&D intensity gap vs. main competitors is mainly due to structural factors. ▼ A superior EU performance in R&D intensity by individual firms in their respective sectors, though the structure of the economy is liable for the widened aggregate gap vs. USA and Japan. Both EU and USA are losing ground vs emerging economies. ▼ Table 1. Decomposition of R&D intensities in selected countries/regions using the EU sample for comparison (2005, 2009 and 2013) A concentration of global R&D investment in a handful number of firms, mostly located in USA, EU and Japan, and in a few industries (sectors). ▼ Figure 2. Ten sectors with highest global corporate R&D investment concentration in 2013 (€ mill.) Note: *= High R&D intensity sectors (R&D intensity >5%). There is a scarcer population of smaller EU R&D investors that invest more strongly in R&D vis-à-vis main benchmarking countries ▼ Figure 3. Cumulative average of R&D intensity by firms' R&D investment size and countries (2013) Note: The value of y axe is the cumulated R&D intensity; the value of the x axe is the firm's ranking position by their R&D investment Policy should address the EU industrial structural and demographic change via business creation and transformation and its sustained R&D-led growth. Such objectives will be also reached by making EU the most attractive world region for the global top R&D investors. Source: Moncada-Paternò-Castello, P. (2016). "EU corporate R&D intensity gap: What has changed over the last decade?" JRC Working Papers on Corporate R&D and Innovation No. 05/2016, JRC102148 Growth and Innovation Directorate, Joint Research Centre – European Commission. Seville (Spain), July 2016. http://iri.jrc.ec.europa.eu/papers16.html EU corporate R&D intensity gap: What has changed over the last decade? Contact Pietro Moncada-Paternò-Castello European Commission • Joint Research Centre E-mail: Pietro.Moncada-Paterno-Castello@ec.europa.eu Objective: A EU private R&D intensity gap vs. main competing economies has been observed and originated a related policy target in 2003. This research aim at investigating the causes and trends in the EU effort for the achievement of corporate R&D intensity target, and the possible implications for EU policy. Data: Micro-data of 1250 companies from the European Industrial R&D investment Scoreboard, 2006-2014. Approach: De-composing R&D investment (van Velsen,1988; van Reen 1997; Lindmark et al., 2010) overall R&D intensity into: intrinsic due to investment behaviour and structural due to differences in sector composition. Other statistical computations methods used to analyse R&D intensity demography by firms, sectors and countries. Results: Do not indicate a systematic EU underinvestment in R&D, but rather a big difference in sector mix. Trends do not suggest the achievement of EU policy target in R&D intensity. There is an high concentration of the global corporate R&D investment in the Triad, and a larger population of smaller USA firms that invests more strongly in R&D than the EU ones, thus raising the overall R&D performance of the USA vs EU.