
Recommended

Recommended
More Related Content
What's hot
What's hot (12)
Similar to 082-NIFU Measuring Educational R&D
Similar to 082-NIFU Measuring Educational R&D (20)
More from innovationoecd
More from innovationoecd (20)
Recently uploaded
Recently uploaded (20)
082-NIFU Measuring Educational R&D
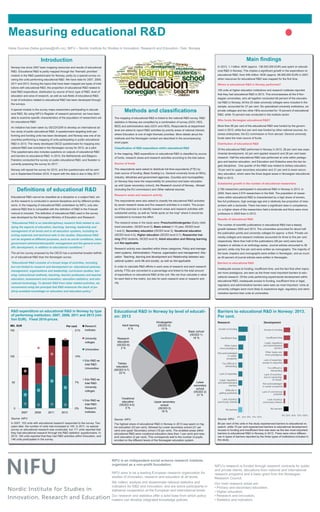
- 1. Measuring educational R&D Definitions of educational R&D Educational R&D cannot be classified as a discipline or a subject field, sin- ce this research is conducted in several disciplines and by different profes- sions. In the mapping of educational R&D undertaken by NIFU, only edu- cational R&D that is compatible with the definition of R&D in the Frascati manual is included. The definition of educational R&D used in the survey was developed by the Norwegian Ministry of Education and Research: “Educational R&D is an interdisciplinary research field related to stu- dying the aspects of education; teaching, learning, leadership and management of all levels and in all education systems, including te- aching materials and technical aids in the studies. Educational R&D can be targeted at different purposes, such as social conditions, labor, government administration/public management and the general scien- tific development, in addition to educational conditions.” The ad hoc survey proposed by the OECD has a somewhat broader definiti- on of educational R&D than the Norwegian survey: “Educational R&D consists of a broad range of activities, including but not limited to research and development on: educational policies; management, organisations and leadership; curriculum studies; lear- ning; instructional methods; teaching, teacher profession and teacher education; assessment and evaluation; education statistics; and edu- cational technology. To demark R&D from other related activities, we recommend using the principle that R&D enhances the stock of pu- blicly-available knowledge on education and education policy.” Main findings In 2013, 1,1 billion. NOK (approx. 136.000.000 EUR) was spent on educati- onal R&D in Norway. This implies a significant growth in the expenditure on educational R&D, from 548 million. NOK (approx. 66.000.000 EUR) in 2007, when resources for educational R&D was mapped for the first time. Where is educational R&D in Norway performed? 195 units at higher education institutions and research institutes reported that they had educational R&D in 2013. This encompasses all the 8 Nor- wegian universities, who all together conducted 48 percent of the educatio- nal R&D in Norway. All the 20 state university colleges were included in the sample, accounted for 27 per cent. Six specialized university institutions, six private colleges and two other HEIs accounted for 15 percent of educational R&D, while 10 percent was conducted in the institute sector. Who funds Norwegian educational R&D? More than 90 per cent of the educational R&D was funded by the govern- ment in 2013, while four per cent was funded by other national sources, bu- siness enterprises, the EU commission or from abroad. General university funds were the main source of funds. Distribution of educational R&D Of the educational R&D performed in Norway in 2013, 28 per cent was expe- rimental development, 42 per cent applied research and 28 per cent basic research. Half the educational R&D was performed at units within pedago- gics and teacher education, and Education and Didactics were the two lar- gest disciplines. One quarter of the R&D was related to tertiary education, 19 per cent to upper secondary education and 21 per cent to lower secon- dary education, which were the three largest areas in Norwegian educational R&D in 2013. Substantial growth in the number of educational researchers 2.780 reseachers participated in educational R&D in Norway in 2013. In 2009, there were 2.074 researchers in the field. The population of resear- chers within educational R&D is characterized by a high share of women, few full professors, high average age and a relatively low proportion of rese- archers with a doctorate. There has been a significant raise in competence, i.e. a higher share of the researchers held a doctorate and there were more professors in 2009 than in 2013. Results of educational R&D The number of scientific publications in educational R&D had a steady growth between 2005 and 2013. The universities accounted for about half the publication points and university colleges for approx. a third. Private uni- versity colleges and research institutes accounted for three to five per cent respectively. More than half of the publications (58 per cent) were book chapters or articles in an anthology series. Journal articles amounted to 38 percent, while only five per cent were written as monographs. The majority of the book chapters and monographs were written in Norwegian, and as much as 40 percent of journal articles were written in Norwegian. Barriers to educational R&D Inadequate access to funding, insufficient time, and the fact that other topics are more prestigious, are seen as the three most important barriers to edu- cational research. Of the units performing experimental development within educational R&D, inadequate access to funding, insufficient time or legal, regulatory and administrative barriers were seen as most important. Units at university colleges were more likely to experience legal, regulatory and admi- nistrative barriers than units at universities. NIFU is an independent social science research institute, organized as a non-profit foundation. NIFU aims to be a leading European research organization for studies of innovation, research and education at all levels. We collect, analyse and disseminate national statistics and indicators for R&D and innovation, and are active participants in statistical cooperation at the European and international levels. Our research and statistics offer a solid base from which policy- makers can develop integrated knowledge policies. NIFU’s research is funded through research contracts for public and private clients, allocations from national and international research programs and a basic grant from the Norwegian Research Council. Our main research areas are: • Primary and secondary education, • Higher education, • Research and innovation, • Statistics and indicators Hebe Gunnes (hebe.gunnes@nifu.no), NIFU – Nordic Institute for Studies in Innovation, Research and Education, Oslo, Norway Barriers to educational R&D in Norway: 2013. Per cent. Research Development Source: NIFU 80 per cent of the units in the study experienced barriers to educational re- search, while 75 per cent experienced barriers to educational development. Access to funding and insufficient time was seen as the two most important barriers to educational R&D in Norway in 2013. There were minor differen- ces in types of barriers reported by the three types of institutions included in the study. Introduction Norway has since 2007 been mapping resources and results of educational R&D. Educational R&D is partly mapped through the “thematic priorities” module in the R&D questionnaire for Norway, partly by a special survey co- vering the units performing educational R&D. We have data for 2007, 2009, 2011 and 2013. Among the topics that have been mapped are types of insti- tutions with educational R&D, the proportion of educational R&D related to total R&D expenditure, distribution by source of fund, type of R&D, level of education and area of research, as well as sub-fields of educational R&D. A set of indicators related to educational R&D has been developed through the surveys. A special module in the survey maps researchers participating in educati- onal R&D. By using NIFU’s Register of research personnel, we have been able to examine specific characteristics of the population of researchers wit- hin educational R&D. An initiative has been taken by OECD/CERI to develop an international ad hoc study of public educational R&D. A questionnaire targeting both per- forming and funding units has been developed, and Norway was one of six countries performing a mapping of units participating in public educational R&D in 2013. The newly developed OECD questionnaire for mapping edu- cational R&D was included in the Norwegian survey for 2013, as a pilot. This questionnaire also includes questions on outputs of educational R&D and barriers to educational R&D. In 2014, the Netherlands and Belgium- Flanders conducted the survey on public educational R&D, and Sweden is currently preparing the survey for 2017. Norway will repeat the survey for 2015, and the questionnaire will be sent out in September/October 2016. A report with the data is due in May 2017. Methods and classifications The mapping of educational R&D is linked to the national R&D survey. R&D statistics in Norway are compilled by a combination of survey (GOV, HES, BES) and administrative data (GOV and HES). Respondents at department level are asked to report R&D activities by priority areas of national interest, where Education is one of eight thematic priorities. More details about the methods and the Norwegian context are described in the accompanying short paper. Classification of R&D expenditure within educational R&D In the mapping, R&D expenditure on educational R&D is classified by source of funds, research areas and research activities according to the lists below. Source of funds The respondents were asked to distribute full-time-equivalents (FTE) by main source of funding: Basic funding (i.e. General university funds at HEIs), Industry, Ministries and government agencies, Counties and municipalities (in Norway they have the responsibility for preschool and basic education up until Upper secondary school), the Research council of Norway, Abroad (including the EU commission) and Other national sources. Research areas and research activity The respondents were also asked to classify the educational R&D activities by seven research areas and five research activities in a matrix. The purpo- se of this exercise is to identify research areas and research activities with substantial activity, as well as "white spots on the map" where it should be considered to increase the effort. The research areas in the study were: Preschool/kindergarten (Early child- hood education, ISCED level 0), Basic school (1-10 year, ISCED level 1 and 2), Secondary education (ISCED level 3), Vocational education (ISCED level 4-5), Higher education (ISCED level 5-7), Researcher trai- ning (PhD students, ISCED level 8), Adult education and lifelong learning and Not applicable. Research activity was classified within these categories: Policy and manage- ment systems, Administration: Finance, organization and management, Edu- cation: Teaching, learning and development and Relationship between edu- cational system, work life and society, as well as Not applicable. In order to calculate R&D efforts in each area of research and each research activity, FTEs are converted to a percentage and linked to the total amount of expenditure on educational R&D at the unit. We can thus calculate a value for each field in the matrix, but also for each research area or research acti- vity. R&D expenditure on educational R&D in Norway by type of performing institution; 2007, 2009, 2011 and 2013 (mil- lion EUR). Fixed 2010-prices. Source: NIFU In 2007, 103 units with educational research responded to the survey. Two years later, the number of units had increased to 145. In 2011, no special survey on educational research was conducted, but 171 units reported that they had educational research through the R&D statistics’ questionnaire. In 2013, 195 units reported that they had R&D activities within Education, and 146 units participated in the survey. Educational R&D in Norway by level of educati- on: 2013 Source: NIFU The highest share of educational R&D in Norway in 2013 was spent on hig- her education (23 per cent), followed by Lower secondary school (21 per cent) and upper Secondary school (19 per cent). The smallest areas within educational R&D were vocational education (less than 1 per cent) and rese- arch education (2 per cent). This corresponds well to the number of pupils enrolled on the different levels of the Norwegian education system. 0% 7% 14% 21% 0 50 100 150 2007 2009 2011 2013 Per centMill. EUR Research institutes University colleges Universities Edu R&D as total R&D: Universities Edu R&D as total R&D: University colleges Edu R&D as total R&D: Research institutes Kindergarten (ISCED 0) 13 % Basic school (ISCED 1) 16 % Lower secondary school (ISCED 2) 21 % Upper secondary school (ISCED 3) 19 % Vocational education (ISCED 4-5) 0 % Tertiary education (ISCED 5-7) 23 % Research education (ISCED 8) 2 % Adult learning 6 % 0% 25% 50% 75% 100% No barriers Lack of policy/ community interest Lack of commercial potential Not acknowledged in career prospects Lack of incentive due to ownership of results Too difficult or demanding Lack of expertise/ access to expertise Other topics are more prestigious Legal, regulatory and administrative barriers Insufficient time Access to funding 0% 25% 50% 75% 100% No barriers Lack of policy/ community interest Difficulty in getting published Legal, regulatory and administrative barriers Lack of expertise Too difficult or demanding Not acknowledged in career prospects Other topics more prestigious Insufficient time Access to funding