Download as PDF, PPTX


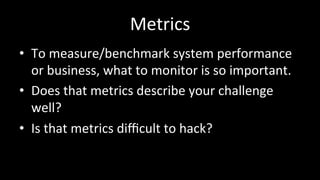


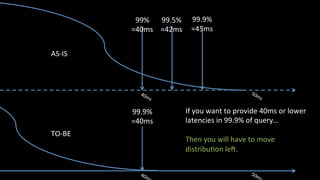


The document discusses performance benchmarking and metrics essential for evaluating system and business performance. It emphasizes the importance of using percentiles over averages to accurately describe customer experience and suggests methodologies for designing and conducting benchmarks. Additionally, it highlights the significance of setting performance targets and using automation to streamline the benchmarking process in cloud environments.