
Recommended
Recommended
More Related Content
Similar to Anthropogenic Activities as Primary Drivers of Environmental Pollution and Loss of Biodiversity A Review
Similar to Anthropogenic Activities as Primary Drivers of Environmental Pollution and Loss of Biodiversity A Review (20)
More from ijtsrd
More from ijtsrd (20)
Recently uploaded
Recently uploaded (20)
Anthropogenic Activities as Primary Drivers of Environmental Pollution and Loss of Biodiversity A Review
- 1. International Journal of Trend in Scientific Research and Development (IJTSRD) Volume 6 Issue 4, May-June 2022 Available Online: www.ijtsrd.com e-ISSN: 2456 – 6470 @ IJTSRD | Unique Paper ID – IJTSRD50142 | Volume – 6 | Issue – 4 | May-June 2022 Page 621 Anthropogenic Activities as Primary Drivers of Environmental Pollution and Loss of Biodiversity: A Review Justin Okorondu1 , Nasir A. Umar1 , Chukwuemeka O. Ulor1 , Chinwe G. Onwuagba1 , Bridget E. Diagi1 , Susan I. Ajiere2 , Chukwudi Nwaogu1, * 1 Department of Environmental Management, School of Environmental Sciences, Federal University of Technology, Owerri, Imo State, Nigeria 2 Department of Geography and Environmental Management, University of Port-Harcourt, Nigeria ABSTRACT Environmental Pollution (EP) has become a global issue as the impacts are mainly crucial threats to man and biodiversity especially in Africa and other developing countries. In addition to humans and biodiversity, the effects of EP are intense on plants, animals, soil, water and air. As population increases, human needs for food, clothes, mobility and shelter get elevated which in turn require higher use of technology and energy resources vis-à-vis anthropogenic activities are the primary causes of the rising challenges of EP. This work is aimed at reviewing the roles of anthropogenic activities as key drivers of environmental pollution and loss of biodiversity. In order to achieve this aim and justify the work, the following specific objectives were developed including to: (i) identify and review relevant literature on anthropogenic activities prevalent in Africa. (ii) examine the impacts of the major anthropogenic activities on the environment including human health, soil, water, air, flora and fauna biodiversity. (iii) proffer sustainable solutions to curb the menace. Primary findings reveal the significant and adverse effects of anthropogenic activities on environmental risks, health and biodiversity due to increase in waste generation and use of non- renewable resources. Urgent need is necessary to create awareness among the various sectors of the society and to sensitize the people on the sustainable ways for waste generation and management. The paper recommends need for the comprehensive development and establishment of appropriate laws and policies to ameliorate EP and its associated menace. KEYWORDS: Environmental pollution, Anthropogenic activities, Biodiversity, Sustainability, Africa, Nigeria How to cite this paper: Justin Okorondu | Nasir A. Umar | Chukwuemeka O. Ulor | Chinwe G. Onwuagba | Bridget E. Diagi | Susan I. Ajiere | Chukwudi Nwaogu "Anthropogenic Activities as Primary Drivers of Environmental Pollution and Loss of Biodiversity: A Review" Published in International Journal of Trend in Scientific Research and Development (ijtsrd), ISSN: 2456- 6470, Volume-6 | Issue-4, June 2022, pp.621-643, URL: www.ijtsrd.com/papers/ijtsrd50142.pdf Copyright © 2022 by author(s) and International Journal of Trend in Scientific Research and Development Journal. This is an Open Access article distributed under the terms of the Creative Commons Attribution License (CC BY 4.0) (http://creativecommons.org/licenses/by/4.0) INTRODUCTION Anthropogenic activities are socioeconomic activities carried out by man on the environment like farming, deforestation, bush burning, industrial activities, etc. (Mutavi and Long’ora 2019). Biodiversity refers to the variety and variability of all life on earth. Due to the process of evolution, thousands of species of animals and plants now exist on the planet. Biodiversity encompasses the wide range of genes, species, and ecosystems that have become established on the planet, which intertwines and impact each other. In recent times, biodiversity has become easy targets for human over-exploitation due to increasing human populations and the quest for a “better life” through improvements in science and technology (Wuver and Attuquayefio, 2006). Biodiversity, therefore, is being exploited at much faster rates than ever before with negative implications for sustainable human livelihood (Turner et al., 1990). In Ghana, increasing evidence indicates that the rate of environmental degradation has increased in recent times (Gyasi et al., 1995), with previously rich forests being converted to savanna woodland and existing savanna IJTSRD50142
- 2. International Journal of Trend in Scientific Research and Development @ www.ijtsrd.com eISSN: 2456-6470 @ IJTSRD | Unique Paper ID – IJTSRD50142 | Volume – 6 | Issue – 4 | May-June 2022 Page 622 woodlands converted into near desert (Hawthorne & Abu-Juam, 1995). It has been estimated that Ghana’s high forest area of 8.2 million hectares at the turn of last century had dwindled to about 1.7 million hectares by the mid-1980s (Hall, 1987), and about one million hectares by the mid-1990s (Forest Services Division, 1996). Impact of anthropogenic activities on plant biodiversity Some of the anthropogenic activities that effect the biodiversity of our natural vegetation include: deforestation, urbanization, bushfire and agriculture, oil spillage, etc. Deforestation: Deforestation results from the removal of trees without sufficient replacement, which leads to reduction in habitat, biodiversity as well as wood and quality of life. The use of the term “Deforestation” at times is associated with distortion of forestry issues. It is used to denote activities that use the forest, for instance, felling of wood for fuel, commercial logging and activities associated with temporary removal of forest cover such as slash and burn technique, which is a major component of shifting cultivation agricultural systems or clear cutting (Mfon, et al., 2014). It is equally used to describe clearing of forest for grazing or ranching. Extensive tropical deforestation is a relativelymodern event that gained momentum in the 20th century and particularly in the last half of the 20th century. The FAO 2001 reports indicate considerable deforestation in the world during 1990-2010 but this was almost entirely confined to tropical regions. (Chakravarty et al., 2012). Rowe et al (1992) estimated that 15 percent of the world’s forest was converted to other land uses between 1850 and 1980. Deforestation occurred at the rate of 9.2million hectares per annum from 1980-1990, 16million hectares per annum from 1990-2000 and decreased to 13million hectares per annum from 2000- 2010 (Chakravarty et al., 2012). The net change in forest area during the last decade was estimated at – 5.2milliom hectares per year or 140km2 of forest per day (Ogundele et al., 2016). The West African Guinea Rainforest (GRF) stretching from Guinea to Cameroon is a priority challenge identified more than 20 years ago as a global biodiversity hotspot (Myers, 1990; Myers et al., 2000; Conservation International 2007). Less than 18% of the original GRF still stands as dense forest (Mayaux et al., 2004) as the nutrients of the GRF have been progressively mined by millions of poor households employing rudimentary slash-and-burn technology. Paradoxically, these same households depend on stocks of wild foods, fuelwood, and traditional medicines, which are produced by the forests they cut down and burn in their agricultural practice (Gockowski and Sonwa 2010). As reported by Mutavi and Long’ora (2019), increasing population in Kenya is one of the major forms of habitat destruction causing species loss (Situma and Wamukuya, 1999). Overdependence of the population on fuel wood as the main source of energy has accelerated deforestation leading to loss of tree cover (Baan, 2003). Forests have dwindled because large tracts of terrestrial and wetland ecosystems have been converted to farmland (UNEP, 2006). Urbanization As a result of growth in human population, there is increased need for more land to live on, more building constructions, hospitals, schools, supermarkets, industries, etc. Hence, land is often cleared of vegetation to make space for such projects. Urbanization creates increasing concern about the effects of expanding town and cities. This has an adverse impact on the natural resources such as forest lands (Ibrahim, et al. 2013). The need for expansion of cities and towns results in the clearing of forest areas to meet several development needs. The expansion of some roadways has also resulted in the loss of several forest resources. Rural dwellers depend heavily on forest resources for survival and livelihood especially with fuel wood being used as the major source of energy leading a great reduction and clearing of this resource (Oyetunji et al., 2020). In Cape Town, the Cape Floristic Region (CFR), one of the World's Heritage Sites (Anon, 1999) and biodiversity Hotspots (Myers et al., 2000) is recognized as one of the world's most imperilled ecosystems and a global priority for conservation (Underwood et al., 2009). The CFR has the second highest human population growth rate in the Mediterranean Biome, after Chile (Underwood et al., 2009). Urbanization is concentrated in lowlands of the City. This high concentration of biodiversity within the urban matrix poses challenges for conservation. The Table Mountain chain which lies within the city is an area of scenic beauty and wild landscapes that challenge development and is thus well conserved. There is a high incidence of threatened species (Wood et al., 1994). The City has 18% of South Africa's threatened plant species in 0.1% of the area of the country. Thirteen plant species within the City are already globally extinct, making it one of the most acute areas in the world for plant extinction. Unless urgent action is taken as many as 85 additional plant species may become globally extinct in the next decade (Rebelo et al., 2011).
- 3. International Journal of Trend in Scientific Research and Development @ www.ijtsrd.com eISSN: 2456-6470 @ IJTSRD | Unique Paper ID – IJTSRD50142 | Volume – 6 | Issue – 4 | May-June 2022 Page 623 Bushfire and Agriculture In Ghana, current evidence according to Wuver and Attuquayefio 2006, indicates that the degradation of the wetland could be largely attributable to neglect and unsustainable human activities (e.g. bushfire setting, hunting, farming, fuelwood harvesting, estate development, etc.). Deliberate bushfires were set either by hunters (92.1%) or farmers (7.9%) clearing vegetation on land for cultivation. Dropping of cigarette butts constituted the main cause (67.9%) of the accidental bushfires, followed by palm wine tapping and on-farm cooking in that order. Most (61.5%) of the farmer-respondents set the fires once a year, usually on afternoons when high temperatures promote rapid or easy burning. Majority (92.4%) of such fire-setters attempted some form of fire control, while the rest thought it was unsafe to do so. The Millennium Ecosystem Assessment (MA) concluded that as the extensive growth of agriculture is the primary driver of habitat loss in all human- dominated landscapes, it is also the primary threat to biodiversity worldwide (Millennium Ecosystem Assessment 2005). By the close of the last century, more than two thirds of Mediterranean forests and temperate forest steppes, and more than half of all temperate broadleaf forests, tropical dry forests, grasslands, shrublands and savannas had alreadybeen converted to agriculture. While the proportion of tropical habitats converted to agriculture is lower, the rate of land conversion in tropical regions is much greater. This has two effects. On the one hand, it directly leads to the loss of the habitats displaced by crop and pasture lands (Tilman et al 1994, Tilman 1999, Deininger & Minten 2002). On the other, patchy conversion patterns lead to the fragmentation of existing forest, and hence to a reduction in the number and abundance of species that can be supported on unconverted land (Lewiset al 2009, Laurance et al 2011). A majority of the people in the least developed countries still live in rural areas, and still make a living from the exploitation of natural resources— mostly in agricultural systems. On average, 68 per cent of the population in low-income countries live and work in rural areas, relative to 43 per cent in middle-income countries and 21 per cent in high- income countries (Perrings and Halkos 2015). In the poorest countries, more than 75 per cent of the population earn a living from agriculture (Perrings and Halkos 2015). In many of these countries rural population growth rates are still positive and, in some Sub-Saharan African countries (specifically in Benin, Burkina Faso, Burundi, Eritrea, Guinea-Bissau, Mauritania and Uganda) are still increasing (World Bank 2013). The overuse of fertilizers can reduce plant biodiversity by causing eutrophication. Fertilizers contain high levels of nitrates. When they are added to the soil, a proportion of the fertilizers runoff into rivers and lakes, introducing nitrates into these aquatic ecosystems (Moore, 2020). Increased nitrate levels cause an overgrowth of the algae that live on the water’s surface, blocking out the light entering the water, and causing plants beneath the surface that rely on photosynthesis to die. Because of fertilizer use, the biodiversity of rivers and lakes is reducing (Moore, 2020). Oil Spillage Oil and gas together constitute over 90% of Nigerian foreign-exchange earnings. The Niger Delta is the main seat of oil and gas production in Nigeria. It is a fact that all aspects of oil and gas exploration and exploitation have deleterious effects on the local ecosystem and biodiversity (Ugochukwu and Ertel, 2008). Oil spillage has affected the lowland rainforest in Nigeria. The lowland rainforests in the Niger Delta zone covers around 7,400 km2 of the Niger Delta region (Ugochukwu & Ertel, 2008). However, evidence suggests that very little forest remains and only a small fraction of the remainder is significant in size or in species diversity (for example, Ebubu forest). Today, most areas in this zone are in swidden agricultural systems (for shifting cultivation), which permit only oil palms and occasional mango trees to remain) (Ugochukwu & Ertel, 2008). For example, the World Bank (1995) report suggests that Ogoniland used to be covered with rainforest but has since been largely converted to degraded bush and farmland. This zone represents the non-riverine or upland areas (coastal plains). Oil spillage has also affected the mangrove forest in Nigeria Niger Delta, an area estimated to be about 10,515 km2 mostly lining the Niger Delta coastline (Onyena and Sam, 2020). Mangroves are trees or large shrubs that have adapted to survive in harsh environmental conditions. Hence, has developed unique survival features in the face of high salinity, anaerobic and waterlogged soils, and a challenging environment for seed dispersal and propagation (Spalding et al., 2010). Mangrove ecosystems are a shelter for biological diversity consisting of diverse aquatic and terrestrial flora and fauna which include mammals (monkeys, antelopes, and manatees), molluscs (bivalves, oysters), crustaceans, fish, reptiles and avian species. Nigeria’s mangroves in terms of area covered are the largest in Africa with an estimated 10,515 km2 , mostly lining the Niger Delta coastline (Onyena and Sam, 2020).
- 4. International Journal of Trend in Scientific Research and Development @ www.ijtsrd.com eISSN: 2456-6470 @ IJTSRD | Unique Paper ID – IJTSRD50142 | Volume – 6 | Issue – 4 | May-June 2022 Page 624 The Significant amount of crude oil discharged into coastal environments has affected these mangroves which are extremely responsive to contamination by oil and industrial waste. For the past 60 years, there have been no less than 238 major oil spills adjacent to mangrove-dominated shorelines worldwide (onyena and Sam, 2020). These oil spills have accounted for over 5.5 million tonnes of oil released directly, affecting up to more or less 1.94 million ha of mangrove habitat, and have killed at least 126,000 ha of mangrove ecosystems since 1958 (Sheppard, 2000). Oil exploration in or near mangrove shorelines has significant adverse impacts, even on the marine ecosystem (US Fish and Wildlife Services, 2013). In 2004, the Nigerian Liquefied Natural Gas (NLNG) pipeline traversing the Kala-Akama and Okrika mangrove swamps (in the Niger Delta) leaked and caught fire. The fire burned uncontrollably for three days (Zabbey, 2004); local plants and animals inhabiting the affected area were killed. It must be stressed that incidents such as this one can result in the elimination of whole populations of endangered species which have restricted distribution (Ugochukwu and Ertel, 2008). Impact of Anthropogenic Activities on Fauna biodiversity Oil and gas activities Millions of people dwelling in coastal communities around the world already exist at the margins, and are often contending with converging pressures that place them in a vulnerable position to make a decent living Andrews et al., 2021). These pressures can emanate both from land and the sea, leading to a ‘coastal squeeze’ (Bulleri and Chapman, 2010; Borchert et al., 2018). For example, population increases in coastal areas, maritime and coastal space enclosures for offshore development, marine reserves for the purpose of conservation that marginalize small-scale fishers, the impacts of climate change and dwindling fish stocks in the ocean, overfishing by both small- scale and large-scale fishers, and increasing competition and conflicts over marine resources and coastal areas – including for large-scale tourism and port infrastructure – can all undermine the sustainability of resource-based livelihoods and the resilience and well-being of coastal communities (Charles 2012,Bennett et al., 2015, Belhabib et al., 2019). A study in Angola by Baumüller et al (2011) reported that most fishing in Angola’s northern province Cabinda is artisanal and has been going on for three generations or more, without any commercial value chains attached. According to the President of the Associação dos Pescadores de Cabinda (APESCAB – Association of Cabindan Fishermen representing over 1200 members in the northern province of Cabinda), the whole of the sea space around Cabinda province is negatively affected by oil production. There is little physical space for fishing already and oil production further constrains this. The fishermen complain that the bay of Cabinda no longer yields fish. Whereas in the 1950s up until the 1990s a nightly trip using about 500m of nets would have filled a fishing boat, now trips of up to five nights’ duration and much more netting is required to fill the same boat. The fishermen blame oil production for the lack of fish closer to Cabinda. They point to the destruction of underwater habitats and spawning grounds as one of the main reasons. They claim that these underwater reefs and rock structures, which are essential for breeding fish, are destroyed by the use of dispersants that make (spilled) oil that floats on the surface of the sea sink to the sea floor. They also claimed that seismic surveys have a negative impact on fish stocks and are pushing them away. Apart from impacting underwater habitats, oil spills, which theysayoccur at least once and up to four times a year, also affect fishermen by destroying their nets (Baumüller et al., 2011). In the Nigerian context, different habitats have trailed their biodiversity at an unexpected proportion ( Iheriohamma, 2016; Zabbey and UYi 2014), aquatic species and wildlife have been reported depleting and threat on plant species extinction (Anejionu et al., 2015) Overexploitation of particular species of animal Over-exploitation of a particular species or group of species can result in that species, or group of species, being driven to local or even global extinction. It differs from the other drivers of biodiversity loss because it specifically target individual species. The most well-known examples of over-exploitation of tropical forest species involve large mammals for bush-meat (Milner-Gulland et al. 2003), and tropical hardwoods for timber (Asner et al. 2005). A less well-known example is that of Chamaedorea palms (xaté) in Central America, whose leaves are harvested for the floricultural industry (Bridgewater et al. 2006). Invasive species Invasive species are non-native species that have established outside their natural range, while introduced species have been established outside their natural range by human action (Morris, 2010). Both invasive and introduced species can cause extinctions, alter abiotic environments, become pests, or introduce diseases (Bradshaw et al. 2009), particularly targeting species with a lower reproductive potential or those that are naive to competitors or predators (Purvis et
- 5. International Journal of Trend in Scientific Research and Development @ www.ijtsrd.com eISSN: 2456-6470 @ IJTSRD | Unique Paper ID – IJTSRD50142 | Volume – 6 | Issue – 4 | May-June 2022 Page 625 al. 2000). For example, the introduction of the brown snake on the island of Guam is thought to have caused the extinction of 12 of the 18 native birds (Wiles et al. 2003). Much of the evidence for the detrimental effects of invasive species is based on correlations between invasive species dominance and native species decline in degraded habitats (Didham et al. 2005). In these cases, invasive species could be driving the native species loss or could simply be taking advantage of habitat modification or another ecosystem change that is itself driving the native species loss (MacDougall & Turkington 2005). Invasive species may cause biotic homogenization, where species assemblages become dominated by a small number of widespread species that thrive in human-altered environments (McKinney & Lockwood 1999). Tropical forest communities that have been substantially altered by invasive or introduced species occur predominantly on heavily disturbed islands (Ghazoul & Sheil 2010). Intact continental rainforest may be more resistant to invasion because of the high species and functional group richness, high competitive exclusion rates and high pest loads (Denslow & DeWalt 2008). Invasive species can, however, dominate disturbed or open tropical forest areas, impacting their recovery (Ghazoul & Sheil 2010). CONTAMINATION OF WATER AND ITS SOURCES BY ANTHROPOGENIC ACTIVITIES Metal pollution of surface water and sediment Metal contaminants are considered grave pollutants because they do not decompose to simpler and less toxic substances like organic pollutants. Metals enter surface water bodies from both geogenic and anthropogenic sources, such as through weathering of underlying rocks and soils, atmospheric deposition of toxic particulate matter, and the discharge of untreated domestic and industrial effluents into the water body (Olayinka 2004). These metal additions to surface waters eventually end up being adsorbed to the sediments which become contaminated. Adsorption on sediment is one of the processes that controls bioavailability and toxicity of metals in aquatic environments (Dali-Yousef et al. 2006). Sediments can become a sink and source of metals depending on sorption/desorption processes occurring in the water. Dissolved metals can bind to solid phases in sediments, and the sediments can also release the metals under the right conditions. Some chemical properties controlling metal release in aquatic environments include pH, redox potential and organic matter. For example, dissolved zinc (Zn) in Lake Naivasha, Kenya, correlated highly with sediment pH and the pH also had a positive correlation with organic matter content, redox potential (Eh), temperature and dissolved oxygen, suggesting that dissolved Zn was probably released from organic matter-bound Zn fraction in the lake sediment (Kamau et al. 2014). Africa is blessed with natural and mineral resources, but exploitation of these resources has led to extreme pollution of the environment. Population growth and urbanization due to developments have also contributed immensely to the current pollution in Africa. Traffic emissions, transported dust and open burning are all significant contributors to air pollution in Africa. The Sahara desert is a major source of transported dust, especially during the harmattan season in West Africa. Mercury emissions are very high in South Africa due to coal combustion and gold mining. Air pollutants may contaminate water and soil through atmospheric deposition. However, the major pollution sources for surface waters are the urban and industrial discharges of untreated effluents into the water. A few African countries have standards for effluent discharge into surface waters, but it is unknown whether these standards are being enforced. Though groundwater sources in wells and boreholes are the major sources of drinking water for the African populace, the biological water quality of these groundwater sources is mostly low in the region due to close proximity to sanitary facilities. Identified sources of soil pollution in Africa include agricultural activities, mining, roadside emissions, auto-mechanic workshops, refuse dumps and e-waste. Oil spills are a major problem in oil-rich African countries such as Nigeria and Angola. Agricultural activities are the lowest impacting the soil in Africa. There is a need for proper regulation of environmental pollutants in Africa. Environmental pollution is a growing problem worldwide, but the levels of contamination are different in different parts of the world. Even though industries, automobiles, power plants, households and agricultural activities continue to emit significant amounts of air pollutants, air pollution has decreased in Europe over the last decade (Guerreiro et al. 2014). Surface waters of Europe are much cleaner today because of the Urban Waste Water Treatment Directive which aims to protect the European environment from the adverse effects of discharges of urban and industrial wastewater by ensuring adequate treatment of wastewater (EEA 2013). Water Pollution One of the main outcomes of the United Nations Conference on Sustainable Development Goals was the agreement by the Member States to launch a process to develop a set of Sustainable Development
- 6. International Journal of Trend in Scientific Research and Development @ www.ijtsrd.com eISSN: 2456-6470 @ IJTSRD | Unique Paper ID – IJTSRD50142 | Volume – 6 | Issue – 4 | May-June 2022 Page 626 Goals (SDGs). The goal 3 "Ensure healthy lives and promote well-being for all at all ages" aims at securing a healthy life for all. A measure to achieve this goal involves substantially reducing the number of deaths and illnesses from hazardous chemicals and air, water, and soil pollution and contamination. The different types of pollution common in African countries is contamination of water. Water contamination occurs when substances are introduced into water bodies beyond what the water natural purification system can handle; therebydegrading and making water unfit for human consumption and profitable use. According to Moronkola (2003), the health effects of water pollution include the following; A. It may lead to the outbreak of diseases like typhoid fever, dysentery, cholera, and gastrointestinal discomforts and infectious hepatitis can result. B. It reduces aquatic life by reducing the reproduction of fishes and by killing them as well multiplication of sea plants thereby disturbing the ecosystem balance. C. Economically, commercial fishing cannot take place in polluted water, and the cost of controlling pollution is enormous. d. Polluted water puts off those who like aquatic sorts for recreation. Poor sanitation and contaminated drinking water are two of the most common environmental hazards in many countries of the world including Nigeria. Inadequate water, sanitation, and hygiene account for a large part of the burden of illness and death in developing countries. Lack of clean water and sanitation is the second most important risk factor regarding the global burden of disease, after malnutrition. Furthermore, Industrial pollutants like mercury, chromium, cadmium, and lead are poisonous when deposited into water bodies. Theyare also capable of entering the food chains and cause diseases in man, Mercury is known to cause a disease called Minimata. Organochlorine pesticides like D.D.T. in the agricultural wastes are non-degradable and move along the food chains. It may lead to bio- magnifications. Some industrial effluents can cause changes in colour, odour, and taste of water in the natural water bodies. Contamination of water also leads to the spread of water-borne diseases such as cholera, amoebiasis and other diseases. Water pollution is a major problem in african countries. The sources are complex and include: Runoff from agricultural land, Animal wastewater (wastewater generated from animal raising, keeping, and feeding facilities), Wastewater from slaughtering activities, Leachates from dumpsites and uncontrolled landfill, Industrial effluent, Domestic wastewater, and Urban runoff. Potential pollutants from such sources are summarized in the table in Table 1. Some studies have shown significant levels and indicators of water pollution in Nigeria. For the River Delimi in Jos, mean cadmium (Cd) concentrations in the water ranged from 0.14 to 0.381 milligrams per liter (mg/L) and copper (Cu) concentrations from 0.341 to 0.371 mg/L (Sabo, Gani, & Ibrahim, 2013). Results of laboratory analysis of sediment samples collected from seven different locations along Asa River in Ilorin, the capital of Kwara State in western Nigeria, revealed levels of manganese (Mn), chromium (Cr), iron (Fe), zinc (Zn), and Cu ranging from 179.9 to 469.4; 3.0 to 11.3; 1,998.4 to 4,420.4; 26.6 to 147.6; and 1.9 to 13.3 milligrams per kilogram (mg/kg), respectively (Adekola & Eletta, 2007). Analysis of tissue samples taken from fish in the Lagos lagoon revealed concentrations of polychlorinated biphenyls (PCBs) ranging from 0.56 to 2.94 ppm (Adeyemi, Ukpo, Anyakora, & Uyimadu, 2009). At Iddo, in the Lagos area, analysis of fish tissue revealed concentrations of polycyclic aromatic hydrocarbons (PAHs) of 2,706.93 nanograms per gram (ng/g) and naphthalene 1,625.10 ng/g. In Apapa, a local government area in the city of Lagos, PCB concentrations of 23.63 ng/g were found in fish tissue. In Okobaba, in the Ebuta Metta district of the city of Lagos, p,p’-dichloro diphenyl dichloro ethylene concentrations of 1,17.98 ng/g were found in fish tissue and reported in the city of Lagos (Rose, Kehinde, & Babajide, 2013). From these results, it is obvious that, in addition to human health effects, many pollutants arising from anthropogenic activities can have great adverse impacts on aquatic ecosystems (Vörösmarty et al., 2010). Runoff from Agricultural Land Irrigation with contaminated water and the application of sewage sludge and manure onto agricultural land can be potential sources of water pollution when these materials are washed into rivers. Also, unlike the practices embraced in preindustrial
- 7. International Journal of Trend in Scientific Research and Development @ www.ijtsrd.com eISSN: 2456-6470 @ IJTSRD | Unique Paper ID – IJTSRD50142 | Volume – 6 | Issue – 4 | May-June 2022 Page 627 times, when traditional agricultural methods predominated in developing countries, the recent years have witnessed the adoption of modern technologies, including the chemical control of weeds and the application of chemical fertilizers for enhancement of soil fertility. Unfortunately, this is not without side effects, as evident from the adverse impacts on the environment and human health. Nitrate has often been used as one of the parameters indicating water pollution, and most of it comes from the runoff of excessively nitrogen-fertilized agricultural land (Savci, 2012). Diffuse water pollution from agriculture has resulted in widespread eutrophication in China (Cui, Dou, Chen, Ju, & Zhang, 2014), and this is a common phenomenon in many rivers and other water bodies in other developing countries from chemical fertilizers that are washed away by rain (Norse, 2005). This creates severe interference with aquatic ecosystems and increases treatment costs for drinking water (Smith & Siciliano, 2015). Table 1 Water Pollutants and Sources Water pollutants Sources Nitrate Surface runoff of nitrogen fertilizer on agricultural land Phosphate Surface runoff of phosphate fertilizer on agricultural land, detergents from domestic wastewater, sewage Heavy metals Mining, effluent, urban runoff, metal processing activities, etc. Pathogens Effluent, decaying plants and animals, livestock waste, sewage, etc. Persistent organic pollutants Run-off from agricultural land, effluent from chemical and pharmaceutical industries, etc. Cyanides Effluents from mining, pharmaceutical industries, chemical industries, etc. (Source: Joshua et al., 2016). Animal Facilities Wastewater These wastewaters are generated by facilities raising poultry, pigs, or other livestock and from dairy farms. Milking parlor wastes from dairy farms, dung, and urine from piggeries, poultry litter, and antibiotics contained in animal wastewater may cause serious water pollution when it enters downstream waters. This category of wastewater usually contains animal parasites, fungi spores, protozoa, bacteria, some synthetic hormones, and nitrate as well as phosphorus content from feeds and dung. Heavy metals such as copper are also potential pollutants from animal facilities wastewater. Wastewater from Slaughtering Activities A common practice in developing countries, especially African countries, is to slaughter animals close to streams where animal blood and washing water are allowed to flow into the streams. Water pollution is definitely bound to occur in such cases. Leachates From Dump sites and Uncontrolled Landfills Hazardous leachates from main dumpsites flow into the surrounding drainages. From there, a pollution gradient is initiated along streams and down into rivers. Leachates from uncontrolled landfills, which are common in developing countries, may also pollute groundwater sources. Industrial Effluent The Table 2 summarizes common industries and the relevant pollutant content of the effluents they generate. The effluents are usually channeled toward nearby rivers, and if they are not treated prior to disposal, they may result in gross pollution of water bodies. As of 2009, it was estimated that Lagos Lagoon alone absorbed 10,000 cubic meters (m3 ) of industrial effluent daily (Adewole, 2009). Domestic Wastewater This includes wastewater from kitchen, toilet, and laundry activities. Potential pollutants are oil, detergents, and decaying organic matter. Also, depending on the occupants’ lifestyles and the products used in some homes, domestic wastewater may contain cosmetics, pharmaceutical products, insecticides, and antiseptics.
- 8. International Journal of Trend in Scientific Research and Development @ www.ijtsrd.com eISSN: 2456-6470 @ IJTSRD | Unique Paper ID – IJTSRD50142 | Volume – 6 | Issue – 4 | May-June 2022 Page 628 Table 2. Categories of Industries and Pollutant Content of Effluents They Typically Generate Category of industry Pollutant content of effluent Pharmaceutical industry Heavy metals, chloroform, phenol, toluene, benzene, antibiotics, etc. Iron and steel industry Cyanides, PAHs, benzene, naphthalene, anthracene, phenols, Sn, Cr, hydraulic oil, etc. Leather tanning industry Cobalt (Co), Pb, Sb, Cr, arsenic (As), N, P, chlorinated phenols, PCBs, pesticide residues, etc. Pulp and paper industry Transition metals, Hg, chlorides, chlorates, sulfates, nitrates, chelating agents, methanol, benzene, etc Mining industry Fluorides, heavy metals, cyanides, metalloids, etc. Chemical industry Acids, bases, surfactants, emulsifiers, hydrocarbons, heavy metals, persistent organic pollutants, etc. Distilleries Heavy metals, nitrates, phosphates, sulfates, potash, microorganisms, etc. Textile industry Formaldehyde, heavy metals, chlorine, sulfur dioxide (SO2), dyes, chlorinated bleaching reagents, solvents, volatile organic compounds, phenols, BFRs, isocyanates Fertilizer industry Phosphate, nitrate, urea, zinc (Zn), iron (Fe), ash slurry, alkali, sulfate, fluorides, ammonia and ammonium salts, arsenic, methanol, cyanides. (Source: Joshua et al., 2016). Urban Runoff Several human activities can lead to the illegal disposal of various hazardous materials in liquid or solid form onto the ground. This is a common occurrence in market places and workshops. In other instances, there maybe accidental spills of hazardous liquids. During rainfall, these materials are washed down the drainages and into rivers. Air Condition as Influenced by Human Activities Particulate matter There are about 54 countries in Africa, but there are few published studies on air quality research in Africa, showing that Africa is not paying enough attention to air pollution. A large proportion (44%) of the published air quality studies in Africa were on particulate matter (PM) pollution, while 28% were on house hold air pollution (HAP), 22% on greenhouse gases (GHGs) and 6% on mercury (Hg) emissions. Particulate matter is commonly used as an indicator of air quality probably because of the harmful effects of PM on human health (Pope et al. 2002, 2008; Petkova et al. 2013; Antonel and Chowdhury 2014). Particulate matters are classified and named based on particle sizes, which are associated with different sources. The major source of PM10 (coarse fraction of PM) is dust, while the PM with smaller sizes (PM2.5) has multiple sources (Linden et al. 2012). Particulate matter may contain metals such as Pb or organic substances such as polycyclic aromatic hydrocarbons (PAHs). Manganese (Mn) and lead (Pb) concentrations in PM2.5 averaged 17 ± 27 and 77 ± 91 ng m-3, respectively, while Mn concentrations in PM10 were higher (49 ± 44 ng m-3) in South Africa. This was attributed to the use of Mn and Pb as additives to motor fuel (Batterman et al. 2011). Four PAHs, anthracene, benzo: (a) pyrene, benzo (b) fluoranthene and benzo (k) fluoranthene, were detected in PM10 from Vanderbijlpark city, South Africa. Possible sources of PAHs in the area sampled include a coal power station, oil refinery, diesel and gasoline vehicles and open burning of solid waste (Moja et al. 2014). PAHs such as benzo (a) pyrene are carcinogenic and harmful to human health; hence, air quality is an important task for public health. Table 1 shows the air quality in selected African countries as indicated by PM concentrations. All the countries had PM concentrations higher than the World Health Organization (WHO) guideline. Mali, a country in West Africa, had the highest PM2.5 (123 lgm-3 ) and PM10 (505 lgm-3 ) concentrations in Africa with maximum concentrations that were about 6–25 times greater than concentrations in China and higher than WHO guidelines (WHO 2016; Garrison et al. 2014). This was attributed to Saharan dust incursions since eroded mineral dust made up a major proportion of measured PM. West Africa is most affected by transported dust due to proximity to the Sahara desert (De Longueville et al. 2010). The Sahara desert is the world’s largest source of eolian dust, and its effect is felt mostly during the harmattan season between November and March (Goudie and Middleton 2001). Elements from the earth’s crust which were mostly abundant during harmattan accounted for 37% (55 lgm-3 ) of fine particle (PM 2.5) mass and 42% (128 lgm-3 ) of PM10 mass in a study in Ghana (Zhou et al. 2013). Outside Harmattan, biomass combustion accounted for between 19.3 and 38.7% of fine particle mass with other sources identified as sea salt, vehicle emissions, tire and brake wear, road dust, and solid waste burning (Zhou et al.
- 9. International Journal of Trend in Scientific Research and Development @ www.ijtsrd.com eISSN: 2456-6470 @ IJTSRD | Unique Paper ID – IJTSRD50142 | Volume – 6 | Issue – 4 | May-June 2022 Page 629 2013). The identified sources of PM10 in Burkina Faso, West Africa, include transported dust, re-suspended dust from unpaved roads, traffic emissions and biomass burning (Linden et al. 2012). Abu-Allaban et al. (2007) reported that major sources of PM10 in Egypt, North Africa, included geogenic sources, traffic emissions and open burning, while the main sources of PM 2.5 were vehicular emissions and open burning. Biomass burning was identified as second most important source next to soil dust in a study in Ghana, West Africa (Ofosu et al. 2013). Dust from unpaved roads is a major source of PM pollution in some parts of Africa, where a large number of the roads are either unpaved or has a broken paved surface and in need of repair. A study in Ethiopia attributed most of the geological material found in PM10 to re-suspension of road dust mostly due to the prevalence of unpaved roads (Etyemezian et al. 2005). Measurements on unpaved roads recorded higher PM 2.5 concentration in Ghana, confirming that unpaved roads are sources of PM (Arku et al. 2008). In another studyin Ghana, road surface with loose dirt had significantly higher PM2.5 and PM10 concentrations, while those with broken paved surface had higher PM10 concentrations, providing more evidence that road dust is a significant source of PM pollution in Africa (Dionisio et al. 2010). Areas with a network of unpaved roads showed the highest concentrations of suspended particles in three African cities (Dares Salaam (Tanzania), Ouagadougou (Burkina Faso), and Gaborone, (Botswana) (Eliasson et al. 2009). These studies suggest that unpaved roads do not only affect transportation but are also sources of air pollution in Africa. Some other air quality studies reported geological sources and marine environment as sources of PM in Africa (Arku et al. 2008; Rooney et al. 2012), indicating that air pollution with PM may also depend on location. Dieme et al. (2012) reported that there was a higher concentration of toxic particulate matter in urban sites relative to the rural sites in Senegal, West Africa, showing the effect of urbanization on air quality. However, the concentration of toxic PM in urban sites was dependent on traffic intensity and vehicle type. Other studies have also reported that vehicular emissions were the major source of air pollution in African cities such as Nairobi, Kenya and Warri, Nigeria (Kinney et al. 2011; Efe and Efe 2008). Motor vehicle traffic is an important source of particulate matter in developing countries, where economic growth has resulted in increasing vehicle ownership and traffic congestion (Kinneyet al. 2011). Vehicle components such as vehicle exhausts, lubricating oils, tyres and plating materials may be responsible for the emissions (Odiyo et al. 2005). Vehicle emissions are a major source of air pollution in developing countries despite the improvement in emission rates by auto manufacturers because a large proportion are old, poorly maintained and still use two-stroke engines (Assamoi and Liousse 2010; Linden et al. 2012). This has led to contamination of roadside soils, especially on busy highways. Extensive work has been done to characterize roadside soils in Africa. This will be discussed in more detail later in the paper. Apart from Mali, China had higher PM than countries in Africa, due to the high rate of industrialization in the country (Cao et al. 2013). Nevertheless, PM2.5 and PM10 concentrations in some African countries were higher than that of developed countries such as Sweden and USA. Although Sweden and USA had PM 2.5 concentrations that were much lower than WHO standards, PM 10 concentration for Sweden and USA was higher than WHO guidelines, showing that developed countries also have work to do to ensure air quality (Ferm and Sjoberg 2015; USEPA 2015). Table 3 Air pollution in Africa Location Particulate matter (PM) concentration (lgm-3 ) References PM-2.5 PM-10 Burkina Faso NA 35.4-162 Linden et al. (2012) Cameroon 49-67 65-141 Antonel and Chowdhury (2014) South Africa 113 124 ESMAP (2011) Kenya 10.7-98.1 NA Kinney et al. (2011) Mali 8-123 35-505 Garrison et al. (2014) Nigeria NA 126-151 Efe and Efe (2008) Egypt 51 NA Boman et al. (2013) Tanzania NA 16.9 Mmari et al. (2013) Senegal 16.9-105 NA Dieme et al. (2012) Zimbabwe 40.5 59.7 Kuvarega and Taru (2008) China 212 406 Xie et al. (2010), Wang et al. (2007) Sweden 7 21 Ferm and Sjoberg (2015) USA 8.5 52 USEPA (2015a) WHO guideline 10 20 WHO (2016), Karagulian et al. (2015) (Source: Fayiga et al. 2017)
- 10. International Journal of Trend in Scientific Research and Development @ www.ijtsrd.com eISSN: 2456-6470 @ IJTSRD | Unique Paper ID – IJTSRD50142 | Volume – 6 | Issue – 4 | May-June 2022 Page 630 Air Pollution Air pollution is of great concern because it has transboundary effects. Some anthropogenic activities, such as the burning of kerosene, fuelwood, and waste as sources of energy, are still common in developing countries (Akinlo, 2009; Maconachie, Tanko, & Zakariya, 2009), and these fuels release dangerous gases and particulates into the air. It is known that biomass burning results in the production of air pollutants, such as carbon monoxide, hydrocarbons, oxygenated organics, free radicals, chlorinated organics, and particulate matter (Fullerton, Bruce, & Gordon, 2008). These pollutants and their sources are broadly summarized in the table in Table 3. Indoor Household Fuel Burning Globally, close to three billion people rely on biomass, such as wood, charcoal, crop residues and dung, as well as coal as their primary sources of domestic energy. More than 50% of domestic energy use in many developing countries is generated by the burning of biomass (Ezzati & Kammen, 2002b), and the percentage increases to approximately about 95% in lower income countries (Fullerton et al., 2008; Smith, Mehta, & Maeusezahl- Feuz,2004). This is still very true today, especially in developing countries. In Nigeria, fuelwood, charcoal, and agro waste (e.g., palm fruit fiber, palm kernel shell) are the main fuel sources in villages; in towns, the sources include fuelwood, charcoal, and kerosene (and in some instances, plastic wastes); in cities, the sources are fuelwood (usually at local food cafeterias), charcoal, and gas. What is common to these fuel sources is inefficient burning. Consequently, gaseous and/or particulate pollutants, which have serious impacts on human health, are released during combustion. Outdoor Air Pollution These include gaseous emissions from industries, automobile exhaust, electrical generating plant exhaust, emissions from the incineration of wastes, and gaseous emissions from dumpsites. Peculiar to industries in Nigeria are exhausts from internal combustion engines and particulates from milling activities. In addition, the amount of particulate emission from cement production and quarrying is immense. Significant contributions to outdoor air pollution also come from automobile exhaust. In the past decade, developing countries, Nigeria in particular, have witnessed mass importation of second-hand motor vehicles. In addition, motor vehicles in Nigeria are used for prolonged periods of time— often for more than 30 years. Some first and second generations of motor vehicle brands are still found on the road. Many of these are “smoking” vehicles, so-called because of their profuse emissions. Some motorcycles and tricycles fall into this “smoking” category, as well. Furthermore, impurities in fuels may lead to the emission of hazardous gases. Another source of air pollution is the small, electrical generating plant or generator. Because of inadequate and/or irregular power supply, almost every household in Nigeria now owns at least one power generator, in addition to those in operation at business centers. This dependence on small, household generating plants for electricity is on the increase (Akinlo, 2009), a trend that has great implications for air quality. Emissions from the thermal treatment (combustion) of wastes are also significant, and emissions from such sources may sometimes constitute more hazards to human health than most of the other sources. A common solid waste disposal option in developing countries is open burning, whether at dumpsites, in backyards, or along roadsides. Concerns regarding such activities grow ever more intense because, as we have discussed, solid wastes in countries like Nigeria are not usually separated. Hazardous waste may therefore find its way into the combustion stream and release dioxins and furans in gas or particulate phases along with other gases or particulate matter. Also in this category is the burning of vehicle tires. “Area boys,” as many gang members and petty criminals are known as in Nigeria, burn tires to block roads; and some uninformed people use tires as a fuel source to destroy unwanted trees. For others, burning tires is a quick way of recovering the metallic wires inside them. The scene of a tire fire is a pool of thick black smoke that spirals into the sky or is diffused by the wind into residential areas. Furthermore, the gaseous emissions from dumpsites usually go unnoticed. These include foul odors and hydrocarbons, such as methane. Air-borne pathogens mayevolve from dumpsites and improper landfills. Sudden ignition may also arise as a result of the presence of methane emissions.
- 11. International Journal of Trend in Scientific Research and Development @ www.ijtsrd.com eISSN: 2456-6470 @ IJTSRD | Unique Paper ID – IJTSRD50142 | Volume – 6 | Issue – 4 | May-June 2022 Page 631 Table 4 Air Pollutants and Sources Air pollutants Sources Dioxins and furans Combustion of BFR-containing wastes Carbon monoxide Second-hand smoke (tobacco), automobile exhausts, emission from power generating plants, use of kerosene stoves, emission from gas stoves, incomplete burning of fossil fuels and biomass, etc. Radioactive substances Nuclear power Particulate matter Wind-blown dusts, bush burning, flour milling, burning of fossil fuels and biomass, use of traditional stove, second-hand smoke (tobacco), agricultural practices, construction and demolition activities, emission from industrial activities, quarrying activities, cement manufacturing, natural sources, such as volcanic eruptions; etc. Sulfur dioxide (SO2) Burning fossil fuels, emission from power generating plants, etc. Nitrogen oxides (NOx) Emissions from excessive use of chemical fertilizer; burning fossil fuels; etc. Hydrocarbons Large livestock farms, oil refineries, petrochemical industries, in-household fuel burning, gas flaring, etc. Pesticides Spraying of pesticides Foul odors and air- borne pathogens Decaying animals, exposed pit toilets, dumpsites, uncontrolled landfills, sewage, etc. (Source: Joshua et al., 2016). Levels of Various Gaseous Emissions of Concern in Nigeria Gaseous and other emissions of environmental concern include nitrogen oxides (NOx), sulfur oxides (SOx), carbon monoxide (CO), and particulate matter. As previously discussed, these materials are emitted throughout Nigeria from a wide variety of sources. The emission of greenhouse gases can also result from the excessive use of fertilizers (Liu et al., 2011). Recently, several studies conducted throughout Nigeria have shown levels of a wide varietyof air pollutants that signal danger to human health and the environment. Dibofori-Orji and Braide (2013) reported the concentrations of NOx, 0.73 milligram per cubic meter (mg/m3) (730 micrograms per cubic meter [μg/m3 ]); SOx, 0.11 mg/m 3 (110 μg/m3 ); and CO emissions 0.67 mg/m3 from a point source from combusting vehicle tires in an abattoir environment. On some busy roads in the city of Jos, located in the “Middle Belt” of Nigeria, (Ola, Salami, & Ihom, 2013), the concentration of CO ranged from 6 to 110 parts per million (ppm) (7.40–136 mg/m3 ); hydrogen sulfide (H2S), 1.0–3.6 ppm; and particulate matter, 0.1– 0.6 mg/m3 . In Calabar, the levels of CO, nitrogen dioxide (NO2), SO2, and particulate matter levels from vehicular emissions were reported as 3.3–8.7 ppm (4.07–10.7 mg/m3 ), 0.02–0.09 ppm (40.5–182 μg/m3), 0.04– 0.15 ppm (113–423 μg/m3 ), and 170– 260 μg/m3 , respectively (Aba & Unachukwu, 2009). Carbon monoxide emission from trucks, generators (diesel), and in-household fuel burning (firewood) in Lagos showed concentrations of 289.64 ppm (357.2 mg/m3 ), 116.23 ppm (143.3 mg/m3 ), and 5.75 ppm (7.092 mg/m3 ), respectively (Akinyemi & Usikalu, 2013). In some areas of Lagos with high traffic (Uhuegbu, 2013), CO levels ranged from 45 to 835 ppm (55.5– 1,030 mg/m3 ). In Abuja, which is located in the center of the country, ambient CO emissions were greater than 40ppm(49.3mg/m3 ) (Okobia, 2015). In Port Harcourt, the capital of the Rivers State of Nigeria in the Niger Delta, roadside air pollution was reported as CO, 0–60.24 ppm (0–74.30 mg/m3 ); NOx, 0–1.5 ppm (0–3,040 μg /m 3 ); SOx, 0–0.75 ppm(0–2,120μg/m3 ); and particulate matter, 26–199 μg/m3 (Zagha & Nwaogazie, 2015). For example, Out of 17 Nigerian cities, 70% of these cities (i.e., approximately 10 cities) experienced a mean/annual particulate concentration of 120 μg/m3 , while 30% of the cities (i.e., 7 cities) experienced a mean/annual particulate concentration of 119.2 μg/m3. The European Union (EU) air quality standards (European Commission, 2016) are CO (10 mg/m3 ), SO2 (350 μg/m3 ), particulate matter (PM10) (50μg/m3 ), fine particles (PM2.5) (25μg/m3 ), and NO2 (200 μg/m3 ). Some levels of CO reported for certain locations in Nigeria exceeded the EU standards byfactorsof10–20. This is alarming and calls for both local and global concern to safeguard environmental and human health; especially, considering that some of these levels reported were in-household concentrations, where the probability of human exposure is extremely high. The levels of SOx reported seemed to be within the range of EU standard; however,
- 12. International Journal of Trend in Scientific Research and Development @ www.ijtsrd.com eISSN: 2456-6470 @ IJTSRD | Unique Paper ID – IJTSRD50142 | Volume – 6 | Issue – 4 | May-June 2022 Page 632 some values exceeding 400 and even 2,000 μg/m3 were also reported. NOx and particulate matter also followed the same trend. IMPACTS OF LAND USE AND ITS CHANGES ON PLANTS AND ANIMAL SPECIES BIODIVERSITY Africa is immensely rich in biodiversity (World Resources Institute 2007). Africa boasts of two out of the five global higher biodiversity areas and nine biodiversity hotspots. Also, it comprises about a quarter of the global biodiversity and it supports the earth’s largest intact assemblages of large mammals, which wander freely in many countries. Africa’s rich biomes spread across mangroves, deserts, Mediterranean, tropical forests, temperate, sub-tropical and montane grasslands and savannahs, including ice-capped mountains. Biodiversity in Africa is under threat from multiple stressors particularly the effects of climate change. Other threats include population growth, increasing land-use conversion and subsequent destruction of habitat and the introduction of exotic (non-native) species. Land-use change from natural habitat to agrarian, pastoral and logging purposes may lead to habitat loss, fragmentation, and emergence of exotic species all of which adversely impact biodiversity. Given this quantum of stress factors on biodiversity, land-use change may exacerbate the stress on environmental systems beyond recovery. These pressures affect the structure of local ecological communities and can cause local extinctions of species, which in turn can lead to reduced ecosystem functionality (Tilman et al 2001) and global extinction (Vie et al 2009). Population growth and evolving consumption patterns would likely result to intensified land use changes which may lead continued loss of habitat in future (Hurtt et al 2011). The population of Africa surpassed one billion people in 2009 and is set to grow at 2.3 per cent every year during 2010-2015 (World Bank 2011). This has led to a growing demand for natural resources, resulting in land use change and the unsustainable use of species. These changes place great pressure on natural areas, biodiversity and ecosystem service provision from natural habitats. We rely on plants for food, medicines, crop protection, and materials for clothing and building. Theyalso provide ecological services, cleaning our air, water and soil. Land-use change originating mostly from agricultural purposes, are currently the most common pressures on biodiversity (Vie et al 2009). The decline in natural habitat, driven mainly by farming expansion and intensification, is perhaps the greatest immediate danger to biodiversity. Tropical forests are home to some of the highest levels of terrestrial species diversity and are likely to witness speedy land-use change in the coming decades (Smith et al 2010). Mechanized farming can easily lead to conversion of large natural areas into small number of cultivated plants and domesticated animals. In fact, the majority of the world’s agricultural landscapes are planted with some 12 species of grain crops, 23 vegetable crop species, and about 35 fruit and nut crop species (Fowler and Mooney, 1990). Over three million hectares of natural habitat are converted for other uses each year in Africa. Deforestation is mainly driven by peasant and commercial farming, timber extraction, growing biofuel plantations and urban development (UNEP 2012). Nonetheless, there are good examples of where forest loss has reduced, like in the Congo Basin, as a result of network of protected areas and the reductions in commercial agriculture by the Central African countries that are members of the Central African Forest Commission. While modern agriculturists tend to fight weed which may lead to bush burning or application of chemicals, weeds are important to biodiversity of an ecosystem. Also weeds can positivelyaffect the ecology and dynamics of helpful insects, and offer many important requisites for natural enemies such as alternative prey/hosts, pollen, or nectar as well as microhabitats that are not available in weed-free monocultures (Altieri and Letourneau, 1984). Certain weed control measures may affect the ecology of insects and animals within the ecosystem thereby impacting the biodiversity adversely. In terms of tropical forests, Africa harbours the second largest bloc of rainforest after Amazonia, and it represents more than fifteen percent (180 million hectares) of the world’s tropical forests. Recent analysis based on remotely sensed data (Hansen et al.2013) shows that the total area of forest lost in Africa has been increasing over the recent decade, with a jump in deforestation in the period 2012-2013. Between 2001 and 2013 annual average tree cover loss for the African region was 0.2 per cent and 2.57 per cent of the total forest cover was lost during this period. Annual rates of forest loss were particularly high in 2009 (0.26 per cent) and 2013 (0.31 per cent) while 2003 had the lowest deforestation rate over the period (0.12 per cent). These forest losses are in line with forest loss rates reported by African countries to FAO which suggest a ten per cent loss in forest cover between 1990 and 2010 (FAO 2012). The recent increase in forest loss seems to be mainly in tropical moist forests rather than the seasonally dry savannah woodlands. Major causes of deforestation and forest degradation
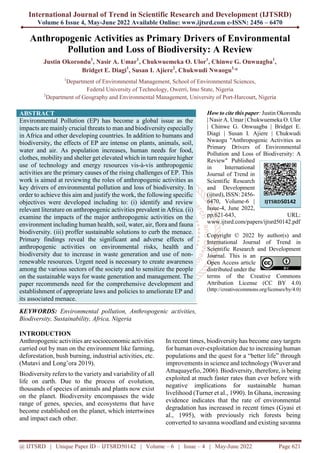
- 13. International Journal of Trend in Scientific Research and Development @ www.ijtsrd.com eISSN: 2456-6470 @ IJTSRD | Unique Paper ID – IJTSRD50142 | Volume – 6 | Issue – 4 | May-June 2022 Page 633 come from slash and burn agriculture, timber extraction, urbanization, illegal forest exploitation, charcoal production, fire wood use, climate change and other human activities. In addition to terrestrial forests, Africa contains 21 per cent of the world’s mangroves and seventeen mangrove species. Not only are mangroves important habitat for a range of species, they also function as important nurseries for many fish species. For example, Nigeria’s mangrove forests provide breeding grounds for more than 60 per cent of the fish caught between the Gulf of Guinea and Angola (Carrere 2009). Local populations also heavily depend on mangroves for fish, fuel wood and as a buffer against coastal flooding (TEEB 2014). For example in Liberia, nearly 58 per cent of the population lives within 40 miles of the coast, dotted with mangroves and other forests (TEEB 2014). Despite their global and local importance African mangroves are among the most threatened ecosystems in the continent. Declines in mangrove extent across Africa from 2000 to 2010 are around 572,200 ha. In West and central Africa, some 20 – 30 per cent of the mangroves have been lost in the past 25 years (Figure1.0). Figure 1 Mangrove Area in West Africa by Country 1975, 2000, and 2013 (https://eros.usgs.gov) Forest fire causes loss of forest resources too; it may also decrease both the quantity and quality of biological natural resources along with the ecosystem which serves the function of supporting life. This, in effect, would decrease the diversity of flora and fauna as the sources of germplasm, quality of soil, change in forest hydrological function as well as global warming. (Agus et al, 2019). The forest fire during the dry season might be triggered by natural occurrences such as dried branches and leaves which are unintentionally burned by human. Some major causal factors of the fire related to human are burning practice to clear the land for agricultural purposes, land drainage, logging, human recreation activities such as camping and excursion, hunting and fishing, especially electrical fishing (Abdullah et al. 2002). The forest fire in Africa is caused by land clearing for agricultural use and hunting of animals. The forest fires may have either direct or indirect impact on top soil. The direct impacts of the fire are, among others, the loss of the upper layers of soil (Jaya et al. 2000), the decline in the biodiversity, the environmental degradation, and the deteriorating of health condition of living organism in the surrounding areas affected by the fire (Musa and Parlan 2002). Degradation of forest ecosystem may result to the loss function of hydrology, biogeochemical, biodiversity and ecology. This is because swamp forest represents flood buffering space, water reservoir during dry season, filtering system of water quality, and habitat of various germplasm. Forests area play an important role as producer of woods, food stuffs, and living and breeding environment of soil biota as well as various life supporting systems (Barchia 2006). The Problem Transformation of habitats for human land use is causing consistent reductions in species richness and changes in abundance, altering ecological communities in tropical and sub-tropical forests around the world. Human- dominated habitats have fewer species than natural habitats. The results add to a growing body of evidence that humans are causing fundamental changes to community structure. (Newbold T et al. 2014).
- 14. International Journal of Trend in Scientific Research and Development @ www.ijtsrd.com eISSN: 2456-6470 @ IJTSRD | Unique Paper ID – IJTSRD50142 | Volume – 6 | Issue – 4 | May-June 2022 Page 634 A growing number of scientists, farmers, and private citizens fear for the long term sustainability of ecologically simplified and highly input-dependent food production systems. Questions are being raised about the loss of biodiversity, the loss of productive capacity through soil erosion, the growing dependence of modern agriculture on non-renewable resources, the heavy reliance on chemical fertilizers and pesticides, and the vulnerability of large-scale monocultures to climate change and pest-disease outbreaks. These concerns have gained renewed attention with the expansion of transgenic crops and agrofuel plantations which, by 2007, covered 115 million hectares worldwide—mostly with monocultures of soybean and maize (Altieri, 2007). The expansion of these technologies into African countries may not be wise or desirable, especially if the promotion of these monocultures results in serious social and environmental problems. These countries are rich in agricultural diversity; traditional and small farmers have historically used mixed farming systems with high degrees of plant diversity, in the form of polycultures, agroforestry, and animal integration patterns, providing a strong ecological foundation to sustain small farm productivity and to design agroecological models that benefit the rural poor under varying climatic conditions and marginal environments (Altieri, 1995). Furthermore, large numbers of farmers in developing countries have limited access to the synthetic inputs that substitute for ecological services in intensified agricultural systems and may particularly benefit from the maintenance and enhancement of biodiversity (Francis, 1986). Unsustainable harvesting of fish and inappropriate fishing methods, as well as wetland drainage for agriculture is putting increasing pressure on African freshwater systems. Other major, albeit localized, threats to inland water ecosystems include water pollution from excess nutrients, domestic and industrial organic loads, pesticides and heavy metals, and the impacts of invasive species. These pressures are resulting in biodiversity degradation in freshwater ecosystems, especially in East Africa’s Lake Victoria, the Mediterranean and Atlantic coasts of Morocco, and many major African rivers (Darwall et al. 2011). In Africa with more species becoming threatened and populations of many species are still declining. In particular there is considerable pressure on some of the iconic species in Africa: elephants and rhinos, gorillas and chimps, lions and other predators. Much of this pressure comes from the illegal trade in wildlife for various uses: ivory for carvings, rhino horns and lion bones for Asian medicines, chimps and gorillas for pets and for food, etc. This crisis is affecting populations of many species and is posing a very significant conservation challenge. For populations of African vertebrate species overall, the Living Planet Index, show that abundance in the region has fallen by 65% on average between 1970 and 2016 (Figure 2). Invasive species and disease pose a big threat, alongside overexploitation - particularly of fish and mammals; over 35% of the monitored populations for these two groups have declined. However, in recent years, the rate of decline has slowed. The major cause of species declines in Africa is the loss of habitat. In addition to habitat loss, the other main threat to African species is human use, which includes many different subsistence uses (for example timber, firewood, medicines, and bushmeat). For the larger charismatic mammals in Africa, one of the major causes of population decline is wildlife crime. For example in 2013, over 20,000 African elephants were poached across the continent, and between 2007 and 2013 there was a 7,000 per cent increase in rhino poaching (CITES 2016). A specific example of the challenges caused by wildlife crime is a case from the Central African Republic where an armed militia entered the Sangha Trinational Park and killed at least 26 elephants in April 2013 (Scanlon 2013). Figure 2. The global LPI shows a 68% average decline between 1970 and 2016. The white line shows the index values and the shaded areas represent the 95% confidence limits surrounding the trend (WWF/ZSL 2020)
- 15. International Journal of Trend in Scientific Research and Development @ www.ijtsrd.com eISSN: 2456-6470 @ IJTSRD | Unique Paper ID – IJTSRD50142 | Volume – 6 | Issue – 4 | May-June 2022 Page 635 At the regional level, a number of transboundary conservation measures have been carried out by African countries to assist with the conservation of large mammals. For example, Nigeria and Cameroon developed a Regional Action Plan for the Conservation of the Cross River Gorilla (Gorilla diehli) (2014- 2019), which was adopted at the first Meeting of Parties to the Gorilla Agreement under the CMS. This Action Plan aims to address the continuing loss of these gorillas whose population is only 300 individuals (Dunn et al. 2014). Actions included as part of the plan are increasing the budget for law enforcement, and the training and deployment of eco-guards. The action plan also produced a habitat analysis, published in 2012, which mapped the distribution of forest and other terrain in the Cross River region and combined this with other environmental data to determine the extent of the gorilla’s habitat. Scientists from the Wildlife Conservation Society (WCS), the North Carolina Zoo, Cameroon and Nigeria used satellite images, geographic information systems, global positioning systems, CyberTracker software and touch-screen systems for park rangers to develop precise location mapping and on-site data recording. Using these technologies, it was discovered that the Cross River Gorilla roams more than 50 per cent than previouslythought (Global Spatial Data Infrastructure 2012). The analysis concluded that considerable forest habitat remains and much larger gorilla population can be supported if these areas are well protected (Wildlife Conservation Society 2012). Invasive alien species are one of the main direct drivers of biodiversity loss at the global level. In some ecosystems, such as many island ecosystems, invasive alien species are the leading cause of biodiversity decline. Invasive alien species primarily affect biodiversity by preying on native species or competing with them for resources. In addition to their environmental impacts, invasive alien species can pose a threat to food security, human health and economic development. Increasing levels of travel, trade, and tourism have facilitated the movement of species beyond natural biogeographical barriers by creating new pathways for their introduction. As globalization continues to rise, the occurrence of invasive alien species is likely to increase unless additional measures are taken (CBD 2016). Invasive alien species (IAS) are a major threat to biological diversity, food and water security and human, plant and animal health. Terrestrial and freshwater ecosystems, estuarine and marine systems are severely impacted by their spread. Across Africa nearly all countries are affected by IAS while offshore islands are particularly badly affected. A number of African counties have programmes in place to manage IAS; for example, South Africa, Ethiopia, Malawi, Mali, Niger, Rwanda, South Africa and Uganda. Burkina Faso has established species lists, Egypt and Benin have allocated resources to study IAS and Sierra Leone, Somalia, Sudan and Swaziland have implemented programs to raise awareness on the effects of IAS. IAS are increasing in numbers and severity of impact in Africa and have the potential to become a significant challenge across the region. The Global Register of Introduced and Invasive Species (GRIIS), an on-going initiative hosted by the Invasive Species Specialist Group (ISSG) to document IAS, indicates that 100 of the 154 introduced species in Seychelles are known invasive species with documented impacts. Similarly in Cameroon, 148 introduced species have been identified and this includes eight species with known major impacts on biodiversity (ISSG 2014). Many of these IAS are on a list of the 100 of the World's Worst Invasive Alien Species, a global list of those IAS with the highest impacts on biodiversity, generated by the Invasive Species Specialist Group of the IUCN (Lowe et al. 2000). Species on this list include water hyacinth (Eichhornia crassipes), the wide-spread invasive shrub Lantana (Lantana camara), the fast growing leguminous (nitrogen- fixing) tree Black wattle (Acacia mearnsii) and the dryland trees and shrubs of the genus Prosopis (the “mesquites” of tropical dryland America). THE SOLUTION There are many examples of success and innovation in the conservation of Africa’s biodiversity, yet Africa is also experiencing unprecedented rates of population growth, urbanization and agricultural development, which create immense challenges in reconciling human well-being with environmental and economic prosperity (UNEP 2016). Smallholder farmers are the guardians, as well as the beneficiaries, of a greater diversity of biological species than can be found in protected areas. The farmers' diverse practices are conserving these species for the benefit of future generations. In turn, agricultural biodiversity is a primary way for the poor to cope with difficult biophysical environments and precarious social and political circumstances. [Kaihura & Stocking, 2003]. Most practitioners and supporters of organic agriculture believe that organic farms have positive impacts on biodiversity, and that farmland under organic agriculture does not exhibit the same dramatic decline in biodiversity that occurs in conventional agricultural farmland. These biodiversity benefits are likely to derive from the specific environmental features and management practices employed within organic systems, which are
- 16. International Journal of Trend in Scientific Research and Development @ www.ijtsrd.com eISSN: 2456-6470 @ IJTSRD | Unique Paper ID – IJTSRD50142 | Volume – 6 | Issue – 4 | May-June 2022 Page 636 either absent or rarely utilized in the majority of conventional systems (Lampkin, 1992). The use of biological and management practices by organic farmers to manage fertility and pests, such as green manuring, composting, intercropping, and rotation, encourage habitat heterogeneity and floral diversity. These are known to benefit invertebrate and vertebrate biodiversity across a range of taxa. A conspicuous feature of traditional farming systems is the degree of plant diversity in the form of polycultures and/or agroforestry patterns (Altieri, 2000). Traditional cropping systems are also genetically diverse, containing numerous varieties of domesticated crop species as well as their wild relatives. Maintaining genetic diversity appears to be of even greater importance as land becomes more marginal and hence farming more risky. For example in Peru, where farmers plant up to 50 varieties of potato, the number of potato varieties cultivated increases with the altitude of the land farmed. Genetic diversity confers at least partial resistance to diseases that are specific to particular strains of crops and allows farmers to exploit different soil types and microclimates for a variety of nutritional and other uses (Brush, 2003). IAS eradications from islands represent an important action to contribute to Aichi Biodiversity Target 9. Within Africa, the majority of successful eradications have been undertaken on the island nations and territories in the Indian Ocean, including the Seychelles and Mauritius (Beaver and Mougal 2009). Well-governed and effectively managed protected areas are a proven method for safeguarding both habitats and populations of species and for delivering important ecosystem services. Particular emphasis is needed to protect critical ecosystems such as tropical coral reefs, sea-grass beds, deep-water cold coral reefs, seamounts, tropical forests, peat lands, freshwater ecosystems and coastal wetlands. Additionally, there is a need for increased attention to the representivity, connectivity and management effectiveness of protected areas (CBD 2016). Protected areas are a key strategy for conserving biodiversity (Geldmann et al. 2013). Africa has long been at the forefront of global efforts to develop protected area networks, including some of the world’s best known protected areas, for example the Serengeti and Mt Kilimanjaro National Parks in Tanzania and the Kruger National Park in South Africa. By August 2014, the World Database on Protected Areas included 8571 protected areas in the 58 African countries and territories (IUCN and UNEP-WCMC 2020). Protected area coverage in Africa has been increasing steadily since 1990. In 2014, 13.8 per cent of terrestrial and inland waters and 3.7 per cent of marine and coastal areas were covered by protected areas. This is below the global average of protected area coverage, which is at 15.4 per cent for land and 8.4 per cent for marine and coastal areas (Juffe-Bignoli et al. 2014) and below the coverage levels set in Aichi Biodiversity Target 11. Some countries and overseas territories have more than one third of their area covered by protected areas: Reunion Islands (76.3%), Seychelles (42.1%), Morocco (33.6%), Namibia (37.9%), Zambia (37.9%), Congo (35.2%), and Tanzania (32%). While progress in protected area coverage in Africa is positive, the protected area coverage of inland waters is not well known (UNEPWCMC 2014). CONCLUSION Diversification strategies lead to the establishment of the desired type of plant, insect and soil biodiversity and the ecological infrastructure necessary for attaining optimal pest control and soil fertility. This is important to ensure that above ground diversification schemes are complemented by soil organic management, as both above and below ground biodiversity together form the pillars of agroecosystem health. The community of soil organisms incorporates plant and animal residues and wastes into the soil and digests them, creating soil humus, which is a vital constituent for good physical and chemical soil conditions, and the recycling of carbon and mineral nutrients. This decomposition process includes the release of carbon dioxide to the atmosphere where it can be recycled through higher plants, and the release of essential plant nutrients in inorganic forms that can be absorbed by plants. Also, since the microbial biomass itself is a relatively labile fraction of the soil organic matter, nutrients in the biomass become available as live microbes digest dead microbial cells. There is evidence that soil microbial diversityconfers protection against soil borne disease, but crop and soil type and management also play a role. Studies show that mycorrhizal diversity positively contributes to nutrient and, possibly, water use efficiency. The effects of soil fauna on nutrient and water use efficiencies are also apparent, but diversity effects may be indirect, through effects on soil structure (Giller et al, 1997). Given the ecological services provided by soil biodiversity, soil organisms are crucial for the sustainability of agroecosystems. Therefore, it is important to define and encourage agricultural practices that increase the abundance and diversity of soil organisms by enhancing habitat conditions, soil organic matter content and resource availability, and
- 17. International Journal of Trend in Scientific Research and Development @ www.ijtsrd.com eISSN: 2456-6470 @ IJTSRD | Unique Paper ID – IJTSRD50142 | Volume – 6 | Issue – 4 | May-June 2022 Page 637 to avoid practices that reduce soil biodiversity. Sustained agricultural productivitymaydepend on the selection of management practices that enhance soil biological function in the fixation of atmospheric nitrogen, recycling of carbon and nutrients, and suppression of soil pathogens. Global trends suggest that people are aware of biodiversity values, but do not “view biodiversity protection as an important contribution to human wellbeing” (Leadley et al. 2014). Information in the fifth national reports to the Convention on Biological Diversity (CBD) suggest that about 75 per cent of reporting Parties are making some progress towards this target. For example some countries have policies in place to raise awareness, while others are integrating biodiversity education into school curricula. While progress has been made in raising people’s awareness of the values of biodiversitythere has been less progress in raising their awareness of the actions they can take to conserve and sustainably use biodiversity (CBD 2015). Therefore, while there has been progress towards meeting this target overall, efforts will need to be increased if the rich biodiversity in Africa would be sustained. The increasing demand for food, fibre and fuel will lead to increasing losses of biodiversity and ecosystem services if issues related to sustainable management are not addressed. On the other hand, sustainable management not only contributes to biodiversity conservation but can also deliver benefits to production systems in terms of services such as soil fertility, erosion control, enhanced pollination and reduced pest outbreaks, as well as contributing to the well-being and sustainable livelihoods of local communities engaged in the management of local natural resources. (CBD 2016). The fifth national reports to the CBD suggest that in general, unsustainable agriculture, aquaculture and forestry are the main pressures on biodiversityin Africa. However a number of countries are taking action to address this. Among the specific actions noted in the fifth national reports are the promotion of community based conservation agriculture (Swaziland) and organic farming (Egypt), and the setting of guidelines for sustainable practices (South Africa). Similarly in Burundi, Uganda, Sierra Leone and the Seychelles, policies promoting sustainable forestry are in place and in Malawi, reforestation practices include national tree planting days (CBD 2015). REFERENCES [1] Abam, F. I., & Unachukwu, G. O. (2009). Vehicularemissions and air quality standards in Nigeria. European Journal of Scientific Research, 34(4), 550–560. [2] Abdullah MJ, Ibrahim MR, & Abdul AR. (2002). The influence of forest fire in Peninsular Malaysia: history, root causes, prevention, and control. Makalah disajikan pada workshop on prevention and control of fire in Peatlands. 19–21 Mar 2002, Kuala Lumpur, Malaysia. [3] Abu-Allaban, M., Lowenthal, D. H., Gertler, A. W., & Labib, M. (2007). Sources of PM10 and PM2. 5 in Cairo’s ambient air. Environmental Monitoring and Assessment, 133(1–3), 417– 425. [4] Adekola, F. A., & Eletta, O. A. A. (2007). A study of heavy metal pollution of Asa River, Ilorin, Nigeria: Trace metal monitoring and geochemistry. Environmental Monitoring and Assessment, 125(1–3), 157–163. doi 10.1007/s10661-006-9248-z [5] Adewole, A. T. (2009). Waste management towards sustainable development in Nigeria: A case study of Lagos state. International NGO Journal, 4(4), 173–179. [6] Adeyemi, D., Ukpo, G., Anyakora, C., & Uyimadu, J. (2009). Polychlorinated biphenyl in fish samples from Lagoslagoon, Nigeria. African Journal of Biotechnology, 8(12), 2811– 2815. [7] Agus C., Azmi F. F, Widiyatno, Ilfana Z. R., Wulandari D., Rachmanadi D., Harun M. K. & Yuwati T. W. (2019). The Impact of Forest Fire on the Biodiversity and the Soil Characteristics of Tropical Peatland. Handbook of Climate Change and Biodiversity Climate Change by Walter Leal Filho, Jelena Barbir & Richard Preziosi. Springer. [8] Akinlo, A. E. (2009). Electricity consumption and economic growth in Nigeria: Evidence from cointegration and co-feature analysis. Journal of Policy Modeling, 31(5), 681–693 http://dx.doi.org/10.1016/j.jpolmod.2009.03.00 4. [9] Akinyemi, M. L., & Usikalu, M. R. (2013). Investigation of carbon monoxide concentration from anthropogenic sources in Lagos, Nigeria. International Journal of Physical Sciences, 8(21), 1128–1132. doi: 10.5897/IJPS12.661 [10] Altieri, M. A. (1994). Biodiversity and Pest Management in Agroecosystems, Haworth Press, New York, NY. [11] Altieri, M. A. (1995). Agroecology: The Science of Sustainable Agriculture, Westview Press, Boulder, CO.
- 18. International Journal of Trend in Scientific Research and Development @ www.ijtsrd.com eISSN: 2456-6470 @ IJTSRD | Unique Paper ID – IJTSRD50142 | Volume – 6 | Issue – 4 | May-June 2022 Page 638 [12] Altieri, M. A. (1999). The ecological role of biodiversity in agroecosystems. Agriculture, Ecosystems and Environment, 74, 19–31. [13] Altieri, M. A. (2000). Multifunctional dimensions of ecologically based agriculture in Latin America’, International Journal of Sustainable Development and World Ecology, 7, 62–75. [14] Altieri, M. A. (2002). Agroecology: The science of natural resource management for poor farmers in marginal environments. Agricultural, Ecosystems and Environment, 93, 1–24. [15] Altieri, M. A. (2004). Linking ecologists and traditional farmers in the search for sustainable agriculture. Frontiers in Ecology and Environment, 2, 35–42. [16] Altieri, M. A. (2007). Transgenic crops, agrobiodiversity and agroecosystem function, in I. E. P. Taylor (ed) Genetically Engineered Crops: Interim Policies, Uncertain Legislation, Haworth Press, New York, NY [17] Altieri, M. A. & Nicholls, C. I. (2007). Agroecology: Contributions towards a renewed ecological foundation for pest management’, in M. Kogan and P. [18] Anon, (1999). Nomination proposal for the Cape Floristic Region. Phase 1. Cape Peninsula Protected Environment to be listed as a World Heritage Site. Report prepared by South African National Parks for Department of Environment Affairs and Tourism. [19] Antonel, J., & Chowdhury, Z. (2014). Measuring ambient particulate matter in three cities in Cameroon, Africa. Atmospheric Environment Journal, 85, 344–354. [20] Arku, R. E., Vallarino, J., Dionisio, K. L., Willi, S. R., Choi, H., Wilson, J. G., et al. (2008). Characterizing air pollution in two low income neighbourhoods in Accra, Ghana. Science of the Total Environment, 402, 217– 231. [21] Assamoi, E. M., & Liousse, C. (2010). A new inventory for two-wheel vehicle emissions in West Africa for 2002. Atmospheric Environment, 44, 3985–3996. [22] Baan, D. (2003). Promotion of Energy Saving Technologies and Alternatives to the Forest Report; ICIPE, Nairobi, Kenya [23] Barchia MF. (2006). Gambut: Agroekosistem dan Transformasi Karbon. Gadjah Mada University Press, Yogyakarta. [24] Battermann, S., Su, F., Jia, C., Naidoo, R. N., Robins, T., & Naik, I. (2011). Manganese and lead in children’s blood and airborne particulate matter in Durban, South Africa. Science of the Total Environment, 409, 1058–1068. [25] Baumüller, H., Brack D. & Umpfenbach, K. (2009) Keeping Illegal Fish and Timber off the Market: A Comparison of EU Regulations. Chatham House [26] Beaver, K., and Mougal, J. (2009). Review of IAS Control and Eradication Programmes in Seychelles. Available from http://www.pcaseychelles.org/uploads/1/2/3/6/1 2369400/seychelles_ias_control-erad_ review_pca_report__annexes.pdf. [27] Biodiversity Conservation in Matayos Division of Busia County, Kenya. EAS Journal of Humanities and Cultural Studies, 1(3), 133- 144. [28] Boman, J., Shaltout, A. A., Abozied, A. M., & Hassan, S. K. (2013). On the elemental composition of PM2. 5 in central Cairo, Egypt. X-Ray Spectrometry, 42, 276–283. [29] Brush, S. B., Tadesse, D. & van Dusen, E. (2003). Crop Diversity in Peasant and Industrialized Agriculture: Mexico and California’, Society and Natural Resources, 16, 123–141. [30] Cao, J., Chow, J., Lee, F., & Watson, J. (2013). Evolution of PM2. 5 measurements and standards in the U. S. and future perspectives for China. Aerosol and Air Quality Research, 13, 1197–1211. [31] Cardinale BJ, Srivastava DS, Duffy JE, Wright JP, Downing AL, Sankaran M, & Jouseau C. (2006). Effects of biodiversity on the functioning of trophic groups and ecosystems. Nature 443, 989–992. doi:10.1038/nature05202. [32] Carrere, R. (2009). African Mangroves: Their Importance for People and Biodiversity. Nature & Faune, 24 (1), 3–7. [33] Chakravarty, S, Ghosh, S. K., Suresh, C. P., Dey, A. N & Shukla. G. (2012). Deforestation: Causes, Effects and Control Strategies Global Perspectives on Sustainable Forest Management; In A. Okia (Ed) Global Perspectives on Sustainable Forest
- 19. International Journal of Trend in Scientific Research and Development @ www.ijtsrd.com eISSN: 2456-6470 @ IJTSRD | Unique Paper ID – IJTSRD50142 | Volume – 6 | Issue – 4 | May-June 2022 Page 639 Management. Available online: http//www.Intechopen.com/books/global- perspectiveson-sustainable-forest- management/deforestation-causes-and-control strategie [34] Convention on Biological Diversity (2010). Decision X/2. The Strategic Plan for Biodiversity 2011-2020 and the Aichi Biodiversity Targets. Available from https://www.cbd.int/decision/cop/?id=12268. [35] Convention on Biological Diversity (2015). Fifth National Report portal. Available from https: //www.cbd.int/reports/nr5/. [36] Cui, Z., Dou, Z., Chen, X., Ju, X., & Zhang, F. (2014). Managing agricultural nutrients for food security in China: Past, present, and future. Agronomy Journal, 106(1), 191–198. [37] Dali-Yousef, N., Ouddane, B., & Derriche, Z. (2006). Adsorption of Zn on natural sediment of Tafna River (Algeria). Journal of Hazardous Materials, A137, 1263–1270. [38] Darwall, W., Smith, K., Allen, D., et al. (2011). The Diversity of Life in African Freshwaters: Under Water, Under Threat. An analysis of the status and distribution of freshwater species throughout mainland Africa. Gland, Switzerland and Cambridge, UK: International Union for Conservation of Nature and Natural Resources. [39] De Longueville, F., Hountondji, Y. C., Henry, S., & Ozer, P. (2010). What do we know about effect of desert dust on air quality and human health in West Africa compared to other regions. Science of the Total Environment, 409, 1–8. [40] Deininger K and Minten B 2002 Determinants of deforestation and the economics of protection: an application to Mexico American Journal of Agricultural Economics 84 943–60 [41] Dibofori-Orji, A. N., & Braide, S. A. (2013). Emission of NOx, SO x and CO from the combustion of vehicle tyres in an abattoir. Journal of Natural Sciences Research, 3(8), 60– 62. [42] Dieme, D., Cabral-Ndior, M., Garcon, G., Verdin, A., Billet, S., Cazier, F., et al. (2012). Relationship between physiochemical characterization and toxicity of fine particulate matter (PM2. 5) collected in Dakar city (Senegal). Environmental Research, 113, 1–13. [43] Dionisio, K. L., Rooney, M. S., Arku, R. E., Friedman, A. B., Hughes, A. F., Vallarino, J., et al. (2010). Within neighborhood patterns and sources of particle pollution, mobile monitoring and geographic information system analysis in four communities in Accra, Ghana. Environmental Health Perspectives, 118, 607– 613. [44] EEA. (2013). European bathing water quality in 2012. European Environment Agency, EEA ReportNo4/2013. http://www.ypeka.gr/LinkClick.aspx?fileticket= 3o5dTcGoxD8%3D&tabid=253&language=el- GR. [45] Efe, S. I., & Efe, A. T. (2008). Spatial distribution of particulate matter (PM10) in Warri metropolis, Nigeria. Environmentalist, 28(4), 385–394. [46] Eliasson, I., Jonsson, P., & Holmer, B. (2009). Diurnal and intra-urban particle concentrations in relation to wind speed and stability during the dry season in three African cities. Environmental Monitoring and Assessment, 154, 309–324. [47] ESMAP. (2011). Energy sector management assistance program. The World Bank, Annual Report 2011. [48] Etyemezian, V., Tesfaye, M., Yimer, A., Chow, J. C., Mesfin, D., Nega, T., et al. (2005). Results from a pilot-scale air quality study in Addis Ababa, Ethiopia. Atmospheric Environment, 39, 7849–7860. [49] Ezzati, M., & Kammen, D. M. (2002). Household energy, indoor air pollution, and health in developing countries: Knowledge base for effective interventions. Annual Review of Energy and the Environment, 27(1), 233–70. doi: 10.1146/annurev.energy.27.122001. [50] Fayiga, A. O., Ipinmoroti, M. O., & Chirenje., T. (2016). Environmental pollution in Africa. Journal of Environ Dev Sustain DOI:10.1007/s10668-016-9894-4. [51] Ferm, M., & Karin Sjo ¨berg, K. (2015). Concentrations and emission factors for PM2. 5 and PM10 from road traffic in Sweden. Atmospheric Environment, 119, 211–219. doi:10.1016/j.atmosenv.2015.08.037. [52] Forest Services Division (FSD) (1996). Annual Report. Ministry of Lands and Forestry, Accra, Ghana.
- 20. International Journal of Trend in Scientific Research and Development @ www.ijtsrd.com eISSN: 2456-6470 @ IJTSRD | Unique Paper ID – IJTSRD50142 | Volume – 6 | Issue – 4 | May-June 2022 Page 640 [53] Fowler, C. and Mooney, P. (1990) Shattering: Food, Politics and the Loss of Genetic Diversity, University of Arizona Press, Tucson, AZ. [54] Francis, C. A. (1986) Multiple Cropping Systems, MacMillan, New York, NY. [55] Fullerton, D. G., Bruce, N., & Gordon, S. B. (2008). Indoor air pollution from biomass fuel smoke is a major health concern in the developing world. Transactions of the Royal Society of Tropical Medicine and Hygiene, 102(9), 843–851. [56] Garrison, V. H., Majewski, M. S., Konde, L., Wolf, R. E., Otto, R. D., & Tsuneoka, Y. (2014). Inhalable desert dust, urban emissions and potentially biotoxic metals in urban Saharan-Sahelian air. Science of the Total Environment, 500–501, 383–394. [57] Geldmann, J., Barnes, M., Coad, L., et al. (2013). Effectiveness of terrestrial protected areas in reducing habitat loss and population declines. Biological Conservation, vol. 161, pp. 230–238. [58] Giller, K. E., Beare, M. H., Lavelle, P., Izac, M. N. I. and Swift, M. J. (1997). ‘Agricultural intensification, soil biodiversity and agroecosystem function’, Applied Soil Ecology, 6, 3–16. [59] Goudie, A. S., & Middleton, N. J. (2001). Saharan dust storms: Nature and consequences. Earth-Science Reviews, 56, 179–204. [60] Guerreiro, C., Foltescu, V., & de Leeuw, F. (2014). Air quality status and trends in Europe. Atmospheric Environment, 98, 376–384. doi:10.1016/j.atmosenv.2014.09.017. [61] Gyasi E. A., Agyepong G. T., Ardayfio- Schandorf E., Enu-Kwesi L., Nabila J. S. & Owusu-Bennoah E. (1995). Production pressure and environmental change in the forest-savanna zone of southern Ghana. Global Environmental Change 5 (4): 355–366. [62] Hansen, M. C., Potapov, P. V., Moore, R., et al. (2013). High-resolution global maps of 21st- century forest cover change. Science, 342 (6160), 850–853. [63] Hurtt GC. (2011). Harmonization of land-use scenarios for the period 1500–2100: 600 years of global gridded annual land-use transitions, wood harvest, and resulting secondary lands. Climate Change 109, 117–161. doi:10.1007/s10584-011-0153-2 [64] Ibrahim, ME; Ahmed, HIE; Abderheim AMS. (2013). Urban Development and Deforestation: Evidences from El-Obeid Town (1970-2010). Western Sudan. Inter. J. Sci. Res. Pub. 3, 10. [65] Invasive Species Specialist Group (2014). Global Invasive Species Database. Available from http: //www.issg.org/database/welcome/. Accessed on 14 November 2021. [66] Jaya A, Page SE, Rieley JO, Limin S, Böhm HDV (2000): Impact of forest fires on carbon storage in tropical peatlands. InL: Dalam: Rochefort L, Daigle JY (eds) Sustaining our Peatlands. Proceedings of the 11th international peat congress, Québec City, Canada [67] Jepson (eds) Perspectives on Ecological Theory and Pest Management, University Press, Cambridge. [68] Joshua, O. B., Mary, B. O., & Osinbajo. O (2016). Overview of Environmental Hazards and Health Effects of Pollution in Developing Countries: A Case Study of Nigeria [69] Kaihura, F. & Stocking, M. (2003). Agricultural Biodiversity in Smallholder Farms of East Africa. [70] Kamau, J. N., Gachanja, A., Ngila, C., Kazungu, J. M., & Zhai, M. (2014). The seasonal influence on the spatial distribution of dissolved selected metals in Lake Naivasha, Kenya. Physics and Chemistry of the Earth, Parts A/B/C, 67–69, 111–116. [71] Karagulian, F., Belis, C., Dora, C., Pru ¨ss-Ustu ¨n, A., Bonjour, S., Adair-Rohani, H., et al. (2015). Contributions to cities’ ambient particulate matter (PM): A systematic review of local source contributions at global level. Atmospheric Environment, 120, 475–483. doi:10.1016/j.atmosenv.2015.08.087. [72] Kinney, P. L., Gichuru, M. G., Volavka-Close, N., Ngo, N., Ndiba, P. K., Law, A., et al. (2011). Traffic impacts on PM2. 5 air quality in Nairobi, Kenya. Environmental Science & Policy, 14, 369–378. [73] Krausmann F, Erb K-H, Gingrich S, Haberl H, Bondeau A, Gaube V, Lauk C, Plutzar C, Searchinger TD. (2013): Global human appropriation of net primary production doubled in the 20th century. Proc. Natl Acad. Sci. USA 110, 10 324–10 329. doi:10.1073/pnas.1211349110. [74] Kuvarega, A. T., & Taru, P. (2008). Ambiental dust speciation and metal content variation in