Peculiarities of irrecoverable straining in stress-drop test
•
0 likes•30 views

The paper concerns with analytical description of the phenomena observed in stress drop tests, namely, negative increment in plastic and creep deformation due to the sudden decrease in the acting stresses while the net stress remains positive. The model is developed in terms of the synthetic theory of irrecoverable deformation which has been generalized by introducing interplay between the deformation properties of material in the direction of acting load and opposite to it.

Recommended
Recommended
More Related Content
What's hot
What's hot (20)
Viewers also liked
Viewers also liked (9)
Similar to Peculiarities of irrecoverable straining in stress-drop test
Similar to Peculiarities of irrecoverable straining in stress-drop test (20)
Recently uploaded
Recently uploaded (20)
Peculiarities of irrecoverable straining in stress-drop test
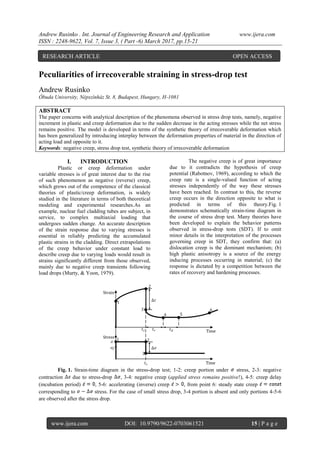
- 1. Andrew Rusinko . Int. Journal of Engineering Research and Application www.ijera.com ISSN : 2248-9622, Vol. 7, Issue 3, ( Part -6) March 2017, pp.15-21 www.ijera.com DOI: 10.9790/9622-0703061521 15 | P a g e Peculiarities of irrecoverable straining in stress-drop test Andrew Rusinko Óbuda University, Népszínház St. 8, Budapest, Hungary, H-1081 ABSTRACT The paper concerns with analytical description of the phenomena observed in stress drop tests, namely, negative increment in plastic and creep deformation due to the sudden decrease in the acting stresses while the net stress remains positive. The model is developed in terms of the synthetic theory of irrecoverable deformation which has been generalized by introducing interplay between the deformation properties of material in the direction of acting load and opposite to it. Keywords: negative creep, stress drop test, synthetic theory of irrecoverable deformation I. INTRODUCTION Plastic or creep deformation under variable stresses is of great interest due to the rise of such phenomenon as negative (reverse) creep, which grows out of the competence of the classical theories of plastic/creep deformation, is widely studied in the literature in terms of both theoretical modeling and experimental researches.As an example, nuclear fuel cladding tubes are subject, in service, to complex multiaxial loading that undergoes sudden change. An accurate description of the strain response due to varying stresses is essential in reliably predicting the accumulated plastic strains in the cladding. Direct extrapolations of the creep behavior under constant load to describe creep due to varying loads would result in strains significantly different from those observed, mainly due to negative creep transients following load drops (Murty, & Yoon, 1979). The negative creep is of great importance due to it contradicts the hypothesis of creep potential (Rabotnov, 1969), according to which the creep rate is a single-valued function of acting stresses independently of the way these stresses have been reached. In contrast to this, the reverse creep occurs in the direction opposite to what is predicted in terms of this theory.Fig. 1 demonstrates schematically strain-time diagram in the course of stress drop test. Many theories have been developed to explain the behavior patterns observed in stress-drop tests (SDT). If to omit minor details in the interpretation of the processes governing creep in SDT, they confirm that: (a) dislocation creep is the dominant mechanism; (b) high plastic anisotropy is a source of the energy inducing processes occurring in material; (c) the response is dictated by a competition between the rates of recovery and hardening processes. Fig. 1. Strain-time diagram in the stress-drop test; 1-2: creep portion under stress, 2-3: negative contraction due to stress-drop , 3-4: negative creep (applied stress remains positive!), 4-5: creep delay (incubation period) , 5-6: accelerating (inverse) creep , from point 6: steady state creep corresponding to stress. For the case of small stress drop, 3-4 portion is absent and only portions 4-5-6 are observed after the stress drop. RESEARCH ARTICLE OPEN ACCESS
- 2. Andrew Rusinko . Int. Journal of Engineering Research and Application www.ijera.com ISSN : 2248-9622, Vol. 7, Issue 3, ( Part -6) March 2017, pp.15-21 www.ijera.com DOI: 10.9790/9622-0703061521 16 | P a g e With instantaneous and time-dependent negative plastic deformation, the following approaches can be distinguished.LRIS (Long range internal stress), Composite model (Kassner et al., 2009,2015). Mughrabi (1983) developed/advanced the concept of relatively high (long-range internal) stresses in association with heterogeneous dislocation substructures (e.g., cell/subgrain walls, dipole bundles, persistent slip bands walls, etc.). He presented the simple case where “hard” (high dislocation density walls, etc.) and “soft” (low dislocation density channels, or cell interiors) elastic-perfectly-plastic regions are compatibly sheared. Each component yields at different stresses and it is suggested that the “composite” is under a heterogeneous stress-state with the high- dislocation density regions having the higher stress. As soft and hard regions are unloaded in parallel, the hard region eventually places the soft region in compression while the stress in the hard region is still positive. That is, a backstress is created. The plasticity occurs on reversal due to “reverse” plasticity in the soft region. The concept of heterogeneous stresses has also been widely embraced for monotonic deformation (Borbély et al. 1997, 2000) including elevated-temperature creep deformation.Non-Backstress explanation.Sleeswyk et al. (1978) proposed a different approach; when analyzing the hardening features in several metals at ambient temperature, he adopted an Orowan-type mechanism (long- range internal stresses or “back-stresses” not especially important) with dislocations easily reversing their motion (across cell). He suggested gliding dislocations, during work-hardening, encounter increasingly effective obstacles and the stress necessary to activate further dislocation motion or plasticity continually increases. On reversal of the direction of straining from a “forward” sense, the dislocations will easily move past those, non-regularly-spaced, obstacles that have already been surmounted. Thus the flow stress on reversal is relatively low. Lloyd and McElroy (1974) shears the same opinion, considering only the unbowing of dislocation segment, immobilized in a bowed out configuration, toward a new configuration at reduced stress. Another observation (Davies, & Wilshire, 1971) says that the instantaneous specimen contraction on decreasing the stress is greater than would be expected from the elastic modulus is a consequence of runback of dislocation pile-ups. The aim of this paper is to model the plastic and creep deformation of material due to the stress drop as shown in Fig. 1. Here, we focus our attention upon 2-3-4 portion in the strain-time diagram, i.e. negative increment in plastic and creep deformation caused by . The implementation of the problem takes place in terms of the synthetic theory by means of its generalization for the discussed issue. II. ORDINARY CREEP DEFORMATION IN TERMS OF THE SYNTHETIC THEORY The creep rate of material in uniaxial tension at point 2 in Fig. 1 is calculated as follows (Rusinko, A., & Rusinko, K., 2009,2011) ( 1 ) ( 2 ) where is the creep limit of material. Consider the quantities in the formulae above. is strain intensity rate which is an average measure of the plastic shifts developing within one slip system (microlevel of material). A macrodeformation is expressed through the components of strain rate vector in the Ilyushin three-dimensional strain deviator space, while the loading is expressed by stress vector in the stress deviator space. For the case of uniaxial tension we have two vectors and . The integration in Eq. (1) gives the rule how to calculate deformation on the macrolevel of material: one has to sum (integrate) all the microstrains developed within activated slip systems. The magnitude of can be found from the constitutive equation (3) where is defect intensity, an average measure of the defects of crystalline grade induced by irrecoverable deformation: ( 4 )
- 3. Khushbu Nagori . Int. Journal of Engineering Research and Application www.ijera.com ISSN : 2248-9622, Vol. 7, Issue 3, ( Part -5) March 2017, pp.66-69 www.ijera.com DOI: 10.9790/9622-0703061521 17 | P a g e where is the measure of material hardening, which expressed via the distance from the origin of coordinate to the plane tangential to loading (yield) surface (the position of a plane is defined via and its normal unit vector , i.e. by angles , , and ). The boundary values of , , and are (Rusinko, A., & Rusinko, K., 2011) ( 5 ) ( 6 ) The second term on the right hand side of (4) is referred to as rate-integral which accounts for the loading rate and its influence upon the development of plastic deformation: (7) III. GENERALIZATION OF THE SYNTHETIC THEORY We establish a law that governs how plastic/creep strain in one direction affects the material hardening in the opposite direction. In terms of the synthetic theory, this question sound like “How does a plastic straining, which is modeled by the movements of planes with normals at the endpoint of stress vector , affect the plane distances with opposite normals , ? According to Eq. (4), for normals is . (8) Therefore, the question posed above can be rephrased as: “How to set the relation between and as well as between and ?” Eq. (7) gives the rate integral for normals as ( 9 ) Since the rate hardening of material in initial loading does not exert any influence upon that in the subsequent loading of opposite sign, we say that if is positive, then is set to be zero and vice versa: If , or if , . (10) To reflect the influence of upon , the following formula is proposed (11) Summarizing, Eq. (4) becomes (12) The non-zero value of from (11) by no means represents any defects generated in the course of inelastic deformation because the planes with normals are not at the endpoint of vector , while the magnitude of is directly related to the value of irrecoverable strain. Therefore, the main postulate of the synthetic theory that irrecoverable deformation is modeled by the planes shifted by stress vector remains intact. The only aim of Eq. (11) is to establish, via Eq. (12), the relationship between the plastic deformation induced by loading in one direction and the degree of hardening relative to the opposite-sign-loading. Indeed, the growth of defect intensity leads to the decrease in the distance in Eq. (12) that symbolizes the softening of material with respect to the loading of opposite sign. The softening of material expressed by Eq. (12) is in full harmony with Sleeswyk’s (1978), Lloyd’s and McElroy’s (1974) opinion that dislocations easily reverse their motion in the direction opposite to the initial plastic flows. In other words, less stresses are needed to induce irrecoverable deformation in the opposite direction.In addition, formula (12) correlates with the notions of effective and backward stresses and their interplay with the dislocation behavior (Kassner et al., 2009), Mughrabi (1983), Evans (1985). Really, internal stresses defining the effective stresses and eventually the degree of material softening in reversal loading directly depend on the number of defects and stress field around them raised in the direct loading. The same situation is observed in Eq. (12) where terms and stand for the number of defects and the lattice distortion caused by their presence.
- 4. Khushbu Nagori . Int. Journal of Engineering Research and Application www.ijera.com ISSN : 2248-9622, Vol. 7, Issue 3, ( Part -5) March 2017, pp.66-69 www.ijera.com DOI: 10.9790/9622-0703061521 18 | P a g e Consider the domain that is the mirror reflection of that from (5): (13 ) The defect intensity and plane distance , according to Eqs. (8)-(12), are an d (1 4) where stands for . Intermediate remarks.To model portions 2-3 and 3- 4 from Fig. 1, we need to give the following preliminary reasoning. Since both of them are of compressive nature, they can be modeled only by means of planes with normal vectors . The occurrence of negative plastic strain increment (2- 3) is possible only if the stress increment vector reaches and moves a set of planes with negative normals . The description of reverse(negative) creep under the constant stress (3-4) also can be modelled only by the manipulations with planes with normals . It is feasible only if , i.e. if the planes with negative normals get over the origin of coordinates. Therefore, the initial stress vector must be of such magnitude that the plane distances from the first formula in (14) at are negative. Special attention must be paid for the rate integral due to it stands for the regulation of time- dependent strain for the planes with normals . To model the reverse creep, it is immediately clear that the requirement that be positive is needed. The fact that the negative creep can be observed only if it is preceded by negative plastic deformation means that a material needs to obtain some compressive strain energy which then can be released in the form of time-dependent deformation (negative creep). IV. STRESS DROP Because of stressdrop , the rate integral , according to Eq. (7), yields the following form (Fig. 2) (15) To meet the condition , the magnitude of must be greater than implying that from (15) becomes negative. Then, according to Eq. (10), we obtain that (16 ) As the stress vector shortens due to the stress drop, the planes with normals are no more at its endpoint and they stop producing inelastic deformation. This, in turn, means that there is no defect increment in positive direction, and Eq. (4) remains unchangeable until increments in defect intensity occur. This is possible if planes with normals are shifted by vector . For the rest planes Eq. (14) holds true. Let us designate through the length of stress vector when it reaches the first plane with negative normal. Since this plane is perpendicular to the stress vector, , it is distanced from the origin as (17) Therefore, to calculate the , we use Eq. (12) where (i) the left-hand-side is ; (ii) is given by (14) at and ; (iii) is from Eq. (16) at and . As a result, (1 8) (1 9) Summarizing, the occurrence of negative plastic strain increment is possible if the magnitude of is positive and the stress is less than . These conditions, in the view of Eq. (19), can be met if
- 5. Khushbu Nagori . Int. Journal of Engineering Research and Application www.ijera.com ISSN : 2248-9622, Vol. 7, Issue 3, ( Part -5) March 2017, pp.66-69 www.ijera.com DOI: 10.9790/9622-0703061521 19 | P a g e (20) If , the fulfillment of the second inequality in (20) provides that of the first one. According to Eq. (3), the increments in defect- and strain intensity are related to each other as (21) It is worthwhile to remind once more that, in terms of the synthetic theory, the increase in defects and, consequently, in strain intensity is obtained only if the stress vector translates planes on its endpoint, i.e. . Therefore, the defect intensity increment, relatively to the defects at point 2, is determined as (22 ) where is given by (16) and stands for the plane distance at point 2 given by Eq. (14) at . The domains of angles , , and where are (23) Beyond (we designate this range through ) the planes are not reached by the vector , i.e. , and, consequently, do not take part in plastic deforming. Decompose into two parts, : (25) (26) includes the planes which is not reached by , but moved during the creep on 1-2 portion when . includes the planes which did not move during the whole process ( ), from point 0 to point 2. Fig. 2. Rate integral vs. time plot at . It is clear that there is no defect intensity increment within , i.e. Eq. (14) must be applied to calculate for the range (25)-(26). The defect intensity distribution at point 3 is (2 7)
- 6. Khushbu Nagori . Int. Journal of Engineering Research and Application www.ijera.com ISSN : 2248-9622, Vol. 7, Issue 3, ( Part -5) March 2017, pp.66-69 www.ijera.com DOI: 10.9790/9622-0703061521 20 | P a g e where denotes the defect intensity at point 2 given by Eq. (14) at . Now, the plane distance due to the stress drop is (28) The increment in the compressive plastic strain vector component ( ) is calculated by the integration of the strain intensity increment given by Eqs. (21) and (22) within boundaries (23): (2 9) V. NEGATIVE (REVERSE) CREEP Rate integral for behaves as (Fig. 2) (30 ) It is easy to see that for due to vs. time curve constructed via (30) never cuts the time-axis. Inspect the strain rate intensity for . First of all, it is clear that the creep strain can develop only from the domain (23) or its sub-domain, where the planes are located on the endpoint of at , and . Therefore, the formulae for and , according to Eqs. (11) and (30), take the form as follows , ( 3 1 ) Further, Eqs. (3) and (31) give as (3 2) The domain of the positive values of is (33) (34) Special attention must be paid to the relation between the domains of non-zero and . In order to avoid a situation when the creep deformation develops on the planes which are not at the endpoint of the stress vector, we require that range (33) be not greater than that from (23) taken at , i.e. . To meet this condition, the following restriction must be imposed (35) If this inequality holds true, the planes from the domain (36) do not take part in the development of reverse creep. To calculate the negative creep strain rate vector component ( ), Eq. (1), together with Eqs. (32) and (34), must be utilized. As a result, we have (3 7)
- 7. Khushbu Nagori . Int. Journal of Engineering Research and Application www.ijera.com ISSN : 2248-9622, Vol. 7, Issue 3, ( Part -5) March 2017, pp.66-69 www.ijera.com DOI: 10.9790/9622-0703061521 20 | P a g e The analysis of the formulae above gives that the is a decreasing function of time and at the instant of time ( ) when . This is in a full agreement with portion 3-4 in Fig. 1. VI. COMPARISON OF THE MODEL AND EXPERIMENTAL RESULTS My goal here is: a) to calculate plastic contraction due to the stress drop, b) to plot negative creep diagram, The results obtained in terms of the synthetic model will be compared with experimental data obtained in uniaxial tension for Ti3SiC2 alloy (Radovic et al., 2003). The following series of parameters are needed: (i) experiment parameters, (ii) material constants, (iii) model constants. The first column in Table 1 contains the parameters of experiment on Ti3SiC2 conducted by Radovic et al. (2003). The second column shows the constants of the synthetic theory via which the analytical diagrams are constructed (Figs. 3 and 4). First of all, we read from Fig. 3 the value of the specimen contraction due to the stress drop: . According to the Hooke law, an elastic contraction caused by the would be . This fact implies the onset of plastic contraction due to the stress drop, which can be calculated as . By utilizing Eq. (29), I have obtained the plastic contraction 5.644 , which deviates from the experiment only by 8.9%. Table 1.Calculation parameters Material and experiment parameters Model constants Stress 40 B 0.3163 Stress drop -20 0.00453 Temperature 1150 38200 Young modulus ; (Barsoum et al., 1999) 325 502000 Creep limit ; 3.0 k 3.0The creep activation energy ; (Radovic et al., 2003) 4.58×10⁵ To utilize the formulae derived for negative creep, we need to determine the value of the creep limit. We take creep limit at a given temperature as the value of tensile stress resulting in the strain rate of .Therefore, can be read from the experimental line in Fig. 3 if to prolong it to the indicated value. To calculate steady state creep rate, we use formulae obtained by Rusinko (Rusinko, A., & Rusinko, K., 2011): (4.1 .83) (4.1 .84) The model line in Fig. 3, which is obtained via the formulae above, shows good agreement with the experimental data.Theoretical stress ~ time plot for the negative creep portion (Fig. 4) is constructed as (4.1.85) where is defined by Eq. (37). The value of the deformation at the beginning of negative creep ( ) we have read from the experimental curve ( )
- 8. Khushbu Nagori . Int. Journal of Engineering Research and Application www.ijera.com ISSN : 2248-9622, Vol. 7, Issue 3, ( Part -5) March 2017, pp.66-69 www.ijera.com DOI: 10.9790/9622-0703061521 2 | P a g e Fig. 3. vs. plot for Ti3SiC2 alloy at 1150 ; □ – experiment (Radovic et al., 2003), line – model result. ( is steady-state creep rate). Fig. 4. Negative creep diagram of Ti3SiC2 alloy at 1150 , ; □ – experiment (Radovic et al., 2003), line – model result. V. CONCLUSION In terms of the synthetic theory, a model has been developed for phenomena accompanying stress- drop tests such as a) stress-drop induced plastic contraction, which is recorded in spite of the fact that the net stress remains positive and b)negative creep. These results have been achieved by introducing a relation between the deformation properties of materials for opposite directions, e.g. tension-compression.It is possible due to the basic features of the synthetic theory: a) the uniformed approach to the modeling of permanent deformation independently of instantaneous (plastic) or temporary (creep) deformation to be considered, and b) the intimate connection between the macro- deformation and the defect structure on the micro- level of material. Model results, plastic contraction due to the stress-drop and negative creep diagram, show good agreement with experimental data. REFERENCES [1] Cadek,J. (1987). The back stress concept in power law creep of metals: a review. Materials Science and Engineering, 94: 79-92. [2] Davies, P. W., & Wilshire, B. (1971). On internal stress measurement and the mechanism of high temperature creep. Scripta Metallurgica, 5: 475-478. [3] Evans, R. W., Roach, W. J. F., & Wilshire, B. (1985). A re-interpretation of r and h measurementsduring creep. Materials Science and Engineering, 73: L5-L8. [4] Kassner, M. E., Geantil, P., Levine, L. E., & Larson, B. C. (2009). Backstress, the Bauschinger effect and cyclic deformation. In Materials Science Forum, 604: 39-51. Trans Tech Publications. [5] Lloyd, G. J., & McElroy, R. J. (1974). On the anelastic contribution to creep. Acta Metallurgica, 22: 339-348. [6] Mughrabi, H. (1983). Dislocation wall and cell structures and long-range internal stresses in deformed metal crystals. Acta metallurgica, 31: 1367-1379. [7] Rabotnov, Ju. N. (1969). Creep problems in structural members (Vol. 7). North-Holland Pub. Co. [8] Radovic, M., Barsoum, M.W., El-Raghy, T. and Wiederhorn, S.M. (2003). Tensile creep of coarse-grained Ti3SiC2 in the 1000-1200 temperature range. Journal of Alloys and Compounds, 361: 299-312. [9] Rusinko, A., & Rusinko, K. (2009). Synthetic theory of irreversible deformation in the context of fundamental bases of plasticity. Mechanics of Materials,41: 106-120. [10] Rusinko, A., & Rusinko, K. (2011). Plasticity and Creep of Metals. Springer Science & Business Media. [11] Sleeswyk, A. W., James, M. R., Plantinga, D. H., & Maathuis, W. S. T. (1978). Reversible strain in cyclic plastic deformation. Acta Metallurgica, 26: 1265-1271.