Big Data and Data Analytics: An Action Platform for the Science of Prediction

Analytics is the detection and communication of meaningful motive in data. Analytics plays a key role in areas rich with recorded information. The role of data is escalating tenaciously in the present day. Analysis of the data is the process of inspecting, removing the obsolete information and transforming the data into useful information. Data analytics approach is pragmatic in nature. Data Analytics uses multiple approaches and techniques, like use of mathematical approach and data analytics is used in multiple domains namely business, technology, automobile and many more. This paper focuses on how data plays a key role in the field of analytics. It deals with the implementation of data analytics in different domains. Data analytics:An action platform for the science of prediction.

Recommended
Recommended
More Related Content
What's hot
What's hot (20)
Viewers also liked
Viewers also liked (20)
Similar to Big Data and Data Analytics: An Action Platform for the Science of Prediction
Similar to Big Data and Data Analytics: An Action Platform for the Science of Prediction (20)
Recently uploaded
Recently uploaded (20)
Big Data and Data Analytics: An Action Platform for the Science of Prediction
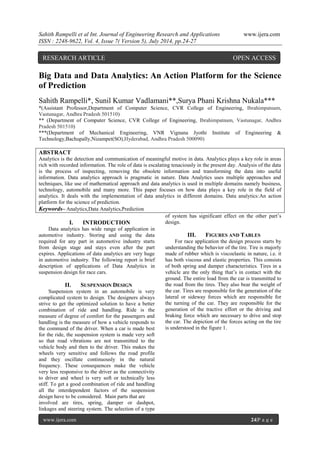
- 1. Sahith Rampelli et al Int. Journal of Engineering Research and Applications www.ijera.com ISSN : 2248-9622, Vol. 4, Issue 7( Version 5), July 2014, pp.24-27 www.ijera.com 24|P a g e Big Data and Data Analytics: An Action Platform for the Science of Prediction Sahith Rampelli*, Sunil Kumar Vadlamani**,Surya Phani Krishna Nukala*** *(Assistant Professor,Department of Computer Science, CVR College of Engineering, Ibrahimpatnam, Vastunagar, Andhra Pradesh 501510) ** (Department of Computer Science, CVR College of Engineering, Ibrahimpatnam, Vastunagar, Andhra Pradesh 501510) ***(Department of Mechanical Engineering, VNR Vignana Jyothi Institute of Engineering & Technology,Bachupally,Nizampet(SO),Hyderabad, Andhra Pradesh 500090) ABSTRACT Analytics is the detection and communication of meaningful motive in data. Analytics plays a key role in areas rich with recorded information. The role of data is escalating tenaciously in the present day. Analysis of the data is the process of inspecting, removing the obsolete information and transforming the data into useful information. Data analytics approach is pragmatic in nature. Data Analytics uses multiple approaches and techniques, like use of mathematical approach and data analytics is used in multiple domains namely business, technology, automobile and many more. This paper focuses on how data plays a key role in the field of analytics. It deals with the implementation of data analytics in different domains. Data analytics:An action platform for the science of prediction. Keywords– Analytics,Data Analytics,Prediction I. INTRODUCTION Data analytics has wide range of application in automotive industry. Storing and using the data required for any part in automotive industry starts from design stage and stays even after the part expires. Applications of data analytics are very huge in automotive industry. The following report is brief description of applications of Data Analytics in suspension design for race cars. II. SUSPENSION DESIGN Suspension system in an automobile is very complicated system to design. The designers always strive to get the optimized solution to have a better combination of ride and handling. Ride is the measure of degree of comfort for the passengers and handling is the measure of how a vehicle responds to the command of the driver. When a car is made best for the ride, the suspension system is made very soft so that road vibrations are not transmitted to the vehicle body and then to the driver. This makes the wheels very sensitive and follows the road profile and they oscillate continuously in the natural frequency. These consequences make the vehicle very less responsive to the driver as the connectivity to driver and wheel is very soft or technically less stiff. To get a good combination of ride and handling all the interdependent factors of the suspension design have to be considered. Main parts that are involved are tires, spring, damper or dashpot, linkages and steering system. The selection of a type of system has significant effect on the other part’s design. III. FIGURES AND TABLES For race application the design process starts by understanding the behavior of the tire. Tire is majorly made of rubber which is viscoelastic in nature, i.e. it has both viscous and elastic properties. This consists of both spring and damper characteristics. Tires in a vehicle are the only thing that’s in contact with the ground. The entire load from the car is transmitted to the road from the tires. They also bear the weight of the car. Tires are responsible for the generation of the lateral or sideway forces which are responsible for the turning of the car. They are responsible for the generation of the tractive effort or the driving and braking force which are necessary to drive and stop the car. The depiction of the forces acting on the tire is understood in the figure 1. RESEARCH ARTICLE OPEN ACCESS
- 2. Sahith Rampelli et al Int. Journal of Engineering Research and Applications www.ijera.com ISSN : 2248-9622, Vol. 4, Issue 7( Version 5), July 2014, pp.24-27 www.ijera.com 25|P a g e Figure 1 Every tire has a limit of amount of force it can support or generate with the ground. This limit depends on major factors like vertical load or normal force action on the tire, the velocity of travel, the temperature of the tire, and pressure on the tire and most importantly the compound of the tire. The tires are initially tested under various conditions and the required data is recorded. Figure 2 shows the force that a tire generates under varying conditions of slip angle and slip ratio. Figure 2 Here the term slip angle is used when lateral force is stated. When a tire generates lateral forces the contact patch of the tire is pulled in one direction. This deforms the tire at the contact patch in the lateral direction. Because of which the tire does not follow the intended path. It deviates the path to be followed by certain angle called as slip angle. Similarly when a tire accelerates or brakes the translational velocity of the tire is different from the rotational velocity of the tire, generally known as wheel slip. The ratio of difference between these velocities to translational velocity of tire is called the slip ratio. In figure 2, the forces reach a peak point and then drop of suddenly. So from various experiments it was observed that the wheel rolls upto the peak which consists of linear range in the beginning and transitional range to the peak. Beyond the peak the force drops which is called frictional range where the wheels are actually sliding. Figure 3 show how the longitudinal force varies with the vertical load for various slip ratios.
- 3. Sahith Rampelli et al Int. Journal of Engineering Research and Applications www.ijera.com ISSN : 2248-9622, Vol. 4, Issue 7( Version 5), July 2014, pp.24-27 www.ijera.com 26|P a g e Figure 3 Figure 4 shows how the lateral force varies with slip angle for various vertical loads. Figure 4 The above data is just under a single condition of pressure, temperature, speed and compound. Various other parameters like camber angle and toe angle which add or subtract to the forces based on the direction. Figure 5 shows how tires support a car from sliding of the road while cornering. Figure 5 Till the above case the situation both longitudinal forces and lateral forces are handled independently. But in every situation both these forces are handled together. So the data of the lateral and longitudinal force is collected and friction circle is drawn. If the resultant of these two forces is outside the friction circle the wheels start to slide. Figure 6 shows the sample of a friction circle. Figure 6 The above situations are basics of DA in suspension system design of automotive industry. The details of these designs are always secret of every company and are handled very securely. Few other graphs on how stored data is used in designing. Figure 7 Rolling resistance of bicycle Figure 8 Lateral force vs. slip angle during braking and accelerating
- 4. Sahith Rampelli et al Int. Journal of Engineering Research and Applications www.ijera.com ISSN : 2248-9622, Vol. 4, Issue 7( Version 5), July 2014, pp.24-27 www.ijera.com 27|P a g e Figure 9 Lateral force vs. Velocity vs. Steering angle 3D graph Figure 10 Time variant application of lateral force IV. CONCLUSION This paper discusses about the data analytics -an action platform for the science of prediction. It describes the use of data effectively in the field of analytics and also the use of data analytics in different domains. In this paper we have taken an overview of application of data analytics in the field of automobile which focuses on the key aspects of the automobile segment to solve problems pertaining to suspension design. Reference Journal Papers: [1] Mechanical Mathematical Models Describing the Dynamic Behaviour of Vehicle with ARM Suspension, Kunchev L ., M. Eng. Pavlov N., Technical University – Sofia, Bulgaria [2] Understanding Parameters Influencing Tire Modeling, Nicholas D. Smith Colorado State University, 2004 Formula SAE Platform [3] Numerical Prediction of the Dynamic Behaviour of Rolling Tyres, C. González Díaz, S. Vercammen, J. Middelberg, P. Kindt, C. Thiry, J. Leyssens Goodyear Innovation Center, Tire Vehicle Mechanics Department Books: [4] Race Car Vehicle Dynamics(William F Milliken and Douglas L. Milliken) [5] Fundamentals of Vehicle Dynamics(Thomas D. Gillespie) [6] Tire and Vehicle Dynamics(Hans B Pacejka) [7] The Shock Absorber Handbook (John Dixon ) [8] Vehicle Dynamics : Theory and Application( Reza N. Jazar)