2. Página 2
Brief Intro
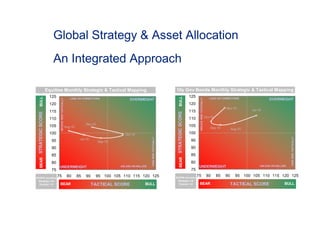
This is an example of the output of an integrated AA approach
This methodology seamlessly integrates several layers of information and
provides a very complete and structured view of the markets
The phases model is the most important building block of this methodology (see
next page)
Once we ascertain how convenient the current economic environment is for
assets through the phases model we combine the output with indicators relevant
to each of the asset classes (Equities and Fixed Income in this example). After
integrating all information we end up with a strategic score for each asset class
that ranges between 120 and 80 points (120 = bull, 100=neutral and 80 = bear)
At the same time we compute tactical indicators in a weekly basis for both
asset classes using the same range of scores (120 = bull, 100=neutral and 80 =
bear)
We finally combine the monthly basis strategic output with the weekly basis
tactical output into the strategic and tactical Chart Mapping
For simplicity, the Strategic and Tactical Chart Mappings samples the tactical
weekly data (one out of every 4 observations) so we can see both axis in a
monthly basis at once. The chart shows the latest information available at that
point in time
3. Página 3
The Four Phases Model
The four phases model tries discern the degree of convenience
of the current macro environment for an asset class
The probability of the economy being in Phase IV (negative &
widening output gap, with growth below trend) has fallen to 60% in
October-November
With an easing monetary policy, this Phase is characterized by
high volatility in stock markets. Bonds perform well
US Probability of the 4 Phases of the Economy
0.0
0.1
0.2
0.3
0.4
0.5
0.6
0.7
0.8
0.9
1.0
Jan-00
Jan-01
Jan-02
Jan-03
Jan-04
Jan-05
Jan-06
Jan-07
Jan-08
Jan-09
Jan-10
Phase 1 Phase 2
Phase 3 Phase 4
US Output Gap & Growth vs Trend Monthly
Indicators (MA3)
-7
-6
-5
-4
-3
-2
-1
0
1
2
3
4
Jan-00
Jan-01
Jan-02
Jan-03
Jan-04
Jan-05
Jan-06
Jan-07
Jan-08
Jan-09
Jan-10
-3.5
-3.0
-2.5
-2.0
-1.5
-1.0
-0.5
0.0
0.5
1.0
1.5
2.0
Growth vs Trend Indicator
OG Proxy (left scale)
4. Página 4
Equity: Strategic & Tactical Scores
600
700
800
900
1000
1100
1200
1300
1400
1500
1600
feb-06
may-06
ago-06
nov-06
feb-07
may-07
ago-07
nov-07
feb-08
may-08
ago-08
nov-08
feb-09
may-09
ago-09
nov-09
feb-10
may-10
ago-10
nov-10
80
90
100
110
120
Strat Score SP500 (left axis)SP500 vs Strategic Score Strategic Score (monthly)
Marginal improvement in November
The current economic phase with GDP
growth close to or below potential
continues to signal higher than normal
uncertainty for equities. But our probability
models show that we might be transitio-
ning into a more favourable phase
The Earnings composite improves slightly
and remains the main support for the
overall score
Valuations have remained in neutral
territory. Not a problem for equities at the
moment
Tactical Score (weekly)
Deteriorates significantly during the past
week, due to the roll of technical
indicators. The composite now provides a
bearish reading
950
1000
1050
1100
1150
1200
1250
04-dic
18-dic
01-ene
15-ene
29-ene
12-feb
26-feb
12-mar
26-mar
09-abr
23-abr
07-may
21-may
04-jun
18-jun
02-jul
16-jul
30-jul
13-ago
27-ago
10-sep
24-sep
08-oct
22-oct
05-nov
80
90
100
110
120
Tactical Score SP500 (left axis)SP500 vs Tactical Score
6. Página 6
Core Government Bonds: Strategic & Tactical Scores
Strategic Score (monthly)
Our phase-model continues in a bullish
mode, even though our probability
models suggest that a shift to a less
favourable phase for core fixed income
may be in the offing
10-year Treasury market yields have
moved higher while the fair value yield
has moved lower. The two now largely
coincide. Bunds remain expensive on
our valuation metrics
Overall, the strategic score improves to
bullish
Tactical Score (weekly)
While the short term valuation score is
positive and the sentiment indicator is
neutral, the trend drags the overall
tactical score down to negative
2.0
2.5
3.0
3.5
4.0
4.5
5.0
5.5
dic-06
feb-07
abr-07
jun-07
ago-07
oct-07
dic-07
feb-08
abr-08
jun-08
ago-08
oct-08
dic-08
feb-09
abr-09
jun-09
ago-09
oct-09
dic-09
feb-10
abr-10
jun-10
ago-10
oct-10
80
90
100
110
120
Strat Score US10y Rate (left axis)10y Gov Rate vs Strategic Score
2
2.5
3
3.5
4
4.5
04-dic
18-dic
01-ene
15-ene
29-ene
12-feb
26-feb
12-mar
26-mar
09-abr
23-abr
07-may
21-may
04-jun
18-jun
02-jul
16-jul
30-jul
13-ago
27-ago
10-sep
24-sep
08-oct
22-oct
05-nov
80
90
100
110
120
Tactical Score 10y US rate (left axis)10y Gov Rate vs Tactical Score