Student
•Download as DOCX, PDF•
0 likes•201 views

The document summarizes the results of a survey about transportation conducted with 50 students at IPTHO. Key findings include: - 33 out of 50 students (66%) answered yes to owning a vehicle. - The most common vehicle color was black, with 17 students selecting it. - The mode for frequency of vehicle use per week was 11-20 times, with 13 students selecting this option. - Most students use their vehicle more than once a day on average to get around IPTHO and outside of it. The survey provides useful information for vehicle sellers on the transportation habits and preferences of students. Pie charts, bar graphs and other visuals are used to clearly present the survey results

Recommended
More Related Content
More from Pensil Dan Pemadam
More from Pensil Dan Pemadam (20)
Recently uploaded
Recently uploaded (20)
Student
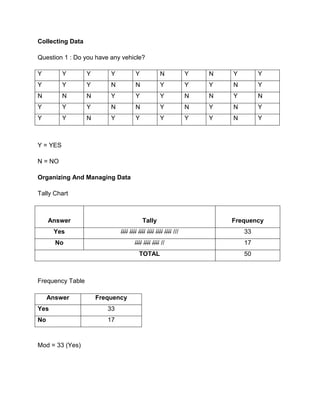
- 1. Collecting Data Question 1 : Do you have any vehicle? Y Y Y Y Y N Y N Y Y Y Y Y N N Y Y Y N Y N N N Y Y Y N N Y N Y Y Y N N Y N Y N Y Y Y N Y Y Y Y Y N Y Y = YES N = NO Organizing And Managing Data Tally Chart Answer Tally Frequency Yes //// //// //// //// //// //// /// 33 No //// //// //// // 17 TOTAL 50 Frequency Table Answer Frequency Yes 33 No 17 Mod = 33 (Yes)
- 2. Representation Of Data People in IPTHO that have vehicle No 34% 17 people Yes 33 people 66% Interpretation And Making Inferences The most popular answer is ‘YES’ and it’s the mode for the data. so, that mean 33 people (66%) of 50 answer ‘YES’ and 17people (34%) more answer ‘NO’, This shown that 33 people have their own vehicle. From the survey above, it can be say that people in IPTHO use their vehicle almost every day to easy them to move from one place to another. So, without vehicle, it will be hard for them to move not just only in IPTHO itself but also outside IPTHO.
- 3. Collecting data Question 3 : What is the colour of your transport? G G BC W BC BC BC BC BC O BC R BL R R G BC R G BC BC BL BC BC R BC R BC W BC BC W BC R = Red BL = Blue G = Green BC = Black W = White O = Others
- 4. Organizing and managing data Tally chart Colours Tally Frequency Red //// / 6 Blue // 2 Green //// 4 Black //// //// //// // 17 White /// 3 Others / 1 TOTAL 33 Frequency table Colours frequency Red 6 Blue 2 Green 4 Black 17 White 3 Others 1 Mode : 17 (black) Median: 1,2,3,4,6,17 = 3.5 Mean : 6+2+4+17+3+1 = 5.5 6
- 5. Representation of Data The Colours of Transport In IPTHO 18 16 14 12 Red Frequency 10 Blue 8 Green 6 Black 4 White 2 Others 0 Red Blue Green Black White Others Colours Interpretation and Making Inferences The bar chart shown that black is the highest frequency from other colour. The frequency for this colour is 17 and it’s the mode for this data. This is because most of the people in IPTHO love black as their transport main colour. Besides that black is a elegant and simple colour.
- 6. Collecting data Question 6: How frequent did you use your transport in a week? 1-10 11-20 21-30 11-20 21-30 1-10 11-20 1-10 11-20 1-10 31-40 11-20 1-10 21-30 1-10 11-20 21-30 11-20 11-20 31-40 1-10 41-50 11-20 1-10 11-20 31-40 1-10 41-50 11-20 11-20 41-50 11-20 41-50 Organizing and managing data Tally Chart Times Tally Frequency 1-10 //// //// 9 11-20 //// //// /// 13 21-30 //// 4 31-40 /// 3 41-50 //// 4 TOTAL 33
- 7. Frequency Table Times Frequency 1-10 9 11-20 13 21-30 4 31-40 3 4 40-50 TOTAL 33 Mode = 11-20
- 8. The Median Frequency Times Cumulative Frequency 1-10 9 9 11-20 13 22 21-30 4 26 31-40 3 29 40-50 4 33 So, Median = L + [(N/2 – F) / fm] C L = Lower boundary of the median class L = 10.5 N = Total frequency = 33 F = Cumulative frequency before L =9 Fm = Frequency of L = 22 C = size of median class. = 11 So, Median = 10.5 + [(33/2 – 9) / 22] 11 = 93
- 9. The Mean Times Frequency (f) Mid point(x) fx 1-10 9 1+10 = 5.5 9 x 5.5 = 49.5 2 11-20 13 11+20 = 15.5 13 x 5.5 = 71.5 2 21-30 4 21+30 = 25.5 4 x 25.5 = 102 2 31-40 3 31+40 = 35.5 3 x 35.5 = 106.5 2 40-50 4 40+50 = 45.5 4 x 45.5 = 182 2 TOTAL 33 (N) 127.5 511.5 Mean = Total fx N = 511.5 33 = 15.5
- 10. Represent of Data The Frequent Of Student Using Their Transport In A Week 14 13 F 12 r 10 9 e q 8 u e 6 n 4 4 4 c 3 y 2 0 01 - 10 11 - 20 21 - 30 31 - 40 40 - 50 Times 01 - 10 11 - 20 21 - 30 31 - 40 40 - 50 Interpretation and Making Inferences The histogram shown that the mode is 11-20 and the frequency is 13. Median for the data are 93 and mean is 15.5. From the data, it can be conclude that most of the student in IPTHO use their transport between 11-20 times in a week. This shown that student use their vehicle more than once in a day.
- 11. Background of survey Today, transportation is too important to everyone to move around. There are many kind of transportation like bicycle, motorcycle, and cars. So, it can be say that everyone have their own vehicle. Transport is important to make our journey faster and comfortable especially when we are in hurry. No matter what kind or size of the transport is, they will need petrol to move. So, the more we use the transport, the more we need to spend for the petrol. In our daily life, how reasonable we use our money for the petrol depend on ourself. So we have to smart when we use the transport. Transport can make our life better if we know how to use them. Problem statement I had choose to survey about the transport in IPTHO because I want to find out how many people in 50 survey that own the vehicle. So, I have survey 50 student randomly in IPTHO. Among 50 student, most of them are boys and the rest are girls. Objectives of survey There are some objectives from the survey that I have made: i. To get the information on how many student that own vehicle. ii. To get the frequency of student use their vehicle in a week. iii. To get to know most of the transport colour in IPTHO.
- 12. Importance of survey My survey could be benefit to the car seller, motorcycle seller, bicycle seller and other vehicle seller. They will know how much they can target their market to the student. Besides they can also design a better transport for the student according their uses. If there are more student that use the vehicle, they can produce more vehicle for student. Limitation of survey The limits of my survey are 50 students. The respondents for my questionnaires are 50 students. This surveys takes place in Institut Perguruan Tun Hussein Onn. Not everyone in IPTHO that involve inthis survey even the surveyer are ramdomly choosen. Definition of terms Mode: the mode is the value that occurs the most frequently in a data set or a probability distribution. In some fields, notably education, sample data are often called scores, and the sample mode is known as the modal score. Mean: the expected value of a random variable. For a data set, the mean is the sum of the observations divided by the number of observations. The mean is often quoted along with the standard deviation: the mean describes the central location of the data, and the standard deviation describes the spread.
- 13. Median: Median is described as the number separating the higher half of a sample, a population, or a probability distribution, from the lower half. Frequency: The number of occurrences within a given time period; "the frequency of modulation was 40 cycles per second"; "the frequency of his seizures. Transportation: Transportation system: a facility consisting of the means and equipment necessary for the movement of passengers or goods Vehicle: A conveyance that transports people or objects
- 14. REFLECTION When I received this task, I feel glad because I thought it is easy because it was the subject that I have learnt when I was at secondary school. When I begin to complete this task I find out that this is difficult task. I need to write down questionnaires in making my own research related to students in IPTHO. The title of my questionnaires is the amount of top up for one month among PPISMP RBT July 2007 intake students. After I have written the questionnaires, I go get 50 students as my respondents for my research. The answer from my respondent is the result for my research. So, this task really needs a lot of hard work because I have to find my respondent in getting the result for my research. It is easy for me to complete this task after I got the result for my questionnaires. I have presented my research in three different type of chart which is pie chart, histogram and bar chart. I gain a lot of knowledge about statistics in completing this task. Luckily I have enough time to complete this task and finish it on time before the submission date.
- 15. Institut Perguruan Tun Hussein Onn Batu Pahat Johor TUGASAN: BASIC MATH NAMA: MUHAMMAD SHAMZURIMI BIN MUHAMMAD 890923 03 5963 KUMPULAN : PPISMP 3RBT3 PENSYARAH : EN HAMZAH BIN NUN TARIKH SERAHAN: 10 SEPTEMBER 2008
- 16. APPENDIX