Vfd drive motor load
•
2 likes•155 views

motor drive trouble shooting and diagnosis with Fluke ScopeMeter by checking unbalance of voltage and current, overvoltage and undervoltage, variable torque and constant torque, motor shaft voltage and bearing voltage

Recommended
Recommended
More Related Content
What's hot
What's hot (20)
Viewers also liked
Viewers also liked (12)
Similar to Vfd drive motor load
Similar to Vfd drive motor load (20)
Recently uploaded
Recently uploaded (20)
Vfd drive motor load
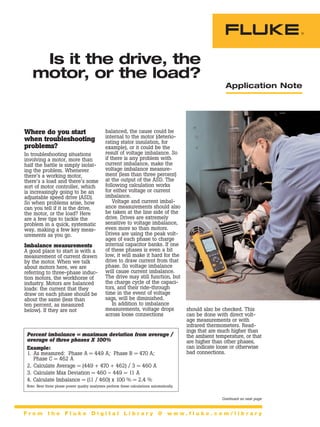
- 1. Application Note Where do you start when troubleshooting problems? In troubleshooting situations involving a motor, more than half the battle is simply isolat- ing the problem. Whenever there’s a working motor, there’s a load and there’s some sort of motor controller, which is increasingly going to be an adjustable speed drive (ASD). So when problems arise, how can you tell if it is the drive, the motor, or the load? Here are a few tips to tackle the problem in a quick, systematic way, making a few key meas- urements as you go. Imbalance measurements A good place to start is with a measurement of current drawn by the motor. When we talk about motors here, we are referring to three-phase induc- tion motors, the workhorse of industry. Motors are balanced loads: the current that they draw on each phase should be about the same (less than ten percent, as measured below). If they are not balanced, the cause could be internal to the motor (deterio- rating stator insulation, for example), or it could be the result of voltage imbalance. So if there is any problem with current imbalance, make the voltage imbalance measure- ment (less than three percent) at the output of the ASD. The following calculation works for either voltage or current imbalance. Voltage and current imbal- ance measurements should also be taken at the line side of the drive. Drives are extremely sensitive to voltage imbalance, even more so than motors. Drives are using the peak volt- ages of each phase to charge internal capacitor banks. If one of these phases is even a bit low, it will make it hard for the drive to draw current from that phase. So voltage imbalance will cause current imbalance. The drive may still function, but the charge cycle of the capaci- tors, and their ride-through time in the event of voltage sags, will be diminished. In addition to imbalance measurements, voltage drops across loose connections Is it the drive, the motor, or the load? F r o m t h e F l u k e D i g i t a l L i b r a r y @ w w w . f l u k e . c o m / l i b r a r y Continued on next page should also be checked. This can be done with direct volt- age measurements or with infrared thermometers. Read- ings that are much higher than the ambient temperature, or that are higher than other phases, can indicate loose or otherwise bad connections. Percent imbalance = maximum deviation from average / average of three phases X 100% Example: 1. As measured: Phase A = 449 A; Phase B = 470 A; Phase C = 462 A 2. Calculate Average = (449 + 470 + 462) / 3 = 460 A 3. Calculate Max Deviation = 460 – 449 = 11 A 4. Calculate Imbalance = (11 / 460) x 100 % = 2.4 % Note: New three phase power quality analyzers perform these calculations automatically.
- 2. ASD overvoltage and undervoltage trips Drives have diagnostic codes which identify the cause of trip. Generally speaking, they can be classified as overvolt- age, undervoltage, or overload (overcurrent). Note that mechanical starters only have overload trips. They’re not concerned with over or under- voltage. What makes drives different? Drives turn sine wave ac into dc (converter section), and then turn the dc back into ac (inverter section). However, the ac at the output is not a sine wave. It is a special waveform known as the pulse-width modulated (PWM). The PWM, from the motor’s point of view, is accepted as if it were a sine wave — almost (see Advanced motor measurements below). For now, though, let’s focus on the drive internals, specifically on what’s commonly referred to as the dc link. The dc link is nothing but a capacitor bank, usually with a series link inductor (reactor) thrown in for filtering and protection. The dc link is carefully monitored by the drive; overvoltage or undervoltage refers to the volt- age of the dc link. Undervoltage can be caused externally by voltage sags on the drive input. The Sags and Swells function on Fluke power quality analyzers can help to identify line-related undervolt- age problems. Problems could also exist internally with the dc link capacitors and/or reactor. In many drives, there are test points to measure the dc link voltage. To check the capaci- tors, use the min/max function of a digital multimeter, or, preferably, the trend function of a Fluke power quality analyzer or ScopeMeter® test tool. Check if voltage regulation is within the manufacturer’s specifica- tion. To check the reactor, check the waveform on both sides — there should be no change. When troubleshooting a system, the tendency is to view the drive or PLC as the most susceptible to voltage sags. The ice-cube control relay is most often the source of sag-related problems. Studies have shown that these low-cost compo- nents are the first to drop out when voltage sags occur. So don’t forget to look at any external control circuit while you’re troubleshooting intermit- tent system shutdowns. Overvoltage could be a symptom of problems in the capacitors or reactor. Or it could be caused by line-related volt- age transients. At one point, utility capacitor switching tran- sients were notorious for causing overvoltage trips in drives. Overvoltage could also be caused by regenerative loads. Loads such as cranes and elevators feed back voltage when they decelerate. Dynamic braking circuits are installed to shunt off this energy from the drive, where they would other- wise show up as overvoltage on the dc link. Problems such as improper installation can result in overvoltage trips. Overload problems are usually load related and will be addressed below. Load profiling To troubleshoot the interaction between the load and the motor, you have to understand the relationship between torque and current. A motor is nothing but a device to turn electrical energy (current) into rotational mechanical energy (torque), via the magical effects of magnetism. What a load demands of a motor is torque. For all practical purposes, this torque is directly proportional to current used by the motor. This should make perfect sense, because we all know that for constant-speed motors — which include all motors started across the line (with electro-mechanic starters) — voltage is, or should be, stable, and current is the variable. When a load demands more torque and current than a motor can supply, the result is an overload condition. Over- loading will cause overheating of the motor. Motor controllers will shut down the motor (and thereby the load) rather than allow permanent winding insu- lation damage to occur. Overloading is always relative to time: a high overload will trip the motor in a short time, while a lower level of overload will take longer to trip the motor. When we want to evaluate the impact of a load on the motor- drive system, we have to measure the current it draws. Of course, this current draw typi- cally varies over time as the load varies. The measurement of current over some period of time is called load profiling. For load profiling, the power-record func- tion of Fluke power quality analyzers is ideal for capturing a trend line of current consumption (and kW too, if you want it). A cursor enables you to identify the current values at different points on the trend line, along with a time stamp for those points. It is not necessary to measure all three phases of the induction motor because the motor is a balanced load. Before load profiling, first make the current imbalance measurement to make sure the motor is healthy. If your concern is nuisance tripping, then pick the high leg and measure that (an overload on one leg will trip all three legs). When load profiling, we are looking for periods of especially high current, relative to the full load amps of the motor. Full load amp information is available on the nameplate of the motor. If there is a service factor, the range calculation should be made on the basis of full load amps times service factor. While high current is the main concern, low current should also be avoided. A motor is most effi- cient, and has the best power factor, in the 60 to 80 percent range of its full load amps. There is no immediate penalty for underloading — the motor will not trip. In fact, many motors are routinely oversized for the load, on the theory that the motor is less likely to trip from overload. However, as is most often the case, there is no free lunch. In the case of underloading, the energy company sends a higher bill. Continued from previous page Continued on next page 2 Fluke Corporation Is it the drive, the motor or the load?
- 3. Is it the drive, the motor or the load? Fluke Corporation 3 Continued on next page Continued from previous page Two different loads: variable torque and constant torque Most drive systems are used with variable torque or constant torque loads. Variable torque loads include fans and rotary pumps. These are by far the majority of loads, from an energy consumption point of view. When ASDs are used with these loads, dramatic energy savings can be realized. For example, a fan at half- speed (30 Hz) ideally uses only one-eighth of the power of the same fan at 60 Hz (we say ideally, because there is always some level of loss due to ineffi- ciencies in the drive-motor- load system). From a trou- bleshooting point of view, the important thing to realize is that these variable torque loads rarely cause overload-related problems for drives (assuming the load has been sized correctly). That is because they spend a lot of their time running at lower speeds (less than 60 Hz) and drawing less current. If this were not the case, that is, if the load demanded full speed (and torque) most or all of the time, there would be no economic justification; i.e., energy savings, to install an ASD in the first place. Sometimes these loads will cause a trip at start- up, but that is usually an indication that the load has not been sized correctly to the drive. Another possibility is that the load has changed. For example, a bearing starting to seize up demands more initial torque to get the load going. Constant torque loads can be more challenging. Frictional or gravitational loads are constant torque loads. The key thing to understand about these loads is that they require the same level of current (more or less) at lower speeds. This can be dangerous for the motor. Motors are usually cooled by fans built onto the rotor; when the motor slows, the fan cools less. Therefore excessive heating can occur. The danger is that motor over- load circuits are built to measure heat indirectly by measuring current (there are motors with heat sensors embedded in their stators, but these are obviously more expensive). Here we have a situation where normal current draw at low speed can cause overheating. The common solu- tion is to install externally powered fans to cool the motor. Before we leave the subject of load troubleshooting, it should be noted that there is a whole area of expertise having to do with the mechanical link- age of the motor and load. These include vibration, shaft alignment, motor mounting, etc. These are obviously impor- tant issues, but they are outside of the scope of this arti- cle. Advanced motor measurements In ASD motor systems, there are a few measurements that need to be taken that would not be taken in mechanical starter (across the line) motor systems. This is because the fast switching, high-frequency element of the PWM output waveform causes special prob- lems that the sine wave doesn’t. At first glance, the motor as a current-drawing load looks like nothing but a big set of inductors or coils (stator windings), and the nature of inductors is that they filter out the high frequency current elements. That is why the current waveform looks like a sine wave. But unfortunately, those high-frequency elements of the voltage waveform do not get filtered out, and are capa- ble of causing some mischief. The first two of these meas- urements should be made with a ScopeMeter or with the Scope function of a Fluke power quality analyzer: • Overvoltage reflections. Measure phase-to-phase at the motor terminals. The leading edges of the PWM pulses can have peak values much higher (up to 200 percent in theory) than normal. These overvoltage reflections can cause damage to motor windings. These overvoltages are clearly visible on the scope waveform. Solutions fall into three categories: shorten the drive-motor cable length; use a motor with higher grade insulation, so-called inverter duty motors; use filters. • Motor shaft voltages and bearing currents. Measure voltage rotor-to-frame (ground), using stranded wire or a carbon brush. Motors run by sine waves have a "normal" shaft/bear- ing-to-frame voltage of 1 to 2 V. The PWM waveform can cause breakdown voltages of 8 to 15 V to occur between the shaft (more specifically, the bearing) and the frame. This damages bearings, causing pitting and scarring. Many solutions have been proposed, but the most common is the shaft ground- ing device. • Leakage current. Measure with a current clamp around all three phase conductors. High frequencies cause increased leakage between stator windings and the frame. This ground or leak- age current can interfere with control and communi- cation signals. Common solutions are the use of EMI suppression cables or a common mode choke. What about harmonics at the output of the drive? Wouldn’t the PWM-turned-into-sine- wave current-waveform contain a lot of harmonics? Absolutely. But we don’t have to measure these. First of all, they don’t get into the rest of the power distribution system; they only affect the motor. Specifically, they cause addi- tional heating in the motor. However, motor and drive manufacturers have addressed this problem by supplying higher grades of motor insula- tion. In those cases where an older motor is retrofit with an ASD, the recommendation is that the motor full load amp be derated.
- 4. Summary To determine whether it’s the load, the motor, or the drive that is causing problems, it helps to proceed systematically. Start with the basic motor measurements (imbalance) to check the health of the motor itself. Then do some simple drive measurements to check for causes of over or undervolt- age trips. Profile the load to find the cause for intermittent overload trips. Finally, for premature motor bearing or winding failures, as well as control signal interference, use a Fluke ScopeMeter test tool to make additional motor meas- urements. This by no means exhausts all the possible sources of problems, but it will certainly identify a lot of the most common ones. Continued from previous page Work safely The high voltage and currents present in electrical power systems can cause serious injury or death by electrocution and burns. Consequently, only trained, experienced electri- cians who have knowledge of electrical systems in general and the equipment under test should perform testing and modification of electrical systems. Fluke cannot anticipate all possible precautions that you must take when performing the measurements described here. At a minimum, however, you should: • Use appropriate safety equipment such as safety glasses, insulated gloves, insulating mats, etc. • Be sure that all power has been turned off, locked out, and tagged in any situation where you will be in direct contact with circuit compo- nents. Be certain that the power can’t be turned on by anyone but you. • Read and understand all of the applicable manuals before applying the informa- tion in this application note. Take special note of all safety precautions and warnings in the instruction manuals. • Do not use instruments on applications for which they are not intended, and always be aware that if the equipment is used in a manner not specified by the manufacturer, the protection provided by the equipment may be impaired. Fluke.Keeping your world up and running. Fluke Corporation PO Box 9090, Everett, WA USA 98206 Fluke Europe B.V. PO Box 1186, 5602 BD Eindhoven, The Netherlands For more information call: In the U.S.A. (800) 443-5853 or Fax (425) 446-5116 In Europe/M-East/Africa (31 40) 2 675 200 or Fax (31 40) 2 675 222 In Canada (800)-36-FLUKE or Fax (905) 890-6866 From other countries +1 (425) 446-5500 or Fax +1 (425) 446-5116 Web access: http://www.fluke.com/ ©2004 Fluke Corporation. All rights reserved. Printed in U.S.A. 10/2004 1989052 A-US-N Rev B