REVIEW
published: 11 June 2018
doi: 10.3389/fpubh.2018.00149
Frontiers in Public Health | www.frontiersin.org 1 June 2018 | Volume 6 | Article 149
Edited by:
Jimmy Thomas Efird,
University of Newcastle, Australia
Reviewed by:
Aida Turrini,
Consiglio per la Ricerca in Agricoltura
e L’analisi Dell’Economia Agraria
(CREA), Italy
Mary Evelyn Northridge,
New York University, United States
*Correspondence:
Godfred O. Boateng
[email protected]
Specialty section:
This article was submitted to
Epidemiology,
a section of the journal
Frontiers in Public Health
Received: 26 February 2018
Accepted: 02 May 2018
Published: 11 June 2018
Citation:
Boateng GO, Neilands TB,
Frongillo EA, Melgar-Quiñonez HR and
Young SL (2018) Best Practices for
Developing and Validating Scales for
Health, Social, and Behavioral
Research: A Primer.
Front. Public Health 6:149.
doi: 10.3389/fpubh.2018.00149
Best Practices for Developing and
Validating Scales for Health, Social,
and Behavioral Research: A Primer
Godfred O. Boateng1*, Torsten B. Neilands 2, Edward A. Frongillo 3,
Hugo R. Melgar-Quiñonez 4 and Sera L. Young1,5
1 Department of Anthropology and Global Health, Northwestern University, Evanston, IL, United States, 2 Division of
Prevention Science, Department of Medicine, University of California, San Francisco, San Francisco, CA, United States,
3 Department of Health Promotion, Education and Behavior, Arnold School of Public Health, University of South Carolina,
Columbia, SC, United States, 4 Institute for Global Food Security, School of Human Nutrition, McGill University, Montreal, QC,
Canada, 5 Institute for Policy Research, Northwestern University, Evanston, IL, United States
Scale development and validation are critical to much of the work in the health,
social, and behavioral sciences. However, the constellation of techniques required
for scale development and evaluation can be onerous, jargon-filled, unfamiliar, and
resource-intensive. Further, it is often not a part of graduate training. Therefore, our
goal was to concisely review the process of scale development in as straightforward
a manner as possible, both to facilitate the development of new, valid, and reliable
scales, and to help improve existing ones. To do this, we have created a primer for
best practices for scale development in measuring complex phenomena. This is not
a systematic review, but rather the amalgamation of technical literature and lessons
learned from our experiences spent creating or adapting a number of scales over the
past several decades. We identified three phases that span nine steps. In the first phase,
items are generated and the validity of their content is assessed. In the second phase,
the scale is constructed. Steps in scale construction include pre-testing the questions,
administering the survey, reducing the number of items, and understanding how many
factors the scale captures. In the third phase, scale evaluation, the numbe ...
ICT Role in 21st Century Education & its Challenges.pptx
REVIEWpublished 11 June 2018doi 10.3389fpubh.2018.001.docx
1. REVIEW
published: 11 June 2018
doi: 10.3389/fpubh.2018.00149
Frontiers in Public Health | www.frontiersin.org 1 June 2018 |
Volume 6 | Article 149
Edited by:
Jimmy Thomas Efird,
University of Newcastle, Australia
Reviewed by:
Aida Turrini,
Consiglio per la Ricerca in Agricoltura
e L’analisi Dell’Economia Agraria
(CREA), Italy
Mary Evelyn Northridge,
New York University, United States
*Correspondence:
Godfred O. Boateng
2. [email protected]
Specialty section:
This article was submitted to
Epidemiology,
a section of the journal
Frontiers in Public Health
Received: 26 February 2018
Accepted: 02 May 2018
Published: 11 June 2018
Citation:
Boateng GO, Neilands TB,
Frongillo EA, Melgar-Quiñonez HR and
Young SL (2018) Best Practices for
Developing and Validating Scales for
Health, Social, and Behavioral
Research: A Primer.
Front. Public Health 6:149.
doi: 10.3389/fpubh.2018.00149
Best Practices for Developing and
3. Validating Scales for Health, Social,
and Behavioral Research: A Primer
Godfred O. Boateng1*, Torsten B. Neilands 2, Edward A.
Frongillo 3,
Hugo R. Melgar-Quiñonez 4 and Sera L. Young1,5
1 Department of Anthropology and Global Health, Northwestern
University, Evanston, IL, United States, 2 Division of
Prevention Science, Department of Medicine, University of
California, San Francisco, San Francisco, CA, United States,
3 Department of Health Promotion, Education and Behavior,
Arnold School of Public Health, University of South Carolina,
Columbia, SC, United States, 4 Institute for Global Food
Security, School of Human Nutrition, McGill University,
Montreal, QC,
Canada, 5 Institute for Policy Research, Northwestern
University, Evanston, IL, United States
Scale development and validation are critical to much of the
work in the health,
social, and behavioral sciences. However, the constellation of
techniques required
for scale development and evaluation can be onerous, jargon-
filled, unfamiliar, and
resource-intensive. Further, it is often not a part of graduate
training. Therefore, our
goal was to concisely review the process of scale development
in as straightforward
4. a manner as possible, both to facilitate the development of new,
valid, and reliable
scales, and to help improve existing ones. To do this, we have
created a primer for
best practices for scale development in measuring complex
phenomena. This is not
a systematic review, but rather the amalgamation of technical
literature and lessons
learned from our experiences spent creating or adapting a
number of scales over the
past several decades. We identified three phases that span nine
steps. In the first phase,
items are generated and the validity of their content is assessed.
In the second phase,
the scale is constructed. Steps in scale construction include pre-
testing the questions,
administering the survey, reducing the number of items, and
understanding how many
factors the scale captures. In the third phase, scale evaluation,
the number of dimensions
is tested, reliability is tested, and validity is assessed. We have
also added examples of
best practices to each step. In sum, this primer will equip both
scientists and practitioners
5. to understand the ontology and methodology of scale
development and validation,
thereby facilitating the advancement of our understanding of a
range of health, social,
and behavioral outcomes.
Keywords: scale development, psychometric evaluation, content
validity, item reduction, factor analysis, tests of
dimensionality, tests of reliability, tests of validity
INTRODUCTION
Scales are a manifestation of latent constructs; they measure
behaviors, attitudes, and hypothetical
scenarios we expect to exist as a result of our theoretical
understanding of the world, but cannot
assess directly (1). Scales are typically used to capture a
behavior, a feeling, or an action that cannot
be captured in a single variable or item. The use of multiple
items to measure an underlying
latent construct can additionally account for, and isolate, item-
specific measurement error, which
https://www.frontiersin.org/journals/public-health
https://www.frontiersin.org/journals/public-health%23editorial-
board
https://www.frontiersin.org/journals/public-health%23editorial-
board
https://www.frontiersin.org/journals/public-health%23editorial-
board
https://www.frontiersin.org/journals/public-health%23editorial-
board
https://doi.org/10.3389/fpubh.2018.00149
7. development in as straightforward a manner as possible, both
to facilitate the development of new, valid, and reliable scales,
and to help improve existing ones. To do this, we have created
a primer for best practices for scale development. We anticipate
this primer will be broadly applicable across many disciplines,
especially for health, social, and behavioral sciences. This is
not
a systematic review, but rather the amalgamation of technical
literature and lessons learned from our experiences spent
creating
or adapting a number of scales related to multiple disciplines
(10–23).
First, we provide an overview of each of the nine steps. Then,
within each step, we define key concepts, describe the tasks
required to achieve that step, share common pitfalls, and draw
on examples in the health, social, and behavioral sciences to
recommend best practices. We have tried to keep the material as
straightforward as possible; references to the body of technical
work have been the foundation of this primer.
SCALE DEVELOPMENT OVERVIEW
There are three phases to creating a rigorous scale—item
development, scale development, and scale evaluation (24);
these
can be further broken down into nine steps (Figure 1).
Item development, i.e., coming up with the initial set of
questions for an eventual scale, is composed of: (1)
identification
of the domain(s) and item generation, and (2) consideration
of content validity. The second phase, scale development, i.e.,
Abbreviations: A-CASI, audio computer self-assisted
interviewing; ASES,
8. adherence self-efficacy scale; CAPI, computer assisted personal
interviewing;
CFA, confirmatory factor analysis; CASIC, computer assisted
survey information
collection builder; CFI, comparative fit index; CTT, classical
test theory;
DIF, differential item functioning; EFA, exploratory factor
analysis; FIML, full
information maximum likelihood; FNE, fear of negative
evaluation; G, global
factor; ICC, intraclass correlation coefficient; ICM,
Independent cluster model;
IRT, item response theory; ODK, Open Data Kit; PAPI, paper
and pen/pencil
interviewing; QDS, Questionnaire Development System;
RMSEA, root mean
square error of approximation; SAD, social avoidance and
distress; SAS, statistical
analysis systems; SASC-R, social anxiety scale for children
revised; SEM, structural
equation model; SPSS, statistical package for the social
sciences; Stata, statistics
and data; SRMR, standardized root mean square residual of
approximation; TLI,
Tucker Lewis Index;WASH, water, sanitation, and
hygiene;WRMR, weighted root
mean square residual.
FIGURE 1 | An overview of the three phases and nine steps of
scale
development and validation.
turning individual items into a harmonious and measuring
construct, consists of (3) pre-testing questions, (4) sampling and
survey administration, (5) item reduction, and (6) extraction of
9. latent factors. The last phase, scale evaluation, requires: (7)
tests
of dimensionality, (8) tests of reliability, and (9) tests of
validity.
Frontiers in Public Health | www.frontiersin.org 2 June 2018 |
Volume 6 | Article 149
https://www.frontiersin.org/journals/public-health
https://www.frontiersin.org
https://www.frontiersin.org/journals/public-health%23articles
Boateng et al. Scale Development and Validation
TABLE 1 | The three phases and nine steps of scale
development and validation.
Activity Purpose How to explore or estimate? References
PHASE 1: ITEM DEVELOPMENT
Step 1: Identification of Domain and Item Generation: Selecting
Which Items to Ask
Domain
identification
To specify the boundaries of the domain and facilitate
item generation
1.1 Specify the purpose of the domain
1.2 Confirm that there are no existing instruments
10. 1.3 Describe the domain and provide preliminary conceptual
definition
1.4 Specify the dimensions of the domain if they exist a priori
1.5 Define each dimension
(1–4), (25)
Item generation To identify appropriate questions that fit the
identified
domain
1.6 Deductive methods: literature review and assessment of
existing scales
1.7 Inductive methods: exploratory research methodologies
including focus group discussions and interviews
(2–5), (24–41)
Step 2: Content Validity: Assessing if the Items Adequately
Measure the Domain of Interest
Evaluation by
experts
To evaluate each of the items constituting the domain for
content relevance, representativeness, and technical
11. quality
2.1 Quantify assessments of 5-7 expert judges using formalized
scaling and statistical procedures including content validity
ratio, content validity index, or Cohen’s coefficient alpha
2.2 Conduct Delphi method with expert judges
(1–5),
(24, 42–48)
Evaluation by
target population
To evaluate each item constituting the domain for
representativeness of actual experience from target
population
2.3 Conduct cognitive interviews with end users of scale items
to
evaluate face validity
(20, 25)
PHASE 2: SCALE DEVELOPMENT
Step 3: Pre-testing Questions: Ensuring the Questions and
Answers Are Meaningful
12. Cognitive
interviews
To assess the extent to which questions reflect the
domain of interest and that answers produce valid
measurements
3.1 Administer draft questions to 5–15 interviewees in 2–3
rounds
while allowing respondents to verbalize the mental process
entailed in providing answers
(49–54)
Step 4: Survey Administration and Sample Size: Gathering
Enough Data from the Right People
Survey
administration
To collect data with minimum measurement errors 4.1
Administer potential scale items on a sample that reflects
range of target population using paper or device
(55–58)
Establishing the
13. sample size
To ensure the availability of sufficient data for scale
development
4.2 Recommended sample size is 10 respondents per survey
item and/or 200-300 observations
(29, 59–65)
Determining the
type of data to use
To ensure the availability of data for scale development
and validation
4.3 Use cross-sectional data for exploratory factor analysis
4.4 Use data from a second time point, at least 3 months later in
a longitudinal dataset, or an independent sample for test of
dimensionality (Step 7)
–
Step 5: Item Reduction: Ensuring Your Scale Is Parsimonious
Item difficulty index To determine the proportion of correct
answers given per
item (CTT)
14. To determine the probability of a particular examinee
correctly answering a given item (IRT)
5.1 Proportion can be calculated for CTT and item difficulty
parameter estimated for IRT using statistical packages
(1, 2, 66–68)
(Continued)
Frontiers in Public Health | www.frontiersin.org 3 June 2018 |
Volume 6 | Article 149
https://www.frontiersin.org/journals/public-health
https://www.frontiersin.org
https://www.frontiersin.org/journals/public-health%23articles
Boateng et al. Scale Development and Validation
TABLE 1 | Continued
Activity Purpose How to explore or estimate? References
Item discrimination
test
To determine the degree to which an item or set of test
questions are measuring a unitary attribute (CTT)
To determine how steeply the probability of correct
15. response changes as ability increases (IRT)
5.2 Estimate biserial correlations or item discrimination
parameter
using statistical packages
(69–75)
Inter-item and
item-total
correlations
To determine the correlations between scale items, as
well as the correlations between each item and sum
score of scale items
5.3 Estimate inter-item/item communalities, item-total, and
adjusted item-total correlations using statistical packages
(1, 2, 68, 76)
Distractor
efficiency analysis
To determine the distribution of incorrect options and
how they contribute to the quality of items
16. 5.4 Estimate distractor analysis using statistical packages (77–
80)
Deleting or
imputing missing
cases
To ensure the availability of complete cases for scale
development
5.5 Delete items with many cases that are permanently missing,
or use multiple imputation or full information maximum
likelihood for imputation of data
(81–84)
Step 6: Extraction of Factors: Exploring the Number of Latent
Constructs that Fit Your Observed Data
Factor analysis To determine the optimal number of factors or
domains
that fit a set of items
6.1 Use scree plots, exploratory factor analysis, parallel
analysis,
minimum average partial procedure, and/or the Hull method
(2–4), (85–90)
17. PHASE 3: SCALE EVALUTION
Step 7: Tests of Dimensionality: Testing if Latent Constructs
Are as Hypothesized
Test dimensionality To address queries on the latent structure of
scale items
and their underlying relationships. i.e., to validate
whether the previous hypothetical structure fits the items
7.1 Estimate independent cluster model—confirmatory factor
analysis, cf. Table 2
7.2 Estimate bifactor models to eliminate ambiguity about the
type of dimensionality—unidimensionality, bidimensionality, or
multi-dimensionality
7.3 Estimate measurement invariance to determine whether
hypothesized factor and dimension is congruent across
groups or multiple samples
(91–114)
Score scale items To create scale scores for substantive analysis
including
reliability and validity of scale
7.4. calculate scale scores using an unweighted approach, which
18. includes summing standardized item scores and raw item
scores, or computing the mean for raw item scores
7.5. Calculate scale scores by using a weighted approach, which
includes creating factor scores via confirmatory factor
analysis or structural equation models
(115)
Step 8: Tests of Reliability: Establishing if Responses Are
Consistent When Repeated
Calculate reliability
statistics
To assess the internal consistency of the scale. i.e., the
degree to which the set of items in the scale co-vary,
relative to their sum score
8.1 Estimate using Cronbach’s alpha
8.2. Other tests such as Raykov’s rho, ordinal alpha, and
Revelle’s
beta can be used to assess scale reliability
(116–123)
Test–retest
19. reliability
To assess the degree to which the participant’s
performance is repeatable; i.e., how consistent their
scores are across time
8.3 Estimate the strength of the relationship between scale items
over two or three time points; variety of measures possible
(1, 2, 124,
125)
Step 9: Tests of Validity: Ensuring You Measure the Latent
Dimension You Intended
Criterion validity
Predictive validity To determine if scores predict future
outcomes 9.1 Use bivariate and multivariable regression;
stronger and
significant associations or causal effects suggest greater
predictive validity
(1, 2, 31)
(Continued)
Frontiers in Public Health | www.frontiersin.org 4 June 2018 |
Volume 6 | Article 149
20. https://www.frontiersin.org/journals/public-health
https://www.frontiersin.org
https://www.frontiersin.org/journals/public-health%23articles
Boateng et al. Scale Development and Validation
TABLE 1 | Continued
Activity Purpose How to explore or estimate? References
Concurrent validity To determine the extent to which scale
scores have a
stronger relationship with criterion measurements made
near the time of administration
9.2 Estimate the association between scale scores and “gold
standard” of scale measurement; stronger significant
association in Pearson product-moment correlation suggests
support for concurrent validity
(2)
Construct validity
Convergent validity To examine if the same concept measured
in different
ways yields similar results
21. 9.3 Estimate the relationship between scale scores and similar
constructs using multi-trait multi-method matrix, latent
variable modeling, or Pearson product-moment coefficient;
higher/stronger correlation coefficients suggest support for
convergent validity
(2, 37, 126)
Discriminant
validity
To examine if the concept measured is different from
some other concept
9.4 Estimate the relationship between scale scores and distinct
constructs using multi-trait multi-method matrix, latent
variable modeling, or Pearson product-moment coefficient;
lower/weaker correlation coefficients suggest support for
discriminant validity
(2, 37, 126)
Differentiation by
“known groups”
22. To examine if the concept measured behaves as
expected in relation to “known groups”
9.5 Select known binary variables based on theoretical and
empirical knowledge and determine the distribution of the
scale scores over the known groups; use t-tests if binary,
ANOVA if multiple groups
(2, 126)
Correlation
analysis
To determine the relationship between existing measures
or variables and newly developed scale scores
9.6 Correlate scale scores and existing measures or, preferably,
use linear regression, intraclass correlation coefficient, and
analysis of standard deviations of the differences between
scores
(2, 127, 128)
PHASE 1: ITEM DEVELOPMENT
Step 1: Identification of the Domain(s) and
Item Generation
23. Domain Identification
The first step is to articulate the domain(s) that you are
endeavoring to measure. A domain or construct refers to the
concept, attribute, or unobserved behavior that is the target of
the study (25). Therefore, the domain being examined should
be decided upon and defined before any item activity (2). A
well-defined domain will provide a working knowledge of the
phenomenon under study, specify the boundaries of the domain,
and ease the process of item generation and content validation.
McCoach et al. outline a number of steps in scale development;
we find the first five to be suitable for the identification of
domain (4). These are all based on thorough literature review
and
include (a) specifying the purpose of the domain or construct
you seek to develop, and (b), confirming that there are no
existing instruments that will adequately serve the same
purpose.
Where there is a similar instrument in existence, you need to
justify why the development of a new instrument is appropriate
and how it will differ from existing instruments. Then, (c)
describe the domain and provide a preliminary conceptual
definition and (d) specify, if any, the dimensions of the domain.
Alternatively, you can let the number of dimensions forming
the domain to be determined through statistical computation
(cf. Steps 5, 6, and 7). Domains are determined a priori if there
is an established framework or theory guiding the study, but a
posteriori if none exist. Finally, if domains are identified a
priori,
(e) the final conceptual definition for each domain should be
specified.
Item Generation
Once the domain is delineated, the item pool can then be
identified. This process is also called “question development”
(26) or “item generation” (24). There are two ways to identify
24. appropriate questions: deductive and inductive methods (24).
The deductive method, also known as “logical partitioning”
or “classification from above” (27) is based on the description
of
the relevant domain and the identification of items. This can be
done through literature review and assessment of existing scales
and indicators of that domain (2, 24). The inductive method,
also known as “grouping” or “classification from below” (24,
27)
involves the generation of items from the responses of
individuals
(24). Qualitative data obtained through direct observations and
exploratory research methodologies, such as focus groups and
individual interviews, can be used to inductively identify
domain
items (5).
It is considered best practice to combine both deductive and
inductive methods to both define the domain and identify the
questions to assess it. While the literature review provides the
theoretical basis for defining the domain, the use of qualitative
techniques moves the domain from an abstract point to the
identification of its manifest forms. A scale or construct defined
by theoretical underpinnings is better placed to make specific
pragmatic decisions about the domain (28), as the construct will
be based on accumulated knowledge of existing items.
It is recommended that the items identified using deductive
and inductive approaches should be broader and more
comprehensive than one’s own theoretical view of the target
(28, 29). Further, content should be included that ultimately
will
be shown to be tangential or unrelated to the core construct.
In other words, one should not hesitate to have items on the
25. Frontiers in Public Health | www.frontiersin.org 5 June 2018 |
Volume 6 | Article 149
https://www.frontiersin.org/journals/public-health
https://www.frontiersin.org
https://www.frontiersin.org/journals/public-health%23articles
Boateng et al. Scale Development and Validation
scale that do not perfectly fit the domain identified, as
successive
evaluation will eliminate undesirable items from the initial
pool.
Kline and Schinka et al. note that the initial pool of items
developed should be atminimum twice as long as the desired
final
scale (26, 30). Others have recommended the initial pool to be
five
times as large as the final version, to provide the requisite
margin
to select an optimum combination of items (30). We agree with
Kline and Schinka et al. (26, 30) that the number of items
should
be at least twice as long as the desired scale.
Further, in the development of items, the form of the items,
the wording of the items, and the types of responses that the
question is designed to induce should be taken into account.
It also means questions should capture the lived experiences
of the phenomenon by target population (30). Further, items
should be worded simply and unambiguously. Items should not
be offensive or potentially biased in terms of social identity,
i.e., gender, religion, ethnicity, race, economic status, or sexual
orientation (30).
26. Fowler identified five essential characteristics of items
required to ensure the quality of construct measurement (31).
These include (a) the need for items to be consistently
understood; (b) the need for items to be consistently
administered or communicated to respondents; (c) the consistent
communication of what constitutes an adequate answer; (d)
the need for all respondents to have access to the information
needed to answer the question accurately; and (e) the
willingness
for respondents to provide the correct answers required by the
question at all times.
These essentials are sometimes very difficult to achieve.
Krosnick (32) suggests that respondents can be less thoughtful
about the meaning of a question, search their memories less
comprehensively, integrate retrieved information less carefully,
or even select a less precise response choice. All this means
that they are merely satisficing, i.e., providing merely
satisfactory
answers, rather than the most accurate ones. In order to combat
this behavior, questions should be kept simple, straightforward,
and should follow the conventions of normal conversation.
With regards to the type of responses to these questions,
we recommend that questions with dichotomous response
categories (e.g., true/false) should have no ambiguity. When a
Likert-type response scale is used, the points on the scale
should
reflect the entire measurement continuum. Responses should
be presented in an ordinal manner, i.e., in an ascending order
without any overlap, and each point on the response scale
should
be meaningful and interpreted the same way by each participant
to ensure data quality (33).
In terms of the number of points on the response scale,
27. Krosnick and Presser (33) showed that responses with just two
to three points have lower reliability than Likert-type response
scales with five to seven points. However, the gain levels off
after seven points. Therefore, response scales with five points
are
recommended for unipolar items, i.e., those reflecting relative
degrees of a single item response quality, e.g., not at all
satisfied to
very satisfied. Seven response items are recommended for
bipolar
items, i.e., those reflecting relative degrees of two qualities of
an
item response scale, e.g., completely dissatisfied to completely
satisfied. As an analytic aside, items with scale points fewer
than five categories are best estimated using robust categorical
methods. However, items with five to seven categories without
strong floor or ceiling effects can be treated as continuous items
in confirmatory factor analysis and structural equation modeling
using maximum likelihood estimations (34).
One pitfall in the identification of domain and item
generation is the improper conceptualization and definition of
the domain(s). This can result in scales that may either be
deficient because the definition of the domain is ambiguous
or has been inadequately defined (35). It can also result in
contamination, i.e., the definition of the domain overlaps with
other existing constructs in the same field (35).
Caution should also be taken to avoid construct
underrepresentation, which is when a scale does not capture
important aspects of a construct because its focus is too narrow
(35, 36). Further, construct-irrelevant variance, which is the
degree to which test scores are influenced by processes that
have
little to do with the intended construct and seem to be widely
28. inclusive of non-related items (36, 37), should be avoided. Both
construct underrepresentation and irrelevant variance can lead
to the invalidation of the scale (36).
An example of best practice using the deductive approach to
item generation is found in the work of Dennis on breastfeeding
self-efficacy (38–40). Dennis’ breastfeeding self-efficacy scale
items were first informed by Bandura’s theory on self-efficacy,
followed by content analysis of literature review, and empirical
studies on breastfeeding-related confidence.
A valuable example for a rigorous inductive approach is found
in the work of Frongillo and Nanama on the development and
validation of an experience-based measure of household food
insecurity in northern Burkina Faso (41). In order to generate
items for the measure, they undertook in-depth interviews with
10 household heads and 26 women using interview guides. The
data from these interviews were thematically analyzed, with the
results informing the identification of items to be added or
deleted from the initial questionnaire. Also, the interviews led
to
the development and revision of answer choices.
Step 2: Content Validity
Content validity, also known as “theoretical analysis” (5), refers
to the “adequacy with which a measure assesses the domain
of interest” (24). The need for content adequacy is vital if the
items are to measure what they are presumed to measure (1).
Additionally, content validity specifies content relevance and
content representations, i.e., that the items capture the relevant
experience of the target population being examined (129).
Content validity entails the process of ensuring that only
the phenomenon spelled out in the conceptual definition, but
not other aspects that “might be related but are outside the
investigator’s intent for that particular [construct] are added”
29. (1). Guion has proposed five conditions that must be satisfied
in order for one to claim any form of content validity. We find
these conditions to be broadly applicable to scale development
in any discipline. These include that (a) the behavioral content
has a generally accepted meaning or definition; (b) the domain
is unambiguously defined; (c) the content domain is relevant to
the purposes of measurement; (d) qualified judges agree that the
Frontiers in Public Health | www.frontiersin.org 6 June 2018 |
Volume 6 | Article 149
https://www.frontiersin.org/journals/public-health
https://www.frontiersin.org
https://www.frontiersin.org/journals/public-health%23articles
Boateng et al. Scale Development and Validation
domain has been adequately sampled based on consensus; and
(e) the response content must be reliably observed and
evaluated
(42). Therefore, content validity requires evidence of content
relevance, representativeness, and technical quality.
Content validity is mainly assessed through evaluation by
expert and target population judges.
Evaluation by Experts
Expert judges are highly knowledgeable about the domain of
interest and/or scale development; target population judges are
potential users of the scale (1, 5). Expert judges seem to be used
more often than target-population judges in scale development
work to date. Ideally, one should combine expert and target
population judgment. When resources are constrained, however,
we recommend at least the use of expert judges.
30. Expert judges evaluate each of the items to determine whether
they represent the domain of interest. These expert judges
should be independent of those who developed the item pool.
Expert judgment can be done systematically to avoid bias in the
assessment of items. Multiple judges have been used (typically
ranging from 5 to 7) (25). Their assessments have been
quantified
using formalized scaling and statistical procedures such as the
content validity ratio for quantifying consensus (43), content
validity index for measuring proportional agreement (44), or
Cohen’s coefficient kappa (k) for measuring inter-rater or
expert
agreement (45). Among the three procedures, we recommend
Cohen’s coefficient kappa, which has been found to be most
efficient (46). Additionally, an increase in the number of
experts
has been found to increase the robustness of the ratings (25,
44).
Another way by which content validity can be assessed
through expert judges is by using the Delphi method to come to
a
consensus on which questions are a reflection of the construct
you want to measure. The Delphi method is a technique “for
structuring group communication process so that the process is
effective in allowing a group of individuals, as a whole, to deal
with a complex problem” (47).
A good example of evaluation of content validity using expert
judges is seen in the work of Augustine et al. on adolescent
knowledge of micronutrients (48). After identifying a list of
items
to be validated, the authors consulted experts in the field of
nutrition, psychology, medicine, and basic sciences. The items
were then subjected to content analysis using expert judges.
Two
31. independent reviews were carried out by a panel of five experts
to select the questions that were appropriate, accurate, and
interpretable. Items were either accepted, rejected, or modified
based on majority opinion (48).
Evaluation by Target Population
Target population judges are experts at evaluating face validity,
which is a component of content validity (25). Face validity is
the “degree that respondents or end users [or lay persons] judge
that the items of an assessment instrument are appropriate to the
targeted construct and assessment objectives” (25). These end-
users are able to tell whether the construct is a good measure
of the domain through cognitive interviews, which we discuss in
Step 3.
An example of the concurrent use of expert and target
population judges comes from Boateng et al.’s work to develop
a household-level water insecurity scale appropriate for use in
western Kenya (20). We used the Delphi method to obtain three
rounds of feedback from international experts including those
in hydrology, geography, WASH and water-related programs,
policy implementation, and food insecurity. Each of the three
rounds was interspersed with focus group discussions with our
target population, i.e., people living in western Kenya. In each
round, the questionnaires progressively became more closed
ended, until consensus was attained on the definition of the
domain we were studying and possible items we could use.
PHASE 2: SCALE DEVELOPMENT
Step 3: Pre-testing Questions
Pre-testing helps to ensure that items are meaningful to the
target population before the survey is actually administered,
i.e.,
it minimizes misunderstanding and subsequent measurement
error. Because pre-testing eliminates poorly worded items and
32. facilitates revision of phrasing to bemaximally understood, it
also
serves to reduce the cognitive burden on research participants.
Finally, pre-testing represents an additional way in which
members of the target population can participate in the research
process by contributing their insights to the development of the
survey.
Pre-testing has two components: the first is the examination
of the extent to which the questions reflect the domain
being studied. The second is the examination of the extent
to which answers to the questions asked produce valid
measurements (31).
Cognitive Interviews
To evaluate whether the questions reflect the domain of
study and meet the requisite standards, techniques including
cognitive interviews, focus group discussion, and field pre-
testing
under realistic conditions can be used. We describe the most
recommended, which is cognitive interviews.
Cognitive interviewing entails the administration of draft
survey questions to target populations and then asking the
respondents to verbalize the mental process entailed in
providing
such answers (49). Generally, cognitive interviews allow for
questions to be modified, clarified, or augmented to fit the
objectives of the study. This approach helps to determine
whether
the question is generating the information that the author
intends
by helping to ensure that respondents understand questions as
developers intended and that respondents are able to answer
in a manner that reflects their experience (49, 50). This can
be done on a sample outside of the study population or on a
33. subset of study participants, but it must be explored before the
questionnaire is finalized (51, 52).
The sample used for cognitive interviewing should capture the
range of demographics you anticipate surveying (49). A range
of 5–15 interviews in two to three rounds, or until saturation,
or relatively few new insights emerge is considered ideal for
pre-testing (49, 51, 52).
Frontiers in Public Health | www.frontiersin.org 7 June 2018 |
Volume 6 | Article 149
https://www.frontiersin.org/journals/public-health
https://www.frontiersin.org
https://www.frontiersin.org/journals/public-health%23articles
Boateng et al. Scale Development and Validation
In sum, cognitive interviews get to the heart of both assessing
the appropriateness of the question to the target population
and the strength of the responses (49). The advantages of
using cognitive interviewing include: (a) it ensures questions
are
producing the intended data, (b) questions that are confusing
to participants are identified and improved for clarity, (c)
problematic questions or questions that are difficult to answer
are identified, (d) it ensures response options are appropriate
and adequate, (e) it reveals the thought process of participants
on domain items, and (f) it can indicate problematic question
order (52, 53). Outcomes of cognitive interviews should
always be reported, along with solutions used to remedy the
situation.
An example of best practice in pre-testing is seen in the work
of Morris et al. (54). They developed and validated a novel
34. scale
for measuring interpersonal factors underlying injection drug
use
behaviors among injecting partners. After item development and
expert judgment, they conducted cognitive interviews with
seven
respondents with similar characteristics to the target population
to refine and assess item interpretation and to finalize item
structure. Eight items were dropped after cognitive interviews
for
lack of clarity or importance. They also made modifications to
grammar, word choice, and answer options based on the
feedback
from cognitive interviews.
Step 4: Survey Administration and Sample
Size
Survey Administration
Collecting data with minimum measurement errors from
an adequate sample size is imperative. These data can be
collected using paper and pen/pencil interviewing (PAPI) or
Computer Assisted Personal Interviewing (CAPI) on devices
like laptops, tablets, or phones. A number of software
programs exist for building forms on devices. These include
Computer Assisted Survey Information Collection (CASIC)
BuilderTM (West Portal Software Corporation, San Francisco,
CA); Qualtrics Research CoreTM (www.qualtrics.com); Open
Data Kit (ODK, https://opendatakit.org/); Research Electronic
Data Capture (REDCap) (55); SurveyCTO (Dobility, Inc.
https://www.surveycto.com); and Questionnaire Development
SystemTM (QDS, www.novaresearch.com), which allows the
participant to report sensitive audio data.
Each approach has advantages and drawbacks. Using
technology can reduce the errors associated with data entry,
allow the collection of data from large samples with minimal
35. cost, increase response rate, reduce enumerator errors, permit
instant feedback, and increase monitoring of data collection
and ability to get more confidential data (56–58, 130). A subset
of technology-based programs offers the option of attaching
audio files to the survey questions so that questions may be
recorded and read out loud to participants with low literacy
via audio computer self-assisted interviewing (A-CASI) (131).
Self-interviewing, whether via A-CASI or via computer-assisted
personal interviewing, in which participants read and respond
to questions on a computer without interviewer involvement,
may increase reports of sensitive or stigmatized behaviors such
as sexual behaviors and substance use, compared to when being
asked by another human.
On the other hand, paper forms may avert the crisis of losing
data if the software crashes, the devices are lost or stolen prior
to being backed up, and may be more suitable in areas that
have irregular electricity and/or internet. However, as sample
sizes increase, the use of PAPI becomes more expensive, time
and labor intensive, and the data are exposed in several ways to
human error (57, 58). Based on the merits of CAPI over PAPI,
we
recommend researchers use CAPI in data collection for surveys
when feasible.
Establishing the Sample Size
The sample size to use for the development of a latent construct
has often been contentious. It is recommended that potential
scale items be tested on a heterogeneous sample, i.e., a sample
that
both reflects and captures the range of the target population
(29).
For example, when the scale is used in a clinical setting, Clark
and
Watson recommend using patient samples early on instead of a
36. sample from the general population (29).
The necessary sample size is dependent on several aspects
of any given study, including the level of variation between the
variables, and the level of over-determination (i.e., the ratio of
variables to number of factors) of the factors (59). The rule of
thumb has been at least 10 participants for each scale item, i.e.,
an
ideal ratio of respondents to items is 10:1 (60). However, others
have suggested sample sizes that are independent of the number
of survey items. Clark and Watson (29) propose using 300
respondents after initial pre-testing. Others have recommended
a range of 200–300 as appropriate for factor analysis (61, 62).
Based on their simulation study using different sample sizes,
Guadagnoli and Velicer (61) suggested that a minimum of
300–450 is required to observe an acceptable comparability of
patterns, and that replication is required if the sample size is
<300. Comrey and Lee suggest a graded scale of sample sizes
for
scale development: 100 = poor, 200 = fair, 300 = good, 500 =
very good, ≥1,000 = excellent (63). Additionally, item reduction
procedures (described, below in Step 5), such as parallel
analysis
which requires bootstrapping (estimating statistical parameters
from sample by means of resampling with replacement) (64),
may require larger data sets.
In sum, there is no single item-ratio that works for all survey
development scenarios. A larger sample size or respondent:
item ratio is always better, since a larger sample size implies
lower measurement errors and more, stable factor loadings,
replicable factors, and generalizable results to the true
population
structure (59, 65). A smaller sample size or respondent: item
ratio
may mean more unstable loadings and factors, random, non-
37. replicable factors, and non-generalizable results (59, 65).
Sample
size is, however, always constrained by resources available, and
more often than not, scale development can be difficult to fund.
Determining the Type of Data to Use
The development of a scale minimally requires data from a
single
point in time. To fully test for the reliability of the scale (cf.
Steps
8, 9), however, either an independent dataset or a subsequent
time point is necessary. Data from longitudinal studies can be
Frontiers in Public Health | www.frontiersin.org 8 June 2018 |
Volume 6 | Article 149
www.qualtrics.com
https://opendatakit.org/
https://www.surveycto.com
www.novaresearch.com
https://www.frontiersin.org/journals/public-health
https://www.frontiersin.org
https://www.frontiersin.org/journals/public-health%23articles
Boateng et al. Scale Development and Validation
used for initial scale development (e.g., from baseline), to
conduct
confirmatory factor analysis (using follow-up data, cf. Step 7),
and to assess test–retest reliability (using baseline and follow-
up data). The problem with using longitudinal data to test
hypothesized latent structures is common error variance, since
the same, potentially idiosyncratic, participants will be
involved.
To give the most credence to the reliability of scale, the ideal
38. procedure is to develop the scale on sample A, whether cross-
sectional or longitudinal, and then test it on an independent
sample B.
The work of Chesney et al. on the Coping Self-Efficacy
scale provides an example of this best practice in the use of
independent samples (132). This study sought to investigate the
psychometric characteristics of the Coping Self-Efficacy (CSE)
scale, and their samples came from two independent randomized
clinical trials. As such, two independent samples with four
different time points each (0, 3, 6, and 12 months) were used.
The authors administered the 26-item scale to the sample from
the first clinical trial and examined the covariance that existed
between all the scale items (exploratory factor analysis) giving
the
hypothesized factor structure across time in that one trial. The
obtained factor structure was then fitted to baseline data from
the
second randomized clinical trial to test the hypothesized factor
structure generated in the first sample (132).
Step 5: Item Reduction Analysis
In scale development, item reduction analysis is conducted
to ensure that only parsimonious, functional, and internally
consistent items are ultimately included (133). Therefore, the
goal
of this phase is to identify items that are not or are the least-
related to the domain under study for deletion or modification.
Two theories, Classical Test Theory (CTT) and the Item
Response Theory (IRT), underpin scale development (134). CTT
is considered the traditional test theory and IRT the modern test
theory; both function to produce latent constructs. Each theory
may be used singly or in conjunction to complement the other’s
strengths (15, 135). Whether the researcher is using CTT or
IRT,
39. the primary goal is to obtain functional items (i.e., items that
are
correlated with each other, discriminate between individual
cases,
underscore a single or multidimensional domain, and contribute
significantly to the construct).
CTT allows the prediction of outcomes of constructs and the
difficulty of items (136). CTT models assume that items
forming
constructs in their observed, manifest forms consist of a true
score on the domain of interest and a random error (which is
the differences between the true score and a set of observed
scores by an individual) (137). IRT seeks to model the way in
which constructs manifest themselves in terms of observable
item response (138). Comparatively, the IRT approach to scale
development has the advantage of allowing the researcher to
determine the effect of adding or deleting a given item or set
of items by examining the item information and standard error
functions for the item pool (138).
Several techniques exist within the two theories to reduce
the item pool, depending on which test theory is driving the
scale. The five major techniques used are: item difficulty and
item
discrimination indices, which are primarily for binary
responses;
inter-item and item-total correlations, which are mostly used for
categorical items; and distractor efficiency analysis for items
with
multiple choice response options (1, 2).
Item Difficulty Index
The item difficulty index is both a CTT and an IRT parameter
that
40. can be traced largely to educational and psychological testing to
assess the relative difficulties and discrimination abilities of
test
items (66). Subsequently, this approach has been applied to
more
attitudinal-type scales designed to measure latent constructs.
Under the CTT framework, the item difficulty index, also
called item easiness, is the proportion of correct answers on a
given item, e.g., the proportion of correct answers on a math
test (1, 2). It ranges between 0.0 and 1.0. A high difficulty
score
means a greater proportion of the sample answered the question
correctly. A lower difficulty score means a smaller proportion
of
the sample understood the question and answered correctly.
This
may be due to the item being coded wrongly, ambiguity with the
item, confusing language, or ambiguity with response options.
A
lower difficulty score suggests a need tomodify the items or
delete
them from the pool of items.
Under the IRT framework, the item difficulty parameter is
the probability of a particular examinee correctly answering any
given item (67). This has the advantage of allowing the
researcher
to identify the different levels of individual performance on
specific questions, as well as develop particular questions
to specific subgroups or populations (67). Item difficulty is
estimated directly using logistic models instead of proportions.
Researchers must determine whether they need items with
low, medium, or high difficulty. For instance, researchers
interested in general purpose scales will focus on items with
41. medium difficulty (68), i.e., the proportion with item assertions
ranging from 0.4 to 0.6 (2, 68). The item difficulty index can be
calculated using existing commands in Mplus, R, SAS, SPSS, or
Stata.
Item Discrimination Index
The item discrimination index (also called item-effectiveness
test), is the degree to which an item correctly differentiates
between respondents or examinees on a construct of interest
(69),
and can be assessed under both CTT and IRT frameworks. It
is a measure of the difference in performance between groups
on a construct. The upper group represents participants with
high scores and the lower group those with poor or low scores.
The item discrimination index is “calculated by subtracting the
proportion of examinees in the lower group (lower %) from the
proportion of examinees in the upper group (upper %) who got
the item correct or endorsed the item in the expected manner”
(69). It differentiates between the number of students in an
upper
group who get an item correct and the number of students in
a lower group who get the item correct (70). The use of an
item discrimination index enables the identification of
positively
discriminating items (i.e., items that differentiate rightly
between
those who are knowledgeable about a subject and those who are
not), negatively discriminating items (i.e., items which are
poorly
designed such that the more knowledgeable get them wrong and
the less knowledgeable get them right), and non-discriminating
Frontiers in Public Health | www.frontiersin.org 9 June 2018 |
Volume 6 | Article 149
https://www.frontiersin.org/journals/public-health
42. https://www.frontiersin.org
https://www.frontiersin.org/journals/public-health%23articles
Boateng et al. Scale Development and Validation
item (i.e., items that fail to differentiate between participants
who
are knowledgeable about a subject and those who are not) (70).
The item discrimination index has been found to improve
test items in at least three ways. First, non-discriminating items,
which fail to discriminate between respondents because they
may be too easy, too hard, or ambiguous, should be removed
(71). Second, items which negatively discriminate, e.g., items
which fail to differentiate rightly between medically diagnosed
depressed and non-depressed respondents on a happiness scale,
should be reexamined and modified (70, 71). Third, items that
positively discriminate should be retained, e.g., items that are
correctly affirmed by a greater proportion of respondents who
are medically free of depression, with very low affirmation
by respondents diagnosed to be medically depressed (71). In
some cases, it has been recommended that such positively
discriminating items be considered for revision (70) as the
differences could be due to the level of difficulty of the item.
An item discrimination index can be calculated through
correlational analysis between the performance on an item and
an overall criterion (69) using either the point biserial
correlation
coefficient or the phi coefficient (72).
Item discrimination under the IRT framework is a slope
parameter that determines how steeply the probability of a
correct response changes as the proficiency or trait increases
(73). This allows differentiation between individuals with
43. similar
abilities and can also be estimated using a logistic model. Under
certain conditions, the biserial correlation coefficient under the
CTT framework has proven to be identical to the IRT item
discrimination parameter (67, 74, 75); thus, as the trait
increases
so does the probability of endorsing an item. These parameters
can be computed using existing commands in Mplus, R, SAS,
SPSS, or Stata. In both CTT and IRT, higher values are
indicators
of greater discrimination (73).
Inter-item and Item-Total Correlations
A third technique to support the deletion ormodification of
items
is the estimation of inter-item and item-total correlations, which
falls under CTT. These correlations often displayed in the form
of a matrix are used to examine relationships that exist between
individual items in a pool.
Inter-item correlations (also known as polychoric correlations
for categorical variables and tetrachoric correlations for binary
items) examines the extent to which scores on one item are
related to scores on all other items in a scale (2, 68, 76). Also,
it examines the extent to which items on a scale are assessing
the
same content (76). Items with very low correlations (<0.30) are
less desirable and could be a cue for potential deletion from the
tentative scale.
Item-total correlations (also known as polyserial correlations
for categorical variables and biserial correlations for binary
items)
aim at examining the relationship between each item vs. the
total
score of scale items. However, the adjusted item-total
44. correlation,
which examines the correlation between the item and the sum
score of the rest of the items excluding itself is preferred (1, 2).
Items with very low adjusted item-total correlations (<0.30) are
less desirable and could be a cue for potential deletion from
the tentative scale. Inter-item and item total correlations can be
calculated using Mplus, R, SAS, SPSS, or Stata.
Distractor Efficiency Analysis
The distractor efficiency analysis shows the distribution of
incorrect options and how they contribute to the quality of a
multiple-choice item (77). The incorrect options, also known as
distractors, are intentionally added in the response options to
attract students who do not know the correct answer in a test
question (78). To calculate this, respondents will be grouped
into three groups—high, middle, and lower tertiles based on
their total scores on a set of items. Items will be regarded as
appropriate if 100% of those in the high group choose the
correct response options, about 50% of those in the middle
choose the correct option, and few or none in the lower group
choose the correct option (78). This type of analysis is rarely
used in the health sciences, as most multiple-choice items are
on a Likert-type response scale and do not test respondent
correct knowledge, but their experience or perception. However,
distractor analysis can help to determine whether items are
well-constructed, meaningful, and functional when researchers
add response options to questions that do not fit a particular
experience. It is expected that participants who are determined
as having poor knowledge or experience on the construct will
choose the distractors, while those with the right knowledge
and experience will choose the correct response options (77,
79).
Where those with the right knowledge and experience are not
able to differentiate between distractors and the right response,
the questionmay have to be modified. Non-functional distractors
45. identified need to be removed and replaced with efficient
distractors (80).
Missing Cases
In addition to these techniques, some researchers opt to delete
items with large numbers of cases that are missing, when other
missing data-handling techniques cannot be used (81). For cases
where modern missing data handling can be used, however,
several techniques exist to solve the problem of missing cases.
Two of the approaches have proven to be very useful for scale
development: full information maximum likelihood (FIML) (82)
andmultiple imputation (83). Bothmethods can be applied using
existing commands in statistical packages such as Mplus, R,
SAS,
and Stata. When using multiple imputation to recover missing
data in the context of survey research, the researcher can impute
individual items prior to computing scale scores or impute the
scale scores from other scale scores (84). However, item-level
imputation has been shown to produce more efficient estimates
over scale-level imputation. Thus, imputing individual items
before scale development is a preferred approach to imputing
newly developed scales for missing cases (84).
Step 6: Extraction of Factors
Factor extraction is the phase in which the optimal number of
factors, sometimes called domains, that fit a set of items are
determined. This is done using factor analysis. Factor analysis
is a regression model in which observed standardized variables
are regressed on unobserved (i.e., latent) factors. Because the
Frontiers in Public Health | www.frontiersin.org 10 June 2018 |
Volume 6 | Article 149
https://www.frontiersin.org/journals/public-health
https://www.frontiersin.org
https://www.frontiersin.org/journals/public-health%23articles
46. Boateng et al. Scale Development and Validation
variables and factors are standardized, the bivariate regression
coefficients are also correlations, representing the loading of
each
observed variable on each factor. Thus, factor analysis is used
to
understand the latent (internal) structure of a set of items, and
the
extent to which the relationships between the items are
internally
consistent (4). This is done by extracting latent factors which
represent the shared variance in responses among the multiple
items (4). The emphasis is on the number of factors, the
salience
of factor loading estimates, and the relative magnitude of
residual
variances (2).
A number of analytical processes have been used to determine
the number of factors to retain from a list of items, and it is
beyond the scope of this paper to describe all of them. For
scale development, commonly available methods to determine
the number of factors to retain include a scree plot (85), the
variance explained by the factor model, and the pattern of factor
loadings (2). Where feasible, researchers could also assess the
optimal number of factors to be drawn from the list of items
using
either parallel analysis (86), minimum average partial procedure
(87), or the Hull method (88, 89).
The extraction of factors can also be used to reduce items.
With factor analysis, items with factor loadings or slope
coefficients that are below 0.30 are considered inadequate as
47. they contribute<10% variation of the latent construct measured.
Hence, it is often recommended to retain items that have factor
loadings of 0.40 and above (2, 60). Also, items with cross-
loadings
or that appear not to load uniquely on individual factors can be
deleted. For single-factor models in which Rasch IRTmodeling
is
used, items are selected as having a good fit based onmean-
square
residual summary statistics (infit and outfit) >0.4 and <1.6 (90).
A number of scales developed stop at this phase and jump
to tests of reliability, but the factors extracted at this point only
provide a hypothetical structure of the scale. The dimensionality
of these factors need to be tested (cf. Step 7) before moving on
to
reliability (cf. Step 8) and validity (cf. Step 9) assessment.
PHASE 3: SCALE EVALUATION
Step 7: Tests of Dimensionality
The test of dimensionality is a test in which the hypothesized
factors or factor structure extracted from a previous model is
tested at a different time point in a longitudinal study or,
ideally,
on a new sample (91). Tests of dimensionality determine
whether
the measurement of items, their factors, and function are the
same across two independent samples or within the same sample
at different time points. Such tests can be conducted using
independent cluster model (ICM)-confirmatory factor analysis,
bifactor modeling, or measurement invariance.
Confirmatory Factor Analysis
Confirmatory factor analysis is a form of psychometric
assessment that allows for the systematic comparison of an
48. alternative a priori factor structure based on systematic fit
assessment procedures and estimates the relationship between
latent constructs, which have been corrected for measurement
errors (92). Morin et al. (92) note that it relies on a highly
restrictive ICM, in which cross-loadings between items and
non-
target factors are assumed to be exactly zero. The systematic
fit assessment procedures are determined by meaningful
satisfactory thresholds; Table 2 contains the most common
techniques for testing dimensionality. These techniques include
the chi-square test of exact fit, Root Mean Square Error of
Approximation (RMSEA ≤ 0.06), Tucker Lewis Index (TLI ≥
0.95), Comparative Fit Index (CFI ≥ 0.95), Standardized Root
Mean Square Residual (SRMR≤ 0.08), andWeighted Root Mean
Square Residual (WRMR≤ 1.0) (90, 92–101).
Bifactor Modeling
Bifactor modeling, also referred to as nested factor modeling, is
a form of item response theory used in testing dimensionality
of a scale (102, 103). This method can be used when the
hypothesized factor structure from the previous model produces
partially overlapping dimensions so that one could be seeing
most of the items loading onto one factor and a few items
loading onto a second and/or a third factor. The bifactor
model allows researchers to estimate a unidimensional construct
while recognizing the multidimensionality of the construct (104,
105). The bifactor model assumes each item loads onto two
dimensions, i.e., items forming the construct may be associated
with more than one source of true score variance (92). The
first is a general latent factor that underlies all the scale items
and the second, a group factor (subscale). A “bifactor model
is based on the assumption that a f -factor solution exists for a
set of n items with one [general]/Global (G) factor and f – 1
Specific (S) factors also called group factors” (92). This
approach
49. allows researchers to examine any distortion that may occur
when unidimensional IRT models are fit to multidimensional
data (104, 105). To determine whether to retain a construct as
unidimensional or multidimensional, the factor loadings from
the general factor are then compared to those from the group
factors (103, 106).Where the factor loadings on the general
factor
are significantly larger than the group factors, a unidimensional
scale is implied (103, 104). This method is assessed based on
meaningful satisfactory thresholds. Alternatively, one can test
for
the coexistence of a general factor that underlies the construct
and multiple group factors that explain the remaining variance
not explained by the general factor (92). Each of these methods
can be done using statistical software such asMplus, R, SAS,
SPSS,
or Stata.
Measurement Invariance
Another method to test dimensionality is measurement
invariance, also referred to as factorial invariance or
measurement equivalence (107). Measurement invariance
concerns the extent to which the psychometric properties
of the observed indicators are transportable (generalizable)
across groups or over time (108). These properties include the
hypothesized factor structure, regression slopes, intercept, and
residual variances. Measurement invariance is tested
sequentially
at five levels—configural, metric, scalar, strict (residual),
and structural (107, 109). Of key significance to the test of
dimensionality is configural invariance, which is concerned
with
whether the hypothesized factor structure is the same across
Frontiers in Public Health | www.frontiersin.org 11 June 2018 |
Volume 6 | Article 149
50. https://www.frontiersin.org/journals/public-health
https://www.frontiersin.org
https://www.frontiersin.org/journals/public-health%23articles
Boateng et al. Scale Development and Validation
TABLE 2 | Description of model fit indices and thresholds for
evaluating scales developed for health, social, and behavioral
research.
Model fit indices Description Recommended threshold to use
References
Chi-square test The chi-square value is a test statistic of the
goodness of
fit of a factor model. It compares the observed
covariance matrix with a theoretically proposed
covariance matrix
Chi-square test of model fit has been assessed to be
overly sensitive to sample size and to vary when dealing
with non-normal variables. Hence, the use of non-normal
data, a small sample size (n =180–300), and highly
correlated items make the chi-square approximation
inaccurate. An alternative to this is to use the
51. Satorra-Bentler scaled (mean-adjusted) difference
chi-squared statistic. The DIFFTEST has been
recommended for models with binary and ordinal
variables
(2, 93)
Root Mean Squared
Error of Approximation
(RMSEA)
RMSEA is a measure of the estimated discrepancy
between the population and model-implied population
covariance matrices per degree of freedom (139).
Browne and Cudeck recommend RMSEA ≤ 0.05 as
indicative of close fit, 0.05 ≤ RMSEA ≤ 0.08 as
indicative of fair fit, and values >0.10 as indicative of
poor fit between the hypothesized model and the
observed data. However, Hu and Bentler have
suggested RMSEA ≤ 0.06 may indicate a good fit
(26, 96–100)
52. Tucker Lewis Index
(TLI)
TLI is based on the idea of comparing the proposed
factor model to a model in which no interrelationships at
all are assumed among any of the items
Bentler and Bonnett suggest that models with overall fit
indices of <0.90 are generally inadequate and can be
improved substantially. Hu and Bentler recommend
TLI ≥ 0.95
(95–98)
Comparative Fit Index
(CFI)
CFI is an incremental relative fit index that measures the
relative improvement in the fit of a researcher’s model
over that of a baseline model
CFI ≥ 0.95 is often considered an acceptable fit (95–98)
Standardized Root
Mean Square Residual
53. (SRMR)
SRMR is a measure of the mean absolute correlation
residual, the overall difference between the observed and
predicted correlations
Threshold for acceptable model fit is SRMR ≤ 0.08 (95–98)
Weighted Root Mean
Square Residual
(WRMR)
WRMR uses a “variance-weighted approach especially
suited for models whose variables measured on different
scales or have widely unequal variances” (139); it has
been assessed to be most suitable in assessing models
fitted to binary and ordinal data
Yu recommends a threshold of WRMR <1.0 for
assessing model fit. This index is used for confirmatory
factor analysis and structural equation models with
binary and ordinal variables
(101)
54. Standard of Reliability
for scales
A reliability of 0.90 is the minimum recommended
threshold that should be tolerated while a reliability of
0.95 should be the desirable standard. While the ideal
has rarely been attained by most researchers, a reliability
coefficient of 0.70 has often been accepted as
satisfactory for most scales
Nunnally recommends a threshold of ≥0.90 for
assessing internal consistency for scales
(117, 123)
groups. This assumption has to be met in order for subsequent
tests to be meaningful (107, 109). For example, a hypothesized
unidimensional structure, when tested across multiple countries,
should be the same. This can be tested in CTT, using multigroup
confirmatory factor analysis (110–112).
An alternative approach to measurement invariance in the
testing of unidimensionality under item response theory is the
Rasch measurement model for binary items and polytomous IRT
models for categorical items. Here, emphasis is on testing the
differential item functioning (DIF)—an indicator of whether “a
group of respondents is scoring better than another group of
respondents on an item or a test after adjusting for the overall
ability scores of the respondents” (108, 113). This is analogous
55. to the conditions underpinning measurement invariance in a
multi-group CFA (108, 113).
Whether the hypothesized structure is bidimensional or
multidimensional, each dimension in the structure needs to be
tested again to confirm its unidimensionality. This can also be
done using confirmatory factor analysis. Appropriate model fit
indices and the strength of factor loadings (cf. Table 2) are
the basis on which the latent structure of the items can be
judged.
One commonly encountered pitfall is a lack of satisfactory
global model fit in confirmatory factor analysis conducted on
a new sample following a satisfactory initial factor analysis
performed on a previous sample. Lack of satisfactory fit offers
the opportunity to identify additional underperforming items
for removal. Items with very poor loadings (≤0.3) can be
considered for removal. Also, modification indices, produced
by Mplus and other structural equation modeling (SEM)
programs, can help identify items that need to be modified.
Sometimes a higher-order factor structure, where correlations
among the original factors can be explained by one or more
higher-order factors, is needed. This can also be assessed
using statistical software such as Mplus, R, SAS, SPSS, or
Stata.
A good example of best practice is seen in the work of
Pushpanathan et al. on the appropriateness of using a traditional
Frontiers in Public Health | www.frontiersin.org 12 June 2018 |
Volume 6 | Article 149
https://www.frontiersin.org/journals/public-health
https://www.frontiersin.org
https://www.frontiersin.org/journals/public-health%23articles
56. Boateng et al. Scale Development and Validation
confirmatory factor analysis or a bifactormodel (114) in
assessing
whether the Parkinson’s Disease Sleep Scale-Revised was better
used as a unidimensional scale, a tri-dimensional scale, or a
scale
that has an underlying general factor and three group factors
(sub-scales). They tested this using three different models—
a unidimensional model (1-factor CFA); a 3-factor model (3
factor CFA) consisting of sub-scales measuring insomnia, motor
symptoms and obstructive sleep apnea, and REM sleep behavior
disorder; and a confirmatory bifactor model having a general
factor and the same three sub-scales combined. The results of
this
study suggested that only the bifactor model with a general
factor
and the three sub-scales combined achieved satisfactory model
fitness. Based on these results, the authors cautioned against the
use of a unidimensional total scale scores as a cardinal indicator
of sleep in Parkinson’s disease, but encouraged the examination
of its multidimensional subscales (114).
Scoring Scale Items
Finalized items from the tests of dimensionality can be used
to create scale scores for substantive analysis including tests
of reliability and validity. Scale scores can be calculated by
using unweighted or weighted procedures. The unweighted
approach involves summing standardized item scores or raw
item
scores, or computing the mean for raw item scores (115). The
weighted approach in calculating scale scores can be produced
via statistical software programs such as Mplus, R, SAS, SPSS,
or Stata. For instance, in using confirmatory factor analysis,
57. structural equation models, or exploratory factor analysis, each
factor produced reveals a statistically independent source of
variation among a set of items (115). The contribution of
each individual item to this factor is considered a weight,
with the factor loading value representing the weight. The
scores associated with each factor in a model then represents a
composite scale score based on a weighted sum of the individual
items using factor loadings (115). In general, it does not make
much difference in the performance of the scale if scales are
computed as unweighted items (e.g., mean or sum scores) or
weighted items (e.g., factor scores).
Step 8: Tests of Reliability
Reliability is the degree of consistency exhibited when a
measurement is repeated under identical conditions (116). A
number of standard statistics have been developed to assess
reliability of a scale, including Cronbach’s alpha (117), ordinal
alpha (118, 119) specific to binary and ordinal scale items,
test–retest reliability (coefficient of stability) (1, 2),
McDonald’s
Omega (120), Raykov’s rho (2) or Revelle’s beta (121, 122),
split-
half estimates, Spearman-Brown formula, alternate formmethod
(coefficient of equivalence), and inter-observer reliability (1,
2).
Of these statistics, Cronbach’s alpha and test–retest reliability
are
predominantly used to assess reliability of scales (2, 117).
Cronbach’s Alpha
Cronbach’s alpha assesses the internal consistency of the scale
items, i.e., the degree to which the set of items in the scale co-
vary,
relative to their sum score (1, 2, 117). An alpha coefficient of
0.70
has often been regarded as an acceptable threshold for
58. reliability;
however, 0.80 and 0.95 is preferred for the psychometric quality
of scales (60, 117, 123). Cronbach’s alpha has been the most
common and seems to have received general approval; however,
reliability statistics such as Raykov’s rho, ordinal alpha, and
Revelle’s beta, which are debated to have improvements over
Cronbach’s alpha, are beginning to gain acceptance.
Test–Retest Reliability
An additional approach in testing reliability is the test–retest
reliability. The test–retest reliability, also known as the
coefficient
of stability, is used to assess the degree to which the
participants’
performance is repeatable, i.e., how consistent their sum scores
are across time (2). Researchers vary in how they assess test–
retest reliability. While some prefer to use intra class
correlation
coefficient (124), others use the Pearson product-moment
correlation (125). In both cases, the higher the correlation,
the higher the test–retest reliability, with values close to zero
indicating low reliability. In addition, study conditions could
change values on the construct being measured over time (as
in an intervention study, for example), which could lower the
test-retest reliability.
The work of Johnson et al. (16) on the validation of the
HIV Treatment Adherence Self-Efficacy Scale (ASES) is a good
example of the test of reliability. As part of testing for
reliability,
the authors tested for the internal consistency reliability values
for the ASES and its subscales using Raykov’s rho (produces
a coefficient similar to alpha but with fewer assumptions and
with confidence intervals); they then tested for the temporal
consistency of the ASES’ factor structure. This was then
59. followed
by test–retest reliability assessment among the latent factors.
The
different approaches provided support for the reliability of the
ASES scale.
Other approaches found to be useful and support scale
reliability include split-half estimates, Spearman-Brown
formula,
alternate form method (coefficient of equivalence), and inter-
observer reliability (1, 2).
Step 9: Tests of Validity
Scale validity is the extent to which “an instrument indeed
measures the latent dimension or construct it was developed
to evaluate” (2). Although it is discussed at length here in
Step 9, validation is an ongoing process that starts with the
identification and definition of the domain of study (Step 1) and
continues to its generalizability with other constructs (Step 9)
(36). The validity of an instrument can be examined in
numerous
ways; the most common tests of validity are content validity
(described in Step 2), which can be done prior to the instrument
being administered to the target population, and criterion
(predictive and concurrent) and construct validity (convergent,
discriminant, differentiation by known groups, correlations),
which occurs after survey administration.
Criterion Validity
Criterion validity is the “degree to which there is a relationship
between a given test score and performance on another measure
of particular relevance, typically referred to as criterion” (1, 2).
There are two forms of criterion validity: predictive (criterion)
Frontiers in Public Health | www.frontiersin.org 13 June 2018 |
Volume 6 | Article 149
60. https://www.frontiersin.org/journals/public-health
https://www.frontiersin.org
https://www.frontiersin.org/journals/public-health%23articles
Boateng et al. Scale Development and Validation
validity and concurrent (criterion) validity. Predictive validity
is
“the extent to which a measure predicts the answers to some
other question or a result to which it ought to be related with”
(31). Thus, the scale should be able to predict a behavior in the
future. An example is the ability for an exclusive breastfeeding
social support scale to predict exclusive breastfeeding (10).
Here,
the mother’s willingness to exclusively breastfeed occurs after
social support has been given, i.e., it should predict the
behavior.
Predictive validity can be estimated by examining the
association
between the scale scores and the criterion in question.
Concurrent criterion validity is the extent to which test
scores have a stronger relationship with criterion (gold
standard)
measurement made at the time of test administration or shortly
afterward (2). This can be estimated using Pearson product-
moment correlation or latent variable modeling. The work
of Greca and Stone on the psychometric evaluation of the
revised version of a social anxiety scale for children (SASC-
R) provides a good example for the evaluation of concurrent
validity (140). In this study, the authors collected data on
an earlier validated version of the SASC scale consisting of
10 items, as well as the revised version, SASC-R, which had
additional 16 items making a 26-item scale. The SASC
61. consisted
of two sub scales [fear of negative evaluation (FNE), social
avoidance and distress (SAD)] and the SASC-R produced three
new subscales (FNE, SAD-New, and SAD-General). Using a
Pearson product-moment correlation, the authors examined the
inter-correlations between the common subscales for FNE, and
between SAD and SAD-New. With a validity coefficient of 0.94
and 0.88, respectively, the authors found evidence of concurrent
validity.
A limitation of concurrent validity is that this strategy for
validity does not work with small sample sizes because of their
large sampling errors. Secondly, appropriate criterion variables
or “gold standards” may not be available (2). This reason may
account for its omission in most validation studies.
Construct Validity
Construct validity is the “extent to which an instrument
assesses a construct of concern and is associated with evidence
that measures other constructs in that domain and measures
specific real-world criteria” (2). Four indicators of construct
validity are relevant to scale development: convergent validity,
discriminant validity, differentiation by known groups, and
correlation analysis.
Convergent validity is the extent to which a construct
measured in different ways yields similar results. Specifically,
it is the “degree to which scores on a studied instrument are
related to measures of other constructs that can be expected
on theoretical grounds to be close to the one tapped into by
this instrument” (2, 37, 126). This is best estimated through
the multi-trait multi-method matrix (2), although in some cases
researchers have used either latent variable modeling or Pearson
product-moment correlation based on Fisher’s Z transformation.
Evidence of convergent validity of a construct can be provided
by
62. the extent to which the newly developed scale correlates highly
with other variables designed to measure the same construct
(2, 126). It can be invalidated by too low or weak correlations
with other tests which are intended to measure the same
construct.
Discriminant validity is the extent to which a measure is
novel and not simply a reflection of some other construct (126).
Specifically, it is the “degree to which scores on a studied
instrument are differentiated from behavioral manifestations of
other constructs, which on theoretical grounds can be expected
not to be related to the construct underlying the instrument
under investigation” (2). This is best estimated through
themulti-
trait multi method matrix (2). Discriminant validity is indicated
by predictably low or weak correlations between the measure of
interest and other measures that are supposedly not measuring
the same variable or concept (126). The newly developed
construct can be invalidated by too high correlations with other
tests which are intended to differ in their measurements (37).
This approach is critical in differentiating the newly developed
construct from other rival alternatives (36).
Differentiation or comparison between known groups
examines the distribution of a newly developed scale score
over known binary items (126). This is premised on previous
theoretical and empirical knowledge of the performance of the
binary groups. An example of best practice is seen in the work
of
Boateng et al. on the validation of a household water insecurity
scale in Kenya. In this study, we compared the mean household
water insecurity scores over households with or without E. coli
present in their drinking water. Consistent with what we knew
from the extant literature, we found households with E. coli
present in their drinking water had higher mean water insecurity
63. scores than households that had no E. coli in drinking water.
This suggested our scale could discriminate between particular
known groups.
Although correlational analysis is frequently used by
several scholars, bivariate regression analysis is preferred
to correlational analysis for quantifying validity (127, 128).
Regression analysis between scale scores and an indicator of
the domain examined has a number of important advantages
over correlational analysis. First, regression analysis quantifies
the association in meaningful units, facilitating judgment
of validity. Second, regression analysis avoids confounding
validity with the underlying variation in the sample and
therefore the results from one sample are more applicable to
other samples in which the underlying variation may differ.
Third, regression analysis is preferred because the regression
model can be used to examine discriminant validity by adding
potential alternative measures. In addition to regression
analysis,
alternative techniques such as analysis of standard deviations of
the differences between scores and the examination of intraclass
correlation coefficients (ICC) have been recommended as viable
options (128).
Taken together, these methods make it possible to assess
the validity of an adapted or a newly developed scale. In
addition to predictive validity, existing studies in fields such as
health, social, and behavioral sciences have shown that scale
validity is supported if at least two of the different forms of
construct validity discussed in this section have been examined.
Further information about establishing validity and constructing
indictors from scales can be found in Frongillo et al. (141).
Frontiers in Public Health | www.frontiersin.org 14 June 2018 |
Volume 6 | Article 149
64. https://www.frontiersin.org/journals/public-health
https://www.frontiersin.org
https://www.frontiersin.org/journals/public-health%23articles
Boateng et al. Scale Development and Validation
CONCLUSIONS
In sum, we have sought to give an overview of the key steps in
scale development and validation (Figure 1) as well as to help
the
reader understand how one might approach each step (Table 1).
We have also given a basic introduction to the conceptual and
methodological underpinnings of each step.
Because scale development is so complicated, this should
be considered a primer, i.e., a “jumping off point” for anyone
interested in scale development. The technical literature and
examples of rigorous scale development mentioned throughout
will be important for readers to pursue. There are a number
of matters not addressed here, including how to interpret
scale output, the designation of cut-offs, when indices, rather
than scales, are more appropriate, and principles for re-
testing scales in new populations. Also, this review leans
more toward the classical test theory approach to scale
development; a comprehensive review on IRT modeling will
be complementary. We hope this review helps to ease readers
into the literature, but space precludes consideration of all these
topics.
The necessity of the nine steps that we have outlined here
(Table 1, Figure 1) will vary from study to study. While studies
focusing on developing scales de novo may use all nine steps,
others, e.g., those that set out to validate existing scales, may
end
65. up using only the last four steps. Resource constraints,
including
time, money, and participant attention and patience are very
real, and must be acknowledged as additional limits to rigorous
scale development. We cannot state which steps are the most
important; difficult decisions about which steps to approach less
rigorously can only be made by each scale developer, based on
the purpose of the research, the proposed end-users of the scale,
and resources available. It is our hope, however, that by
outlining
the general shape of the phases and steps in scale development,
researchers will be able to purposively choose the steps that
they will include, rather than omitting a step out of lack of
knowledge.
Well-designed scales are the foundation of much of our
understanding of a range of phenomena, but ensuring that
we accurately quantify what we purport to measure is not a
simple matter. By making scale development more approachable
and transparent, we hope to facilitate the advancement of
our understanding of a range of health, social, and behavioral
outcomes.
AUTHOR CONTRIBUTIONS
GB and SY developed the first draft of the scale development
and
validation manuscript. All authors participated in the editing
and
critical revision of the manuscript and approved the final
version
of the manuscript for publication.
FUNDING
66. Funding for this work was obtained by SY through the National
Institute of Mental Health—R21 MH108444. The content is
solely the responsibility of the authors and does not necessarily
represent the official views of the National Institute of Mental
Health or the National Institutes of Health.
ACKNOWLEDGMENTS
We would like to acknowledge the importance of the works
of several scholars of scale development and validation
used in developing this primer, particularly Robert DeVellis,
Tenko Raykov, George Marcoulides, David Streiner, and Betsy
McCoach. We would also like to acknowledge the help of Josh
Miller of Northwestern University for assisting with design
of Figure 1 and development of Table 1, and we thank Zeina
Jamuladdine for helpful comments on tests of
unidimensionality.
REFERENCES
1. DeVellis RF. Scale Development: Theory and Application.
Los Angeles, CA:
Sage Publications (2012).
2. Raykov T, Marcoulides GA. Introduction to Psychometric
Theory. New York,
NY: Routledge, Taylor & Francis Group (2011).
3. Streiner DL, Norman GR, Cairney J. Health Measurement
Scales: A Practical
Guide to Their Development and Use. Oxford University Press
(2015).
4. McCoachDB, Gable RK,Madura, JP. Instrument Development
in the Affective
Domain. School and Corporate Applications, 3rd Edn. New
67. York, NY:
Springer (2013).
5. Morgado FFR, Meireles JFF, Neves CM, Amaral ACS,
Ferreira MEC.
Scale development: ten main limitations and recommendations
to
improve future research practices. Psicol Reflex E Crítica
(2018) 30:3.
doi: 10.1186/s41155-016-0057-1
6. Glanz K, Rimer BK, Viswanath K. Health Behavior: Theory,
Research, and
Practice. San Francisco, CA: John Wiley & Sons, Inc (2015).
7. Ajzen I. From intentions to actions: a theory of planned
behavior. In: Action
Control SSSP Springer Series in Social Psychology Berlin;
Heidelberg: Springer,
(1985). p. 11–39.
8. Bai Y, Peng C-YJ, Fly AD. Validation of a short
questionnaire to assess
mothers’ perception of workplace breastfeeding support. J Acad
Nutr Diet
(2008) 108:1221–5. doi: 10.1016/j.jada.2008.04.018
9. Hirani SAA, Karmaliani R, Christie T, Rafique G. Perceived
Breastfeeding Support Assessment Tool (PBSAT): development
and
testing of psychometric properties with Pakistani urban working
mothers. Midwifery (2013) 29:599–607. doi:
10.1016/j.midw.2012.
05.003
10. Boateng GO, Martin S., Collins S, Natamba BK, Young SL.
68. Measuring
exclusive breastfeeding social support: scale development and
validation in
Uganda.Matern Child Nutr. (2018). doi: 10.1111/mcn.12579.
[Epub ahead of
print].
11. Arbach A, Natamba BK, Achan J, Griffiths JK, Stoltzfus RJ,
Mehta S,
et al. Reliability and validity of the center for epidemiologic
studies-
depression scale in screening for depression among HIV-
infected
and -uninfected pregnant women attending antenatal services in
northern Uganda: a cross-sectional study. BMC Psychiatry
(2014) 14:303.
doi: 10.1186/s12888-014-0303-y
12. Natamba BK, Kilama H, Arbach A, Achan J, Griffiths JK,
Young SL.
Reliability and validity of an individually focused food
insecurity access
scale for assessing inadequate access to food among pregnant
Ugandan
women of mixed HIV status. Public Health Nutr. (2015)
18:2895–905.
doi: 10.1017/S1368980014001669
13. Neilands TB, Chakravarty D, Darbes LA, Beougher SC,
Hoff CC.
Development and validation of the sexual agreement investment
scale. J Sex
Res. (2010) 47:24–37. doi: 10.1080/00224490902916017
Frontiers in Public Health | www.frontiersin.org 15 June 2018 |
Volume 6 | Article 149
70. 17. Sexton JB, Helmreich RL, Neilands TB, Rowan K, Vella K,
Boyden
J, et al. The Safety Attitudes Questionnaire: psychometric
properties,
benchmarking data, and emerging research. BMC Health Serv
Res. (2006)
6:44. doi: 10.1186/1472-6963-6-44
18. Wolfe WS, Frongillo EA. Building household food-security
measurement
tools from the ground up. Food Nutr Bull. (2001) 22:5–12.
doi: 10.1177/156482650102200102
19. González W, Jiménez A, Madrigal G, Muñoz LM, Frongillo
EA.
Development and validation of measure of household food
insecurity in
urban costa rica confirms proposed generic questionnaire. J
Nutr. (2008)
138:587–92. doi: 10.1093/jn/138.3.587
20. Boateng GO, Collins SM, Mbullo P, Wekesa P, Onono M,
Neilands T, et
al. A novel household water insecurity scale: procedures and
psychometric
analysis among postpartum women in western Kenya. PloS
ONE. (2018).
doi: 10.1371/journal.pone.0198591
21. Melgar-Quinonez H, Hackett M. Measuring household food
security: the global experience. Rev Nutr. (2008) 21:27s−37s.
doi: 10.1590/S1415-52732008000700004
22. Melgar-Quiñonez H, Zubieta AC, Valdez E, Whitelaw B,
Kaiser L.
Validación de un instrumento para vigilar la inseguridad
71. alimentaria en
la Sierra de Manantlán, Jalisco. Salud Pública México (2005)
47:413–22.
doi: 10.1590/S0036-36342005000600005
23. Hackett M, Melgar-Quinonez H, Uribe MCA. Internal
validity of a
household food security scale is consistent among diverse
populations
participating in a food supplement program in Colombia.
BMCPublic Health
(2008) 8:175. doi: 10.1186/1471-2458-8-175
24. Hinkin TR. A review of scale development practices in the
study
of organizations. J Manag. (1995) 21:967–88. doi:
10.1016/0149-
2063(95)90050-0
25. Haynes SN, Richard DCS, Kubany ES. Content validity in
psychological
assessment: a functional approach to concepts and methods.
Pyschol Assess.
(1995) 7:238–47. doi: 10.1037/1040-3590.7.3.238
26. Kline P. A Handbook of Psychological Testing. 2nd Edn.
London: Routledge;
Taylor & Francis Group (1993).
27. Hunt SD.Modern Marketing Theory. Cincinnati: South-
Western Publishing
(1991).
28. Loevinger J. Objective tests as instruments of psychological
theory. Psychol
Rep. (1957) 3:635–94. doi: 10.2466/pr0.1957.3.3.635
72. 29. Clarke LA, Watson D. Constructing validity: basic issues in
objective scale development. Pyschol Assess. (1995) 7:309–19.
doi: 10.1037/1040-3590.7.3.309
30. Schinka JA, Velicer WF,Weiner IR.Handbook of
Psychology, Vol. 2, Research
Methods in Psychology. Hoboken, NJ: John Wiley & Sons, Inc.
(2012).
31. Fowler FJ. Improving Survey Questions: Design and
Evaluation. Thousand
Oaks, CA: Sage Publications (1995).
32. Krosnick JA. Questionnaire design. In: Vannette DL,
Krosnick JA, editors.
The Palgrave Handbook of Survey Research. Cham: Palgrave
Macmillan
(2018), pp. 439–55.
33. Krosnick JA, Presser S. Question and questionnaire design.
In: Wright JD,
Marsden PV, editors. Handbook of Survey Research. San Diego,
CA: Elsevier
(2009), pp. 263–314.
34. Rhemtulla M, Brosseau-Liard PÉ, Savalei V. When can
categorical variables
be treated as continuous? A comparison of robust continuous
and categorical
SEM estimation methods under suboptimal conditions. Psychol
Methods
(2012) 17:354–73. doi: 10.1037/a0029315
35. MacKenzie SB, Podsakoff PM, Podsakoff NP. Construct
measurement
73. and validation procedures in MIS and behavioral research:
integrating
new and existing techniques. MIS Q. (2011) 35:293. doi:
10.2307/23
044045
36. Messick S. Validity of psychological assessment: validation
of inferences
from persons’ responses and performance as scientifica inquiry
into
score meaning. Am Psychol. (1995) 50:741–9. doi:
10.1037/0003-066X.
50.9.741
37. Campbell DT, Fiske DW. Convergent and discriminant
validity by
the multitrait-multimethod matrix. Psychol Bull. (1959) 56:81–
105.
doi: 10.1037/h0046016
38. Dennis C. Theoretical underpinnings of breastfeeding
confidence: a self-
efficacy framework. J Hum Lact. (1999) 15:195–201. doi:
10.1177/08903
3449901500303
39. Dennis C-L, Faux S. Development and psychometric testing
of the
Breastfeeding Self-Efficacy Scale. Res Nurs Health (1999)
22:399–409. doi: 10.
1002/(SICI)1098-240X(199910)22:5<399::AID-
NUR6>3.0.CO;2-4
40. Dennis C-L. The breastfeeding self-efficacy scale:
psychometric assessment
74. of the short form. J Obstet Gynecol Neonatal Nurs. (2003)
32:734–44.
doi: 10.1177/0884217503258459
41. Frongillo EA, Nanama S. Development and validation of an
experience-
based measure of household food insecurity within and across
seasons in Northern Burkina Faso. J Nutr. (2006)
136:1409S−19S.
doi: 10.1093/jn/136.5.1409S
42. Guion R. Content validity - the source of my discontent.
Appl Psychol Meas.
(1977) 1:1–10. doi: 10.1177/014662167700100103
43. Lawshe C. A quantitative approach to content validity. Pers
Psychol. (1975)
28:563–75. doi: 10.1111/j.1744-6570.1975.tb01393.x
44. Lynn M. Determination and quantification of content
validity. Nurs Res.
(1986) 35:382–5. doi: 10.1097/00006199-198611000-00017
45. Cohen J. A coefficient of agreement for nominal scales.
Educ Psychol Meas.
(1960) 20:37–46. doi: 10.1177/001316446002000104
46. Wynd CA, Schmidt B, Schaefer MA. Two quantitative
approaches
for estimating content validity. West J Nurs Res. (2003)
25:508–18.
doi: 10.1177/0193945903252998
47. Linstone HA, Turoff M. (eds). The Delphi Method. Reading,
MA: Addison-
Wesley (1975).
75. 48. Augustine LF, Vazir S, Rao SF, Rao MV, Laxmaiah A,
Ravinder
P, et al. Psychometric validation of a knowledge questionnaire
on micronutrients among adolescents and its relationship to
micronutrient status of 15–19-year-old adolescent boys,
Hyderabad,
India. Public Health Nutr. (2012) 15:1182–9. doi:
10.1017/S13689800120
00055
49. Beatty PC, Willis GB. Research synthesis: the practice of
cognitive
interviewing. Public Opin Q. (2007) 71:287–311. doi:
10.1093/poq/nfm006
50. Alaimo K, Olson CM, Frongillo EA. Importance of
cognitive testing for
survey items: an example from food security questionnaires. J
Nutr Educ.
(1999) 31:269–75. doi: 10.1016/S0022-3182(99)70463-2
51. Willis GB. Cognitive Interviewing and Questionnaire
Design: A Training
Manual. Cognitive Methods Staff Working Paper Series.
Hyattsville, MD:
National Center for Health Statistics (1994).
52. Willis GB. Cognitive Interviewing: A Tool for Improving
Questionnaire
Design. Thousand Oaks, CA: Sage Publications (2005).
53. Tourangeau R. Cognitive aspects of survey measurement
and
mismeasurement. Int J Public Opin Res. (2003) 15:3–7. doi:
10.1093/
76. ijpor/15.1.3
54. Morris MD, Neilands TB, Andrew E, Mahar L, Page KA,
Hahn
JA. Development and validation of a novel scale for measuring
interpersonal factors underlying injection drug using behaviours
among injecting partnerships. Int J Drug Policy (2017) 48:54–
62.
doi: 10.1016/j.drugpo.2017.05.030
55. Harris PA, Taylor R, Thielke R, Payne J, Gonzalez N,
Conde JG. Research
electronic data capture (REDCap)—a metadata-driven
methodology and
workflow process for providing translational research
informatics support.
J Biomed Inform. (2009) 42:377–81. doi:
10.1016/j.jbi.2008.08.010
56. GoldsteinM, Benerjee R, Kilic T. Paper v Plastic Part 1: The
Survey
Revolution Is in Progress. The World Bank Development
Impact. (2012).
Available online at:
http://blogs.worldbank.org/impactevaluations/paper-
v-plastic-part-i-the-survey-revolution-is-in-progress (Accessed
November
10, 2017).
Frontiers in Public Health | www.frontiersin.org 16 June 2018 |
Volume 6 | Article 149
https://doi.org/10.1521/aeap.14.2.158.23903
https://doi.org/10.1016/j.socscimed.2016.04.002
https://doi.org/10.1007/s10865-007-9118-3
https://doi.org/10.1186/1472-6963-6-44
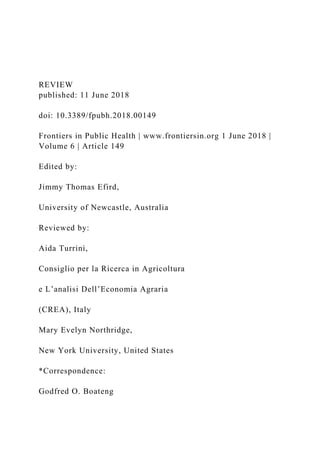
![[email protected]
Specialty section:
This article was submitted to
Epidemiology,
a section of the journal
Frontiers in Public Health
Received: 26 February 2018
Accepted: 02 May 2018
Published: 11 June 2018
Citation:
Boateng GO, Neilands TB,
Frongillo EA, Melgar-Quiñonez HR and
Young SL (2018) Best Practices for
Developing and Validating Scales for
Health, Social, and Behavioral
Research: A Primer.
Front. Public Health 6:149.
doi: 10.3389/fpubh.2018.00149
Best Practices for Developing and](data:image/gif;base64,R0lGODlhAQABAIAAAAAAAP///yH5BAEAAAAALAAAAAABAAEAAAIBRAA7)