1. Cairo University
Faculty of Computers & Information
Department of Decision Support
Advanced Modeling And Simulation
Mid-Term Exam 2007/2008
Duration: 2 hours
Question 1:
1. Discuss briefly the two system dynamics key functions.
Question 2:
1. Are the following concepts stocks or flows:
i. Interest rate ii. Unemployment rate
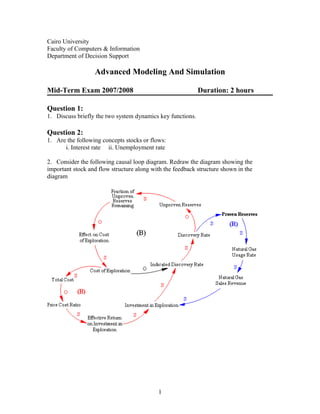
2. Consider the following causal loop diagram. Redraw the diagram showing the
important stock and flow structure along with the feedback structure shown in the
diagram
1
2. Question 3:
AMOUNT OF INCOME IN CERTAIN INDUSTRIES (in billions of dollars)
INDUSTRY
YEAR 1
YEAR 2
YEAR 3
YEAR 4
Agriculture
22
26
26
30
Communication
14
17
18
20
Construction
36
43
47
52
Finance and Real Estate
78
90
100
108
Manufacturing
213
218
226
253
Transportation
27
30
33
36
1. If the trend in the Transportation industry were to continue, its income for Year 6 would most likely
be about
A. 42 billion dollars
D. 48 billion dollars
B. 44 billion dollars
E. 50 billion dollars
C. 46 billion dollars
2. In which of the following instances has the firsttype of industry named consistently had an income
about half that of the second?
A. Agriculture; Finance and Real Estate
D. Finance and Real Estate; Manufacturing
B. Communication; Agriculture
E. Transportation; Communication
C. Construction; Finance and Real Estate
3. The type of industry showing the steadiest rate of growth in income during this period was
A. Communication
D. Manufacturing
B. Construction
E. Transportation
C. Finance and Real Estate
Question 4:
The figure below shows the trajectory of a stock. Determine the behavior of its net rate
by graphical differentiation.
2000
1750
1500
1250
1000
Question 5:
2
YEAR 5
51
21
57
118
287
40
3. PLANT PROBLEM:
The plant manager says to the resident Black Belt, "Our productivity is decreasing drastically due
to all the call-ins we have received from workers who are calling in saying they are sick." A rookie
Black Belt might quickly look for ways to increase the health of the plant's employees through
wellness programs such as free membership to a health club. Maybe the Black Belt would even
suggest setting up a health clinic in the plant staffed by a resident nurse. Both ideas could
possibly raise the health of the employees but it could come at a steep price to implement. But a
more experienced hand would opt for a DMAIC improvement project.
During the Define phase, the Black Belt identify the improvement goals sought by the business
and determined they are consistent with the strategy of the company. During the Measure phase,
data would be collected by asking the question, "What affects the number of employees
available to work?" By talking to the human resources representative, along with various
members of the management team, it can be determined that there are many other factors that
cause the number of employees available to work to fluctuate. For example:
•
•
•
•
Employees in training (in house
and out of the area)
Call-ins (due to sickness)
Employees who are late
Employees who are temporarily
assigned to other departments
Call-ins (due to sickness) may be drawing a lot of unwanted attention due to the fact some
managers may have already had their manpower stretched thin due to the other reasons
(training, lateness and temporary assignments).
The question that should be asked regarding the decrease in productivity is simple: "So what?"
What are the effects of decreased productivity? Once again through observations, interviews, and
document reviews, the answers become apparent:
Interesting things are taking place due to the decrease in productivity. First of all, the "perceived"
training requirements have increased. This might be due to the mistaken belief that it is the
employees' lack of knowledge that is causing productivity to decrease. Also, to make up for the
loss of productivity (due to the limited number of employees) overtime is being used to keep
employees at work longer. Morale also is impacted negatively. A majority of all workers want to
do a good job. When productivity dips, tensions increase as managers frantically look for the
solutions to turn things around. Often times, this pressure causes morale to dip. Finally, some
managers are stepping in to do the work done by those absent employees.
Though well intentioned, the effects of the interventions aimed at improving productivity
can be as bad as the initial decrease of able-bodied employees.As the perceived training
requirements increase, it adds to the initial problem since more employees go to training
and are unavailable to work. As the amount of overtime increases, employees spend less
time with their families. This has a negative effect on their morale. As the number of
managers steps in to do the duties of those employees who are absent, their ability to
perform quality supervision decreases. This decreased supervision increases the number
of employees who are late due to the fact their morale is decreasing and they also know
that due to the lack of supervision, they will probably get away with it.
Draw a simple single loop diagram that captures the causal relationships. Remember to:
o Label links (+ or -).
o Label loops (R or B).
3