

Recommended
More Related Content
What's hot
What's hot (20)
Viewers also liked
Viewers also liked (13)
Similar to Financial Markets Review (July 2015)
Similar to Financial Markets Review (July 2015) (20)
More from Snam
More from Snam (20)
Recently uploaded
Recently uploaded (20)
Financial Markets Review (July 2015)
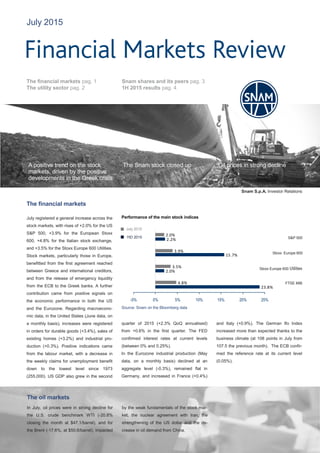
- 1. July 2015 Performance of the main stock indices Source: Snam on the Bloomberg data The financial markets pag. 1 The utility sector pag. 2 Snam shares and its peers pag. 3 1H 2015 results pag. 4 The oil markets In July, oil prices were in strong decline for the U.S. crude benchmark WTI (-20.8% closing the month at $47.1/barrel), and for the Brent (-17.6%, at $50,6/barrel), impacted by the weak fundamentals of the stock mar- ket, the nuclear agreement with Iran, the strengthening of the US dollar and the de- crease in oil demand from China. Snam S.p.A. Investor Relations The financial markets July registered a general increase across the stock markets, with rises of +2.0% for the US S&P 500, +3.9% for the European Stoxx 600, +4.8% for the Italian stock exchange, and +3.5% for the Stoxx Europe 600 Utilities. Stock markets, particularly those in Europe, benefitted from the first agreement reached between Greece and international creditors, and from the release of emergency liquidity from the ECB to the Greek banks. A further contribution came from positive signals on the economic performance in both the US and the Eurozone. Regarding macroecono- mic data, in the United States (June data, on a monthly basis), increases were registered in orders for durable goods (+3.4%), sales of existing homes (+3.2%) and industrial pro- duction (+0.3%). Positive indications came from the labour market, with a decrease in the weekly claims for unemployment benefit down to the lowest level since 1973 (255,000). US GDP also grew in the second quarter of 2015 (+2.3% QoQ annualised) from +0.6% in the first quarter. The FED confirmed interest rates at current levels (between 0% and 0.25%). In the Eurozone industrial production (May data, on a monthly basis) declined at an aggregate level (-0.3%), remained flat in Germany, and increased in France (+0.4%) and Italy (+0.9%). The German Ifo Index increased more than expected thanks to the business climate (at 108 points in July from 107.5 the previous month). The ECB confir- med the reference rate at its current level (0.05%). 23.8% 2.0% 15.7% 2.2% 4.8% 3.5% 3.9% 2.0% -5% 0% 5% 10% 15% 20% 25% Stoxx Europe 600 S&P 500 Stoxx Europe 600 Utilities FTSE MIB July 2015 YtD 2015 The Snam stock closed upA positive trend on the stock markets, driven by the positive developments in the Greek crisis Oil prices in strong decline
- 2. Like the markets, the sectors also registered largely positive performances, in particular the real estate sector (+7.0%) and the con- struction sector (+5.3%), due to the increase in demand. The financial services sector (+4.4%) and the banking sector (+4.2%) also saw good performances, thanks to positive signs given by the quarterly results. In contrast the raw materials sector fell (-6.6%), due to the ongoing slowdown of the Chinese economy and the strengthening of the US dollar, as did the Oil & Gas sector (-0.9%), which was impacted by the fall in oil prices. In July, the utility sector rose 3.5%, bolstered mostly by the “Other” sector (+6.2%), which includes the French company Veolia (+11.1%), boosted by expectations for its annual targets to be revised upwards, and Enel Green Power (+7,9%), thanks to its positive half year results. The “Defensive” sector was also on the rise (+3.9%), and in addition to Snam (+5.0%), Terna rose (+7.1%) thanks to its positive half year results, as did Enagas (+4.9%), follo- wing Standard&Poor’s rating upgrade from BBB a BBB+. Sectors on the stock market Source: Snam on the Bloomberg data Main sector performance, July 2015 Sector and subsector performance, July 2015 6.2% 3.0% 3.9% 3.5% -5% 0% 5% 10% Defensive Utilities DJ Utility Energy Utilities Others The utility sector performance Financial Markets Review July 2015 Snam S.p.A. Investor Relations DJ Uti l i ty; 3,5% DJ Insur ance; 5,1% DJ T el ecom; 4,9% DJ Heal th Car e; 7,7% DJ M edi a; 4,8% DJ Real Estate; 7,0% DJ T r avel &Lei sur e; 2,7% DJ Chemi cal s; 3,5% DJ Food&Bev; 3,4% DJ Const&M ater ; 5,3% DJ Inds Good; 2,9% DJ Oi l &Gas; -0,9% DJ Per s&Househol ds; 8,6% DJ Autopar ts; -4,7% DJ T ech; 2,5% DJ Fi nanci al Ser vi ces; 4,4% DJ Retai l ; 4,7% DJ Banks; 4,2% DJ Basi c Resour ces; 3,4% -10% -5% 0% 5% 10% 15%
- 3. 9.3% 12.9% -2.3% -0.6% -7.1% 9.9% -2.6% 2.0% 23.8% 15.7% 5.0% 7.1% 4.9% 1.2% 4.4% 5.9% 0.0% 3.5% 4.8% 3.9% -10% -5% 0% 5% 10% 15% 20% 25% 30% The Snam shares and its peers in the Stock Markets The Snam stock closed the last session of July at €4.48, up 5.0% from the previous month. The share price, which outperformed both the utility sector as well as the Italian market, was particularly impacted in the first half of the month by the increase in bond yields, as they are expected to translate into larger returns. In addition, the half year results’ performance being in line with expectations has counterbalanced some profit taking. The stock's average daily trading volume in July totalled 12.2 million units, down from 13.2 million in June. 1H 2015 Snam results Corporate News Snam and its peers Source: Snam on the Bloomberg data YtD 2015 July 2015 FTSE MIB Stoxx Europe 600 Stoxx Europe 600 Utilities United Utilities National Grid Severn Trent Red Electrica Enagas Snam Terna On 28th July the Snam Board of Directors, at meeting chaired by Lorenzo Bini Smaghi, approved the consolidated half-year report to 30 June 2015 (subjected to a limited audit) and the consolidated results for the second quarter of 2015 (unaudited). Carlo Malacarne, Snam CEO, made the follo- wing comments on the results: “The 9.1% growth in net profit in the first half of 2015 reflects the robustness of our opera- tions and our strict financial discipline, as well as the growing contribution of our associates. We are continuing our selective programme of investment focused on upgrading Italian gas infrastructure and promoting closer inte- gration of the European networks”. Activities relating to the revocation of the judicial administration ordered by the Court of Palermo regarding Italgas concluded on 9th July. The Court has ruled on the return of the company, having considered the verifi- cations carried out and the active coopera- tion of the Snam Group. Having taken note of the revocation order, Italgas’ Shareholders' Meeting appointed the company's Board of Directors – which was scheduled to remain in office until April 2015 - until the approval of the 31 December 2015 financial statements, confirming all the outgoing members and Marco Reggiani as Chairman. The Board has, in turn, confirmed Luca Schieppati as Chief Executive Officer. Financial Markets Review July 2015 Snam S.p.A. Investor Relations Agenda October 27/28 Third quarter 2015 report Board of Director, press release and conference call Fitch Ratings has affirmed Snam’s long-term Issuer Default Rating (IDR) and senior unse- cured rating at “BBB+”. The outlook is stable. The short-term Issuer Default Rating has been affirmed at “F2”. Italgas: judicial administration revoked Fitch affirms Snam’s rating at BBB+, outlook stable
- 4. Snam and its peers: 1H 2015 results Operating Highlights Financial Highlights On 29th July Snam presented the 1H 2015 results * Net profit is attributable to Snam. ** Debt at 12.31.2014. On 28th July Terna presented the 1H 2015 results On 21st July Enagas presented the 1H 2015 results (million euro) 1H 2014 1H 2015 Change Total revenue 638 609 (4.6%) EBITDA 507 459 (9.6%) EBIT 339 312 (7.9%) Net profit 210 213 +1.5% Investments 419 280 (33.0%) Net debt 4,059* 3,851 (5.1%) Financial Highlights On 29th July Red Electrica presented the 1H 2015 results (million euro) 1H 2014 1H 2015 Change Total revenue 926 973 +5.0% EBITDA 695 741 +6.6% EBIT 485 507 +4.5% Net profit 290 309 +6.5% Net debt 5,409* 5,046 (6.7%) Investments 249 226 (9.3%) Financial Highlights Snam SpA Piazza Santa Barbara 7 - 20097 S. Donato Milanese (Mi) Italia www.snam.it — investor.relations@snam.it tel: +39 02 37037272- fax: +39 02 37037803 Financial Markets Review July 2015 Snam S.p.A. Investor Relations (million euro) 1H 2014 1H 2015 Change Total revenue 1,782 1,837 +3.1% EBITDA 1,428 1,434 +0.4% EBIT 1,044 1,012 (3.1%) Net profit 561 612 +9.1% Investments 526 487 (7.4%) Net debt 13,652* 13,936 +2.1% (billion cubic meters) 1H 2014 Change Gas injected into the transportation network 32.78 0% Available storage capacity 11.4 0% Number of active meters (mln) 5.911 +10.3% 1H 2015 32.77 11.4 6.518 * Debt at 12.31.2014. * Debt at 12.31.2014. (million euro) 1H 2014 1H 2015 Change Total revenue 950 1,002 +5.5% EBITDA 753 767 +1.9% EBIT 518 524 +1.2% Net profit 274 310 +13.1% Net debt 6,966* 6,876 (1.3%) Investments 386 439 +13.7% * Debt at 12.31.2014. Financial Highlights