Maths global citizenship_guide
•
1 like•156 views

This short guide supports teachers to see how real world contexts can enrich the teaching of maths, fostering an appreciation of some of its purposes and inspiring learners. It gives examples of ways to support learners in critically analysing statistics and making connections between the local and global, as well as providing links to an extensive range of resources which support the teaching of maths concepts through Global Citizenship issues.

Recommended
Recommended
More Related Content
Similar to Maths global citizenship_guide
Similar to Maths global citizenship_guide (20)
More from Global Citizen Network
More from Global Citizen Network (8)
Recently uploaded
Recently uploaded (20)
Maths global citizenship_guide
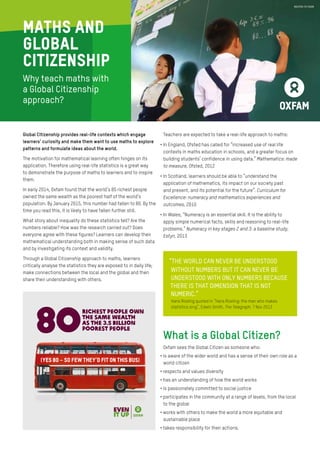
- 1. Global Citizenship provides real-life contexts which engage learners’ curiosity and make them want to use maths to explore patterns and formulate ideas about the world. The motivation for mathematical learning often hinges on its application. Therefore using real-life statistics is a great way to demonstrate the purpose of maths to learners and to inspire them. In early 2014, Oxfam found that the world’s 85 richest people owned the same wealth as the poorest half of the world’s population. By January 2015, this number had fallen to 80. By the time you read this, it is likely to have fallen further still. What story about inequality do these statistics tell? Are the numbers reliable? How was the research carried out? Does everyone agree with these figures? Learners can develop their mathematical understanding both in making sense of such data and by investigating its context and validity. Through a Global Citizenship approach to maths, learners critically analyse the statistics they are exposed to in daily life; make connections between the local and the global and then share their understanding with others. Teachers are expected to take a real-life approach to maths: • In England, Ofsted has called for “increased use of real life contexts in maths education in schools, and a greater focus on building students’ confidence in using data.” Mathematics: made to measure, Ofsted, 2012 • In Scotland, learners should be able to “understand the application of mathematics, its impact on our society past and present, and its potential for the future”. Curriculum for Excellence: numeracy and mathematics experiences and outcomes, 2010 • In Wales, “Numeracy is an essential skill. It is the ability to apply simple numerical facts, skills and reasoning to real-life problems.” Numeracy in key stages 2 and 3: a baseline study, Estyn, 2013 What is a Global Citizen? Oxfam sees the Global Citizen as someone who: • is aware of the wider world and has a sense of their own role as a world citizen • respects and values diversity • has an understanding of how the world works • is passionately committed to social justice • participates in the community at a range of levels, from the local to the global • works with others to make the world a more equitable and sustainable place • takes responsibility for their actions. “THE WORLD CAN NEVER BE UNDERSTOOD WITHOUT NUMBERS BUT IT CAN NEVER BE UNDERSTOOD WITH ONLY NUMBERS BECAUSE THERE IS THAT DIMENSION THAT IS NOT NUMERIC.” Hans Rosling quoted in “Hans Rosling: the man who makes statistics sing”, Edwin Smith, The Telegraph, 7 Nov 2013 maths and global citizenship Why teach maths with a Global Citizenship approach? NGUYEN THI HOAN (YES 80 – SO FEW THEY’D FIT ON THIS BUS) 80 RICHEST PEOPLE OWN THE SAME WEALTH AS THE 3.5 BILLION POOREST PEOPLE
- 2. Interpreting data • Explore development indicators such as life expectancy and access to water, electricity and education. World Bank Open Data and UN data provide free and open access to development data from countries around the world. Hans Rosling’s Gapminder has statistics, graphs and other information about social, economic and environmental development at local, national and global levels. • Examine the change over time in statistics such as life expectancy and GDP in different countries and explore questions such as: Have literacy rates improved or worsened? Has the gap between rich and poor widened or closed? • Try activities from Oxfam’s Everyone Counts Unit 3 such as Session 1 which supports learners to analyse and compare development indicators from different countries. • Use Oxfam’s Change the World in Eight Steps to explore real-life stories behind the Millennium Development Goals,eight global goals which targeted reducing global poverty between 2000 and 2015. Higher-level learners can explore the complexity of measuring poverty and compare the goals set for 2015 with recent World Bank Open Data and the Sustainable Development Goals (successors of the Millennium Development Goals). Presenting and manipulating data • Ask learners to collect a range of data from a variety of on-line and off-line sources. Investigate different ways in which data is manipulated, the reasons for this and the consequences this might have. • Compare and evaluate different ways of presenting global data such as world trade and Fairtrade prices for cocoa over a period of time using tables, bar charts, infographics, line graphs and pie charts. • Draw and interpret statistical diagrams involving representation by area, such as the Lorenz Curve for the income of the world’s population. • Explore ways of measuring inequality within individual countries such as the Gini coefficient or Palma ratio. • Ask learners to create their own graphs and charts to represent real-life data and compare the efficacy of different representations. Try Session 2 in Oxfam’s Everyone Counts Unit 3. • Draw scatter graphs of pairs of development indicators such as life expectancy, calorie intake or infant mortality for different countries and ask questions such as: Is there any positive or negative correlation? What does this mean? How can we explain any outliers? Percentages • Use the concept of representing the world as a village of 100 people to represent different data such as the percentage of a country’s population with access to services such as education, electricity, water, the Internet and mobile phones. • Use real-life data to explore percentage increases, for example in population or wages. • Calculate the value of 100% when given the value of another percentage. For example, given that 120 or 75% of pupils at a primary school in a rural area of the UK have access to the Internet at home, ask learners to calculate how many pupils are at the school. Reinforce this kind of calculation by comparing local, national and global statistics about Internet use. Measurement and time • Investigate trade routes and food miles, or plan a sustainable route to another locality. • Using World Bank open data, explore an issue like stunting (slow growth in children affected by malnutrition) and its use as a proxy indicator for malnutrition. • Use Oxfam’s Mapping Our World to compare misrepresentations of countries’ sizes and areas in different mapping projections. • Measure the volumes of water learners use for different daily activities and compare this with domestic water use in other countries. See Oxfam’s Water Week, Water Diary activity. “IT IS ESSENTIAL THAT OUR LEARNERS UNDERSTAND HOW DATA CAN BE MANIPULATED TO SHOW WHAT IS WANTED AND THAT THEY NEED TO ANALYSE INFORMATION AND FEEL CONFIDENT IN CHALLENGING FALSE CLAIMS.” Rachael Horsman, Mathematical Association, 2015 Practical ideas for a Global Citizenship approach to maths A Global Citizenship approach offers numerous, diverse opportunities for real-life learning in maths, enabling young people to learn, think and take action on global issues. Here are just a few practical ideas: NIGEL WILLMOTT
- 3. • Compare how much time learners spend on different daily activities such as sleeping, studying, playing and carrying out domestic tasks or other work with data of young people from other parts of the world. Use this to prompt discussion about how time use can be affected by gender and by place, such as living in an urban or rural locality. For data about time use of children in four different countries, see Oxfam’s Everyone Counts Units 2 and 3. Ratios and Fractions • Use the concept of sharing to explore inequality in a world where seven out of ten people live in countries where economic inequality has increased in the last 30 years (Oxfam, 2014). Use ratio or fractions to describe different equal and unequal distributions. • Explore fair and unfair shares by looking at Fairtrade statistics. • Look at general election statistics and use the issue of gerrymandering (manipulating the boundaries of an electoral constituency to influence results) to explore ratios and fractions. • Use World Bank Open Data or UN data to compare proportions of a population with access to services such as electricity, education or healthcare in different countries. Ordering and comparing numbers • Help learners visualise large numbers by using counters or sweets to represent populations of towns and cities. Give each counter a value of 1000, 10,000, 100,000 or 1 million. • Order and compare large numbers using real-life statistics such as populations, GDP (income per person) or numbers of internally displaced people, refugees and asylum seekers. • Consider the efficacy of infographics to represent data, such as those created by David McCandless or this example: www.unhcr.org/54d0e28d9.html • Order and compare fractions, decimals and percentages by exploring real-life data such as average incomes, literacy rates and life expectancy in different countries. • Play ‘Top Trumps’ using global country data, such as the cards created for Oxfam’s World Cup: A Fair Game? Probability • Use FIFA rankings or medal tables from previous Olympic Games to make probability statements about the likelihood of teams from different countries or continents being successful. Discuss why some countries or teams from certain continents have a better chance of winning than others and whether or not this is fair. For data and background information based on the 2012 World Cup, see Oxfam’s World Cup: A Fair Game? Money and Finance • Explore average wages and the issue of a living wage in a world where it is estimated that around 1 billion people still live in extreme poverty (defined as living on less than $1.25 dollars per day, Oxfam, 2014)*. • Look at Fairtrade data about how the costs of particular foods at the supermarket or clothes on the High Street are shared between the growers, couriers, manufacturers, packagers and shop. • Explore government spending, for example by comparing military spending with social spending on health and education. *based on 2005 international prices. “MATHEMATICAL LITERACY... ASSISTS INDIVIDUALS TO RECOGNISE THE ROLE THAT MATHEMATICS PLAYS IN THE WORLD AND TO MAKE THE WELL-FOUNDED JUDGMENTS AND DECISIONS NEEDED BY CONSTRUCTIVE, ENGAGED AND REFLECTIVE CITIZENS.” Assessment and Analytical Framework Mathematics, PISA, 2012 CRISPIN HUGHES ALL SAINTS C OF E PRIMARY SCHOOL, BEXHILL
- 4. Why teach maths with a global citizenship approach? Benefits to learners • Provides a strong numerical base to the views learners develop about the world. • Offers meaningful opportunities to illustrate mathematical concepts and processes, manipulate data and problem- solve on real and engaging issues. • Develops critical thinking around the use, presentation and manipulation of data. • Provides opportunities to consider the influence of different cultures on maths. Benefits to teachers • Motivates learners to deepen their understanding of mathematical processes and principles. • Engages learners through the use of real-life statistics and examples which help them see the practical relevance of maths. • Is a holistic approach to teaching and learning rather than an extra demand on curricular time. Benefits to the wider world • Enables learners to apply their mathematical understanding to local and global issues. • Empowers learners to confidently challenge inaccurate or false assertions made by others. • Equips learners with knowledge, understanding, values, attitudes and skills that will enable them to contribute towards a more just and sustainable world. For further information please visit www.oxfam.org.uk/education/global-citizenship “THE MOTIVATION TO LEARN MATHEMATICS INCREASES WHEN STUDENTS SEE THE RELEVANCE OF WHAT THEY ARE LEARNING TO THE WORLD OUTSIDE THE CLASSROOM AND TO OTHER SUBJECTS.” Assessment and Analytical Framework Mathematics, PISA, 2012 Oxfam resources for maths teachers Everyone Counts A maths resource for 8-12 year-olds comparing young lives around the world. The World Cup: A Fair Game? Activities for using fractions, probability, percentages and ratios to compare World Cup countries. Change the world in eight steps (8-14 years) The stories behind real-life poverty statistics. Water Week (7-14 years) Includes a water diary to measure daily water use. Mapping Our World Includes activities which compare area and proportion in different world map projections. CPD (England and Wales) and CLPL (Scotland) Oxfam offers courses to develop teachers’ skills and understanding in global citizenship. Useful websites Oxfam Education www.oxfam.org.uk/education Maths Association www.m-a.org.uk Association of Teachers of Mathematics www.atm.org.uk/ Scottish Mathematical Council www.scottishmathematicalcouncil.org.uk Hwb Wales (see numeracy resources) www.hwb.wales.gov.uk NRICH www.nrich.maths.org Global Dimension/Think Global www.think-global.org.uk/; www.globaldimension.org.uk See their lists of resources and an article: ‘Secondary Mathematics and Global Learning’. World Bank Open Data data.worldbank.org UN Data data.un.org Office of National Statistics www.ons.gov.uk Gapminder www.gapminder.org Hans Rosling’s website with statistics at local, national and global levels and links to his TED talks. Worldometers www.worldometers.info A real-time count of world statistics such as population, food or number of televisions sold today Worldmapper www.worldmapper.org World maps are re-sized according to interests such as population or internet users. Rethinking schools www.rethinkingschools.org Strengthens education through social justice teaching and education activism. Understanding Uncertainty www.understandinguncertainty.org David Spiegelhalter et al on the way uncertainty and risk are discussed in society. David McCandless www.davidmccandless.com A data journalist and information designer who has produced infographics based on global data. 80:20 Development in an Unequal World www.8020.ie A development education resource exploring human development and human rights. 5:50:500 Five Fifty Five Hundred www.developmenteducation.ie/5-50-500 An exploration of how the world rewards the rich at the expense of the poor. Geographical Association www.geography.org.uk UN websites www.unhcr.org www.undp.org www.unicef.org.uk Fairtrade Foundation www.fairtrade.org.uk To find out more, visit: www.oxfam.org.uk/education Oxfam is a registered charity in England and Wales No 202918 and Scotland SC039042. Oxfam GB is a member of Oxfam International. Inhouse 6669 ***Placeholder*** **Only** Please add correct logo