Research Study – Florida International University – Spring, 2019
Instructions: This semester in my psychology research methods class, we are collecting different types of data (demographic information, open-ended questions, scaled questions, etc.) that we will analyze in our statistical lab. We would greatly appreciate you completing the five parts of the survey below!
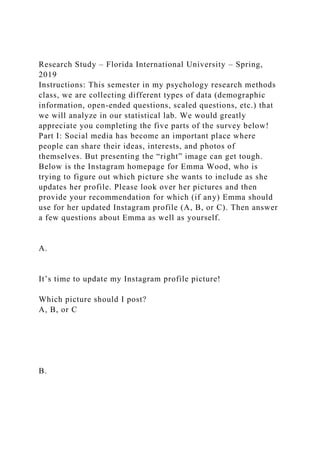
Part I: Social media has become an important place where people can share their ideas, interests, and photos of themselves. But presenting the “right” image can get tough. Below is the Instagram homepage for Emma Wood, who is trying to figure out which picture she wants to include as she updates her profile. Please look over her pictures and then provide your recommendation for which (if any) Emma should use for her updated Instagram profile (A, B, or C). Then answer a few questions about Emma as well as yourself.
A.
It’s time to update my Instagram profile picture!
Which picture should I post?
A, B, or C
B.
C.
1. Which profile picture of Emma do you prefer? (Circle One): A. B. C. None of them
2. Since creating her Instagram account, when do you think Emma last updated her profile pic? (Circle one):
0
1
2
3
4
5
Never
One year ago
One month ago
One week ago
One day ago
One hour ago
3. In general, how often do you think Emma posts her thoughts and/or pictures on Instagram? (Circle one):
0
1
2
3
4
5
Rarely
Constantly
Part II: Without looking back, please rate your general impressions of Emma Wood below (Mark with an X)
Strongly Disagree
Strongly Agree
0
1
2
3
4
5
1. Emma seems smart
X
2. Emma seems happy
X
3. Emma seems generous
X
4. Emma seems self-absorbed
X
5. Emma seems helpful
X
6. Emma seems shy
X
7. Emma seems selfish
X
8. Emma seems down-to-earth
X
9. Emma seems narcissistic
X
10. Emma seems egotistical
X
Part III: Rate the following in items in terms of how well they describe YOU (Mark with an X)
Strongly Disagree
Strongly Agree
0
1
2
3
4
5
1. I have a natural talent for influencing people
X
2. I am essentially a modest person
X
3. I try not to be a show off
X
4. I always know what I am doing
X
5. Compliments embarrass me
X
6. I really like to be the center of attention
X
7. People always seem to recognize my authority
X
8. I hope I am going to be successful
X
9. I am more capable than other people
X
10. I wish I were more assertive
X
Part IV: Please provide the following demographic information. Note: You can leave blank any question you feel uncomfortable answering.
1. What is your gender (Mark one with an X)? ___X__ Male _____ Female
2. What is your age? _____23_____
3. What is your race/ethnicity? (Mark one with an X):
_X__ Caucasian ___ Hispanic American ____ Native Indian ___ African American
___ Asian American Other: __________________ (Please Indicate)
4. Is English your first language? (Mark one wit.
Research Study – Florida International University – Spring, 2019.docx
1. Research Study – Florida International University – Spring,
2019
Instructions: This semester in my psychology research methods
class, we are collecting different types of data (demographic
information, open-ended questions, scaled questions, etc.) that
we will analyze in our statistical lab. We would greatly
appreciate you completing the five parts of the survey below!
Part I: Social media has become an important place where
people can share their ideas, interests, and photos of
themselves. But presenting the “right” image can get tough.
Below is the Instagram homepage for Emma Wood, who is
trying to figure out which picture she wants to include as she
updates her profile. Please look over her pictures and then
provide your recommendation for which (if any) Emma should
use for her updated Instagram profile (A, B, or C). Then answer
a few questions about Emma as well as yourself.
A.
It’s time to update my Instagram profile picture!
Which picture should I post?
A, B, or C
B.
2. C.
1. Which profile picture of Emma do you prefer? (Circle One):
A. B. C. None of them
2. Since creating her Instagram account, when do you think
Emma last updated her profile pic? (Circle one):
0
1
2
3
4
5
Never
One year ago
One month ago
One week ago
One day ago
One hour ago
3. In general, how often do you think Emma posts her thoughts
and/or pictures on Instagram? (Circle one):
0
1
2
3
4
5
Rarely
3. Constantly
Part II: Without looking back, please rate your general
impressions of Emma Wood below (Mark with an X)
Strongly Disagree
Strongly Agree
0
1
2
3
4
5
1. Emma seems smart
X
2. Emma seems happy
X
3. Emma seems generous
4. X
4. Emma seems self-absorbed
X
5. Emma seems helpful
X
6. Emma seems shy
X
7. Emma seems selfish
X
8. Emma seems down-to-earth
5. X
9. Emma seems narcissistic
X
10. Emma seems egotistical
X
Part III: Rate the following in items in terms of how well they
describe YOU (Mark with an X)
Strongly Disagree
Strongly Agree
0
1
2
3
4
5
1. I have a natural talent for influencing people
X
6. 2. I am essentially a modest person
X
3. I try not to be a show off
X
4. I always know what I am doing
X
5. Compliments embarrass me
X
6. I really like to be the center of attention
X
7. 7. People always seem to recognize my authority
X
8. I hope I am going to be successful
X
9. I am more capable than other people
X
10. I wish I were more assertive
X
Part IV: Please provide the following demographic information.
Note: You can leave blank any question you feel uncomfortable
answering.
1. What is your gender (Mark one with an X)? ___X__
Male _____ Female
2. What is your age? _____23_____
3. What is your race/ethnicity? (Mark one with an X):
_X__ Caucasian ___ Hispanic American ____ Native
8. Indian ___ African American
___ Asian American Other: __________________ (Please
Indicate)
4. Is English your first language? (Mark one with an X):
___X__ Yes _____ No
If no, what is your first language? __________________
5. Are you a student at FIU (Mark one with an X):
___X__ Yes ______ No
6. In general, how often do YOU post your thoughts and/or
pictures on any social media? (Circle one):
0
1
2
3
4
5
Rarely
Constantly
Part V: Which of the following BEST describes Emma’s A, B,
and C photo options? (Mark one with an X):
____ Self-taken (i.e. Selfie) ____ Self-taken with others (i.e.
Groupie) __X__ Other taken (i.e. Professional)
G
Research Study – Florida International University – Spring,
2019
Instructions: This semester in my psychology research methods
class, we are collecting different types of data (demographic
information, open-ended questions, scaled questions, etc.) that
we will analyze in our statistical lab. We would greatly
appreciate you completing the five parts of the survey below!
Part I: Social media has become an important place where
9. people can share their ideas, interests, and photos of
themselves. But presenting the “right” image can get tough.
Below is the Instagram homepage for Emma Wood, who is
trying to figure out which picture she wants to include as she
updates her profile. Please look over her pictures and then
provide your recommendation for which (if any) Emma should
use for her updated Instagram profile (A, B, or C). Then answer
a few questions about Emma as well as yourself.
A.
It’s time to update my Instagram profile picture!
Which picture should I post?
A, B, or C
B.
C.
1. Which profile picture of Emma do you prefer? (Circle One):
10. A. B. C. None of them
2. Since creating her Instagram account, when do you think
Emma last updated her profile pic? (Circle one):
0
1
2
3
4
5
Never
One year ago
One month ago
One week ago
One day ago
One hour ago
3. In general, how often do you think Emma posts her thoughts
and/or pictures on Instagram? (Circle one):
0
1
2
3
4
5
Rarely
Constantly
Part II: Without looking back, please rate your general
impressions of Emma Wood below (Mark with an X)
12. 5. Emma seems helpful
X
6. Emma seems shy
X
7. Emma seems selfish
X
8. Emma seems down-to-earth
X
9. Emma seems narcissistic
X
13. 10. Emma seems egotistical
X
Part III: Rate the following in items in terms of how well they
describe YOU (Mark with an X)
Strongly Disagree
Strongly Agree
0
1
2
3
4
5
1. I have a natural talent for influencing people
X
2. I am essentially a modest person
X
3. I try not to be a show off
14. X
4. I always know what I am doing
X
5. Compliments embarrass me
X
6. I really like to be the center of attention
X
7. People always seem to recognize my authority
X
8. I hope I am going to be successful
15. X
9. I am more capable than other people
X
10. I wish I were more assertive
X
Part IV: Please provide the following demographic information.
Note: You can leave blank any question you feel uncomfortable
answering.
1. What is your gender (Mark one with an X)? _____
Male _____ Female
2. What is your age? ____18______
3. What is your race/ethnicity? (Mark one with an X):
___ Caucasian ___ Hispanic American ____ Native Indian
__X_ African American
___ Asian American Other: __________________ (Please
Indicate)
4. Is English your first language? (Mark one with an X):
___X__ Yes _____ No
If no, what is your first language? __________________
5. Are you a student at FIU (Mark one with an X):
_____ Yes ____X__ No
6. In general, how often do YOU post your thoughts and/or
pictures on any social media? (Circle one):
16. 0
1
2
3
4
5
Rarely
Constantly
Part V: Which of the following BEST describes Emma’s A, B,
and C photo options? (Mark one with an X):
____ Self-taken (i.e. Selfie) ____ Self-taken with others (i.e.
Groupie) __X__ Other taken (i.e. Professional)
P
Research Study – Florida International University – Spring,
2019
Instructions: This semester in my psychology research methods
class, we are collecting different types of data (demographic
information, open-ended questions, scaled questions, etc.) that
we will analyze in our statistical lab. We would greatly
appreciate you completing the five parts of the survey below!
Part I: Social media has become an important place where
people can share their ideas, interests, and photos of
themselves. But presenting the “right” image can get tough.
Below is the Instagram homepage for Emma Wood, who is
trying to figure out which picture she wants to include as she
updates her profile. Please look over her pictures and then
provide your recommendation for which (if any) Emma should
use for her updated Instagram profile (A, B, or C). Then answer
a few questions about Emma as well as yourself.
17. A.
It’s time to update my Instagram profile picture!
Which picture should I post?
A, B, or C
B.
C.
1. Which profile picture of Emma do you prefer? (Circle One):
A. B. C. None of them
2. Since creating her Instagram account, when do you think
Emma last updated her profile pic? (Circle one):
0
1
2
3
4
5
18. Never
One year ago
One month ago
One week ago
One day ago
One hour ago
3. In general, how often do you think Emma posts her thoughts
and/or pictures on Instagram? (Circle one):
0
1
2
3
4
5
Rarely
Constantly
Part II: Without looking back, please rate your general
impressions of Emma Wood below (Mark with an X)
Strongly Disagree
Strongly Agree
0
1
2
3
4
5
1. Emma seems smart
19. x
2. Emma seems happy
x
3. Emma seems generous
x
4. Emma seems self-absorbed
x
5. Emma seems helpful
x
6. Emma seems shy
20. x
7. Emma seems selfish
x
8. Emma seems down-to-earth
x
9. Emma seems narcissistic
x
10. Emma seems egotistical
x
Part III: Rate the following in items in terms of how well they
describe YOU (Mark with an X)
21. Strongly Disagree
Strongly Agree
0
1
2
3
4
5
1. I have a natural talent for influencing people
x
2. I am essentially a modest person
x
3. I try not to be a show off
x
4. I always know what I am doing
x
22. 5. Compliments embarrass me
x
6. I really like to be the center of attention
x
7. People always seem to recognize my authority
x
8. I hope I am going to be successful
x
9. I am more capable than other people
x
23. 10. I wish I were more assertive
x
Part IV: Please provide the following demographic information.
Note: You can leave blank any question you feel uncomfortable
answering.
1. What is your gender (Mark one with an X)? _____
Male __x___ Female
2. What is your age? ____23______
3. What is your race/ethnicity? (Mark one with an X):
___ Caucasian ___ Hispanic American ____ Native Indian
__x_ African American
___ Asian American Other: __________________ (Please
Indicate)
4. Is English your first language? (Mark one with an X):
___x__ Yes _____ No
If no, what is your first language? __________________
5. Are you a student at FIU (Mark one with an X):
__x___ Yes ______ No
6. In general, how often do YOU post your thoughts and/or
pictures on any social media? (Circle one):
0
1
2
3
4
5
Rarely
24. Constantly
Part V: Which of the following BEST describes Emma’s A, B,
and C photo options? (Mark one with an X):
__x__ Self-taken (i.e. Selfie) ____ Self-taken with others (i.e.
Groupie) ____ Other taken (i.e. Professional)
S
Running head: COUNTERFACTUAL THINKING 1
4
COUNTERFACTUAL THINKING: APPOINTING BLAME
10
COUNTERFACTUAL THINKING
Comment by Ryan Winter: Similar to Paper I, note the
running head up here. The correct APA format is Running head:
TITLE. Thus make sure to capitalize the R, have a lower case h,
and then your short title all in CAPS (a short title should be no
more than 50 characters). This title page also starts on page one,
and the page number is flush to the right while the running head
is flush to the left Comment by Ryan Winter: Do you know
how to enter a header? Click on the “Insert” menu at the top of
word, click on “Header”, and then type in the header whatever
you want. There is even a box that you can check that allows
you to have a different header on the first page than subsequent
pages.
25. Counterfactual Thinking: Appointing Blame Comment by
Ryan Winter: The title page here is essentially the same one
from Paper I. It has the title (in APA format), author name, and
university affiliation.
Want my advice? If you did well on the Paper I title page, reuse
it!
Former Student
Florida International University
Comment by Ryan Winter: The good news is that this
example paper is on the same topic as the example paper from
Paper I. I’m going to show you the progress of the paper
26. throughout the semester, so you can see how you will eventually
combine Papers I, II, III, and IV into Paper V. Let’s continue
looking at counterfactual thinking!
Methods Comment by Ryan Winter: The word Method here is
centered and bolded, as is recommended by the APA
Participants Comment by Ryan Winter: Participant (also
bolded) is flush left
One hundred and twenty six students from Florida
International University were randomly selected to participate
in our study. Of these 126 participants, 37% (n = 47) were male
and 63% (n = 79) were female. Ages ranged from a minimum of
17 to a maximum of 58 with an average of 22.32 years (SD =
6.30). Our sample population consisted of 68.3% Hispanic
Americans (n = 86), 8.7% African Americans (n = 11), 19%
Caucasians (n = 24), 1.6% Asians (n = 2), and 2.4% who did not
specify their ethnicity (n = 3). See Appendix A. Comment by
Ryan Winter: When a number starts a sentence, spell out the
number Comment by Ryan Winter: Note the mean and
standard deviation here, which is helpful for knowing about the
makeup of the sample. The mean, of course, is the average
Comment by Ryan Winter: Make sure to provide your
demographics charts in your appendix. I expect to see one for
gender, one for age, and one for ethnicity
Materials and Procedure Comment by Ryan Winter: Also
bolded and flush left. You will notice that this author combined
materials and procedures, which was good for this simple study.
She could have separated them, though, and talked about the
taxi scenario and questionnaires in a “materials” section and the
procedure separately in the “procedure” section. I like this
combined choice, though, for this design.
In accordance with the standardized guidelines for
informed consent, prospective participants were notified of the
27. potential risks and benefits of participating in the study before
being introduced to the research material. If the student verbally
agreed to participate, he or she was given one of three different
documents, each of which consisted of four parts or sections. In
part one of the study, the participant read a short scenario
concerning a paraplegic couple, Tina and Eugene, who
requested a taxi for a night out with friends. Each of the three
documents depicted the same initial situation with alternate
conditions (changeable, unchangeable, or neutral) that
ultimately led to different outcomes of events. Comment by
Ryan Winter: Noting the IV helps a lot. You can tell the author
knows what his IV is. There is only one, with three levels
In the changeable condition, the taxi driver arrived to pick
up the couple, only to promptly decline their fare upon seeing
that they were both paraplegic. Without enough time to call for
another taxi, Tina and Eugene decided to take Tina’s car, which
was handicap equipped. In order to reach their destination, they
had to cross a bridge that had been weakened the night before
due to a severe storm. The damaged bridge collapsed mere
minutes before the couple reached it. Unable to see the missing
portion of the bridge in the night, Tina and Eugene drove off the
road, into the river below, and drowned. The taxi driver, who
had left 15 minutes earlier, managed to make it safely across,
before the collapse. In the unchangeable condition, the situation
remained mostly the same with the exception that the taxi driver
arrived at the bridge after it had collapsed and plummeted into
the water as well. He managed to make it out of the car and
swim to safety, but Tina and Eugene drowned. In the neutral
condition, the taxi arrived to pick up the couple but promptly
refused their fare as soon as he realized that they were both
paraplegic. In this condition, the taxi driver did eventually
agree to take Tina and Eugene to their destination downtown,
albeit after much argument. Due to the recently collapsed
bridge, the taxi driver drove his passengers and himself off the
road and into the river below. He barely managed to make it out
of the car before drowning. Tina and Eugene’s outcome
28. remained the same. Comment by Ryan Winter: Notice how
thorough the description of the scenario is here. If you wanted
to replicate this study, you would know exactly what to do
because the author tells you exactly what she did. Make sure the
description of your IV is equally clear.
After reading one of the scenarios described above, the
participant continued on to the remainder of the study, which
was composed of a series of open, partially open, and close-
ended questions. In part two, the student participating in the
study was asked to procure as many ‘If Only’ statements as
possible, meaning that they had to list all the factors they could
think of that could have possibly changed the outcome of the
event. In part three, the participant was presented with a series
of questions about their thoughts regarding the specific
situation they read about. After reading each question, the
participant was asked to record his or her response in a scale of
one to nine. These questions included how avoidable they
thought the accident was (1 = not at all avoidable, 9 = very
avoidable), the causal role of the taxi driver in the couple’s
death (1 = not at all causal, 9 = the most important cause), their
thoughts on how much control the taxi driver had (1 = no
control, 9 = complete control), the negligence of the taxi driver
(1 = not at all negligent, 9 = completely negligent), how much
money for damages the taxi driver was responsible for (1 = no
money, 9 = as much as possible), the foreseeability of the
couple’s death (1 = not at all foreseeable, 9 = completely
foreseeable), and how much blame the taxi driver deserved for
the event (1 = no blame at all, 9 = total blame). The last
question of part three was a yes or no question that asked the
participant whether the taxi driver agreed to drive the couple or
not. This final question served as an attention check, which
informed us if the participant was actually attentive to the study
and allowed us to exclude potentially misrepresentative
responses form our data. Part four asked for the participant’s
demographic information, including gender, age, ethnicity, their
first language, and whether they were a student at Florida
29. International University. Concluding the study, the participant
was debriefed on his or her contribution to the study as well as
our insights on counterfactual thinking and our main hypothesis.
Comment by Ryan Winter: You know exactly what the
DVs are here, and you know the range for each scale. This is
VERY important. If you tell me the scale was 1 to 9 but that is
it, I won’t know if 1 is a good score or a bad score. Does 9
mean they could avoid it or they could not avoid it? I need to
see both the scale AND the labels for the DV to make sense
Comment by Ryan Winter: You can see her procedure,
right! Very clear, very step-by-step
Although we had several dependent variables, our primary focus
involved the perceived blameworthiness of the taxi driver, the
number of ‘If Only’ statements the participants could create,
and the manipulation check regarding whether the driver agreed
to take the couple. We hypothesized that participants would find
the taxi driver more blameworthy for the couple’s death in the
changeable condition, since he refused to drive Tina and Eugene
while safely passing over the bridge himself. We also predicted
that the participants in the changeable condition would generate
more counterfactual (‘If Only’) statements than in the
unchangeable or neutral conditions.
Results Comment by Ryan Winter: Results is centered and
bold. The results section comes right after the methods – there
is no page break
Using survey condition (changeable vs. unchangeable vs.
neutral) as our independent variable and whether participants
recalled whether the taxi driver picked up the paraplegic couple
as the dependent variable, we ran a manipulation check in which
we saw a significant effect, X2(2) = 93.95, p < .001.
Participants in the changeable and unchangeable conditions
correctly said the taxi did not pick up the couple (95.2% and
90.5%, respectively) while few participants in the neutral
condition said the driver picked up the couple (4.8%). Phi
showed a large effect. This indicates that participants did pay
attention to whether the taxi driver picked up the couple. See
30. Appendix B. Comment by Ryan Winter: The chi square here
is useful for data that is nominal in nature (that is, there is no
numerical difference between factors). Here, they either read
about a taxi picking up the couple or they didn’t. We cannot
look at a mean or average value here (what is the average
between yes and no?), so the chi square looks at the number of
people who say yes and the number who say no. Here, we want
the participants in some conditions to say yes (if the taxi picked
up the couple) and no (if he didn’t pick them up) Comment by
Ryan Winter: I’ll need to see the tables for the crosstabs in the
appendix as well. Include both the crosstabs table and the chi
square table and make sure the numbers in the paragraph align
with the numbers in the table
For our main analysis, our first One-Way ANOVA test revealed
significant differences among our independent variable, the
scenario conditions (changeable, unchangeable, or neutral) and
our dependent variable, perceived blameworthiness of the taxi
driver, F(2, 122) = 3.55, p = .032. A subsequent Tukey post hoc
test supported our hypothesis by demonstrating that participants
were more likely to blame the taxi driver in the changeable
condition (M = 4.51, SD = 2.06) than in the unchangeable
condition (M = 3.38, SD = 2.14).. However, there were no
significant difference for perceived blame between the neutral
condition (M = 4.36, SD = 2.11) and either the changeable or
unchangeable conditions. These results indicate that in
situations where the outcome is perceived as mutable
(changeable), individuals are more likely to assign blame to the
actor who could have acted differently (unchangeable). See
Appendix C. Comment by Ryan Winter: A One Way ANOVA
is appropriate here since there are three levels to the single IV
and the DV is on an interval scale (it ranges from 1 to 9)
Comment by Ryan Winter: The student here provided an
exact p value. This is acceptable, though you can also use p <
.05, p > .05, or p < .01 where appropriate Comment by
Ryan Winter: As you can see, this student did find significance,
so she ran post hoc tests on the ANOVA using Tukey. But what
31. if there was no significance,? Well, look what happens in the
next ANOVA!
Comment by Ryan Winter: For this appendix, include the
descriptives, ANOVA, and post hoc tables from SPSS
We were also interested in the number of ‘If Only’ statements
generated for each condition. We ran a One-Way ANOVA test
using the different conditions (changeable, unchangeable, or
neutral) as our independent variable, and the number of
counterfactuals produced as our dependent variable. The results
revealed that the relationship between condition and number of
‘If Only’ statements produced was not significant, F(2, 123) =
1.79, p = .171. Our initial prediction that participants would
develop more counterfactuals in the changeable condition was
not supported since the number of counterfactuals generated in
the changeable condition (M = 5.41, SD = 2.21), the
unchangeable condition (M = 4.57, SD = 2.04), and the neutral
condition (M = 4.88, SD = 1.85) did not differ. Since the p-
value for the ANOVA test was not significant, there was no
need to run post hoc tests. See Appendix D. Comment by
Ryan Winter: So this student ran a second ANOVA, which I
think is best. But since the dependent variable used here was
scaled (confidence, which is on a 1 to 9 scale), the student
could have just as easily run a t-Test focusing on only two
levels of the IV. Let me show you what that might look like.
“We ran a t-Test looking only at the changeable and
unchangeable conditions as our independent variable and
number of If Only statements generated as our dependent
variable. The t-Test was not significant, t(72) = 1.76, p > .05.
Participants did not generate any more counterfactuals in the
changeable condition (M = 5.56, SD = 2.76) than in the
unchangeable condition (M = 4.36, SD = 2.06).”
I could do something similar comparing the changeable and
neutral conditions with a t-Test or comparing the neutral and
32. unchangeable conditions, but running three t-Tests is a lot.
Much easier to do it with one ANOVA, which looks at all three
comparisons at the same time! Comment by Ryan Winter: Even
though the ANOVA was not significant, I’d still like you to
provide the means and standard deviations for the analysis
Discussion Comment by Ryan Winter: Your discussion does
not need to be extensive, but I do want you to note whether you
supported or did not support your hypothesis and provide some
possible reasons for your findings. You can make some
educated guesses about what might be going on, but make them
reasonable!
We predicted that participants would place more blame on an
actor whose behavior led to an undesirable outcome (death)
when that actor could have acted differently primarily because
these participants would generate more “If Only” counterfactual
statements that would lead them to see the outcome could have
been avoided. Conversely, we predicted that participants who
read about an undesirable outcome that could not have been
avoided would assign less blame to the actor and would think of
fewer counterfactual “If Only” statements. Results partially
supported these predictions, as we did find more blame for in
the changeable condition compared to the unchangeable (though
neither differed from the neutral condition). However, the
number of counterfactual statements that participants generated
did not differ among our three conditions. It could be that
participants were unfamiliar with the counterfactual task, which
requires some deep thinking, though on a more unconscious
level they could have seen the changeable condition as
evidencing more elements of blame. This begs the question:
what if participants were forced to think deeper? This is the
focus of our second study. Comment by Ryan Winter: This
question here is actually a lead-in to the student’s next study.
Your own methods, results, and discussion paper can end here,
but keep in mind that your final paper is only halfway done
right now! In Paper III, IV, and V, you will help design a
follow-up study to your first study, so as you write this paper
33. try to think about what you would do differently and what you
might add in a follow-up study.
Appendix A – Demographics – Study One Comment by
Ryan Winter: Don’t forget to add your appendices to the paper.
I need to see one for each analysis (demographics, the chi
square, your first DV ANOVA, and your second DV ANOVA).
Make sure they are properly labeled and that the numbers in
your tables align with the numbers in your results section
Also note that normally you would not submit SPSS tables to a
journal. You can submit tables and figures, but not SPSS tables.
For this class, though, I want to make sure you did the
interpretation correctly and looked at the right tables, so I want
you to include the actual SPSS output in a series of appendices.
Comment by Ryan Winter: To add these charts, simply go
into your SPSS output. You can right-click on the table and then
copy it. Then just paste it into your appendix!
Alternatively, you can use the “Snipping tool” function
available on most computers. (Do a search for it!). This allows
you to draw a virtual box around text and then copy it like a
picture. Then just paste the picture into the appendix
Finally, your last option is to do the work by hand. Insert a
table with rows and columns and transfer over the information.
This is the hard way, though. Both of the options above took me
less than a minute. Recreating a table manually will take a much
longer time!
Appendix B – Crosstabs and Chi Square – Study One
34. Appendix C – ANOVA Blame – Study One Comment by
Ryan Winter: Make sure to give a good description of YOUR
dependent variable. In this paper, she looked at blame as a DV,
so she put that word here. Use YOUR dependent variable in the
description
Appendix D – ANOVA Number of Counterfactuals – Study One
Checklist – Paper II: Study One Methods, Results, and
Discussion
Use the check sheet below to make sure your paper is the best it
can be! Make sure you answer “Yes” to all questions before
submitting your paper! The first two sections duplicate the
Paper I checklist, but those elements in purple are unique to you
Methods / Results / Discussion Paper II
General Paper Format (This section is identical to the Paper I
Checklist)
Yes
No
1. Is everything in your paper (including headers, the main body
of your mini-literature review, and your references) in 12 point
Times New Roman font?
2. Is everything in your paper double spaced, including
references (here I mean the spacing above and below each line,
not the spaces following a period)?
35. 3. Do you have one inch margins on all sides of the paper (one
inch from the top of the page, one inch from the bottom, and
one inch from each side)
4. Are the first lines of all paragraphs indented another ½ inch
(or 1 ½ inches from the page edge)?
5. Are your paragraphs aligned left? (That is, text should be
flush left, with lines lining up on the left of the page, but text
should NOT line up on the right side of the page – it should
look ragged)
6. Do you need help figuring out how to configure a word
document in APA format (inserting headers, page numbers,
proper indents, etc.)? If YES or NO, I highly recommend
watching this video which walks you through setting up an APA
formatted paper!
http://www.youtube.com/watch?v=9pbUoNa5tyY
Title page (This section is nearly identical to the Paper I
Checklist)
Yes
No
Header
1. Do you have the phrase “Running head” in your header (with
a lower case h)?
2. Is the rest of your Running head title in ALL CAPS?
36. 3. Is your Running head in 12 point Times New Roman font?
4. Do you have a page number that is flush right (also in 12
point Times New Roman font)?
5. Is your header 50 characters or less (including spaces and
punctuation)?
Title / Name / Institution
1. Is your title 12 words or less (as recommended by the APA)?
2. Does your title describe your general paper theme (while
avoiding something blank like “Paper Two: Methods Results,
and Discussion”)? Note that your header and title can differ!
3. Do all title words with three letters or more start with a
capital letter?
4. Are your name and institution correct?
5. Are your title, name, and institution elements centered and in
12 point Times New Roman font?
Methods Section (New Information in this section)
Yes
No
37. Header
1. Is your header title present and identical to your header title
on the title page?
2. Is your header title in ALL CAPS and 12 point Times New
Roman font?
3. Does your header on this second page omit the phrase
“Running head”
4. Do you have a page number starting on page 2
Yes
No
Title for the methods section
1. Is the word “Methods” centered and in bold at the top of your
methods page?
Participants
1. Do you have the word “Participants” flush left and in bold,
right below the word “Methods”?
2. Did you list out your demographic characteristics, including
gender, age, and ethnicity / race?
38. 3. Did you provide the descriptive statistics for (means and
standard deviations) for age and italicize the letters M and SD?
4. Did you provide frequencies for gender and ethnicity/race
and italicize the N?
5. Did you refer readers to Appendix for the full listing of
demographic tables?
Materials and Procedure
1. Did you mention informed consent?
2. Did you discuss any instructions the participant may have
read?
3. Did you thoroughly describe any stimulus material that might
have occurred before your actual independent variables (and
photos, descriptions, profiles, questions, puzzles, etc.) that are a
part of your study?
4. Did you thoroughly describe your independent variable (IV)
in enough depth and detail that another researcher could
recreate your materials?
5. Did you give your IV a name that matches up with the name
you refer to in the results section?
39. 6. Did you describe all of your most relevant dependent
variables, noting the scales you used (e.g. “Yes / No”, “A scale
ranging from 1 (not at all likely) to 9 (very likely))” for EACH
of your DVs?
7. Did you fully describe what participants went through in the
study, noting the order in which they received study materials
(e.g. first informed consent, then IVs, DVs, and debriefing)?
8. Did you fully describe your attention check (manipulation
check) with enough detail that a reader unfamiliar with your
study could recreate it, and did you include the scale for that
attention check question?
9. Did you use the past tense when describing your methods
(seeing how you already collected the data, and therefore do not
discuss what participants will do)?
Results Section (New Information in this section)
Yes
No
1. Do you have the word “Results” centered and in bold,
immediately following the methods section?
2. Was the first dependent variable you looked at your
manipulation check question, and did you make sure you
analyzed the correct DV?
40. 3. Did you analyze at least two different dependent variables for
your other two analyses?
a. Note: using a t-Test to analyze a question Like #3) and an
ANOVA to once again analyze question #3 does NOT count as
two different DVs. It is the same DV analyzed twice. Make sure
to look at two different DVs
4. Did you mention both the IV and the DV by name when
talking about your analysis?
5. Did you include means and standard deviations within
parentheses for each level of your independent variable?
6. Did you italicize the letters F, t, p, M, SD, and X2 (where
appropriate)?
7. Did you round ALL numbers to two decimal places (with the
exception of the p value, which can go as low as p < .001 or p =
.001).
Discussion Section (New Information in this section)
Yes
No
1. Do you have the word “Discussion” centered and in bold,
immediately following the results section?
2. Did you remind your reader of your hypothesis?
41. 3. Did you mention whether you supported or did not support
your hypothesis?
Appendix Section – Study One (New Information in this
section)
Yes
No
1. Do you have the word “Appendix” centered on each
Appendix page, followed by a description of the appendix
content, immediately following the results section?
2. In Appendix A (Demographics), do you have SPSS tables for
gender, ethnicity, and age? (Note: Age might be in a general
“statistics” table, but you should have specific frequency tables
for both gender and ethnicity)
3. In Appendix B (Chi Square), do you have the crosstabs table
(with percentages) plus the chi square test (with Pearson)?
4. In Appendix C (ANOVA), do you have the descriptives table,
the ANOVA table, and the post hoc table for your first
dependent variable?
5. In Appendix D (ANOVA or t-Test), do you have the
descriptives table, ANOVA (or t-Test) table, and post hoc table
(for the ANOVA) for your second dependent variable?
42. 6. Do the analyses in Appendix C and D focus on DIFFERENT
dependent variables? (Make sure you answer YES on this one!)
Writing Quality
Yes
No
1. Did you proofread your paper, go to the writing center, go to
the research methods help center, or use the Pearson writer to
make sure your paper flows well?
2. Did you use the past tense (which is recommended, since
your papers in this class will reflect work you already did rather
than work you will do)?
3. Did you use a scientific / objective terms like “people”,
“participants”. “users”, “readers”, etc. (as opposed to subjective
words like “you”, “we”, “me”, “I”, or “us”, etc.)?
Running head: LET ME TAKE A SELFIE 1
Let me take a selfie: The meaning behind selfies
Dakarai Wintons
Florida International University
43. Let me take a selfie: The meaning behind selfies
Social media has become the virtual equivalent of the
gathering places of the past, facilitated by the very fact that
everyone can share this virtual world at any place they are at
whether it be home, school, or even work. Social media is not
only defined as "sharing" but also "archiving" not only a
showcase, but also a singular album, where you would be able
to admire yourself in various memories otherwise known as
selfies. The purpose of this paper is that we hypothesize that if
participants are exposed to selfie photos, then they will believe
that an Instagram user 1.) updates their profile picture more
frequently, 2.) make posts to their social media account more
often, and 3.) displays themselves as self-absorbed, selfish,
narcissistic, and egotistical, in comparison to participants that
are exposed to group or professional photos, though these latter
two conditions should not differ from each other in their
Instagram user ratings. Social media sites, such as Facebook,
Snapchat, and the most well-known Instagram, have been the
epitome of selfies. Selfies have been used, especially within the
youth community, as a form of self-presentation, in which
individuals not only posts selfies based on their appearance, but
also showing their personality and their character for others to
see. They say that a picture is worth a thousand words, and with
selfies, it said a lot about that individual.
According to an article, prior research suggests that
individuals uses social network sites for things such as; social
interaction, self-expression, information seeking and relaxation
(Kim, Sohn & Choi, 2011). What defines a selfie? The term is
used for individuals to take pictures of themselves to show who
44. their own identity and their personality. Selfies have become
the focal point and one of the biggest reasons as to why
individuals uses social network sites. Social network sites, like
Snapchat and Instagram, has allowed individuals to use that
form of expression to present themselves more rapidly. Despite
selfies being a picture, it can display different types of
behaviors. Narcissism is one behavior that is typically the
behavior that comes to mind when associating it with the term
selfie. Narcissism refers to a personality of an individual’s self-
view of themselves, especially concerning their physical
appearance and popularity. According to an article, narcissistic
individuals are more likely to present self-promotional content
(Carpenter, 2012). Holtzman and Strube (2010) also noted that
physical attractiveness is the underlying cause of narcissits’
self-focus and public display. The effect of satisfactory of
oneself appears to be stronger towards individuals who posts
more on the social media sites. Showing narcissistic and
egoistical behavior can influence individuals with taking more
selfies and posting more often than if they were in a group or a
professional setting.
Narcissism promotes self-love and taking selfies could be
a strong indicator that the individual displays narcissistic and
self-absorbed type of behavior; that they only care about their
physical appearance and always showing themselves off to
become the envy of others that view their selfies. In the article,
ox and Rooney used data from a nationally representative
sample of 1,000 men between 18 and 40 years old. Participants
completed personality questionnaires assessing the dark triad
and self-objectification. They were asked how many selfies they
had taken and posted on social media in the last week, as well
as how many other photos they had posted and how much time
they spent on social media sites. They were also asked to rate
how often they used various methods to make themselves look
better in pictures, such as cropping, filtering, and re-touching.
Results showed that both narcissism and self-objectification
were associated with spending more time on social
45. network sites, and with more photo-editing. Thus, posting
numerous selfies was related to both higher narcissism and
psychopathy. This also further indicates that posting selfies on
social media constantly is a good strategy for narcissists to
improve their self-views (Fox, J., & Rooney, M. C. ,2015).
Narcissism is not the only known behavior that has been
displayed in individuals who take selfies, studies have shown
that self-esteem is another behavior that can be the cause of
individuals posting numerous selfies on social media sites. Self-
esteem is an important factor when it comes to youth
community and when it comes to social media. Often, many
view others who posts numerous selfies and interpret them as
being conceited or only caring about themselves. Many people
often associate individuals that posts many selfies, receiving
many likes and comments, as a way of wanting attention from
others because they feel they are important and should have all
the attention. But believe it or not, individuals who posts selfies
often are more than likely having problems with low self-
esteem. According to the selfie phenomenon article, individuals
who posts more frequently of themselves do not think to highly
of themselves and therefore; these individuals posts selfies on
social media to gain others approval. The more positivity the
person receives from their selfie posts, the more they will
continuously post selfies on social media. This can cause the
individual to have a reinforcement type behavior, to where they
will constantly post selfies to always receive positive feedback
of themselves. Individuals that displays low self-esteem
behavior, is often depressed about themselves after viewing
other people’s selfies. They feel that their lives are a lot less
interesting and that they are not important. However, if they
continually receive positive feedback of their selfies, they
would be put in a famous-like mind state.
Some studies explain that self-awareness negatively
affects self-esteem. This is because taking selfies could
possibly lower one’s self-esteem. However, studies have
assumed that self-esteem may also likely increase one’s self-
46. esteem after sharing numerous selfies. In the article, when
people attempt to share their own selfies on social media, it
becomes easier for them to self-present themselves in their
selfies. For individuals with a low self-esteem, taking as many
selfies can create a mask of that person. For those individuals,
it hides their fear and vulnerability that others may not be able
to see through their selfie posts.
Overall, in conjunction with my hypothesis stated earlier, I
feel that the research that was presented proved that my
hypothesis is substantial. It seems that based on studies that
were tested, individuals that posts selfies more frequently on
social media, are likely to display behaviors of narcissism and
change their profiles quite frequently as well. However, I do
feel that from the research, I also found that individuals that
posts often do not always display narcissistic behavior. Self-
esteem is a behavioral factor to consider when looking at
individuals posts on social media. Instead of only showing how
self-absorbed and proud the individuals are with themselves,
they can also show how insecure they are, and how much they
rely on social media to give them positive feedback of
themselves.
In conclusion, although my hypothesis seemed to be
substantial, I felt that there is not enough for it to be considered
testable because selfies can display all types of different
behaviors not only negative behaviors, but positive as well.
Also, I felt that the type of character that is displayed from that
individual on social media can vary. Frequently posting on their
social media does not solely subject them to being narcissistic
or having low self-esteem, it can be looked in a positive light,
showing that the individual is just confident and happy with
their lives and themselves, that they want to share that with
everyone else. Depending on the individual, selfies can be
looked at as being positive or negative aspects to social media.
47. References
Carpenter, C. J. (2012). Narcissism on Facebook: Self-
promotional and anti-social behavior. Personality and Individual
Differences, 52, 482–486.
Kim, Y., Sohn, D., & Choi, S. M. (2011). Cultural difference in
motivations for using social network sites: A comparative study
of American and Korean college students. Computers in Human
Behavior, 27, 365–372
Fox, J., & Rooney, M. C. (2015). The Dark Triad and trait self-
objectification as predictors of men’s use and self-presentation
behaviors on social networking sites. Personality & Individual
Differences, 76, 161-165. doi: 10.1016/j.paid.2014.12.017
R. Wang, F. Yang, M. M. Haigh, Let me take a selfie: Exploring
the psychological effects of posting and viewing selfies and
groupies on social media. Telematics and Informatics, 34(4)
(2017) 274-283.
Holtzman, N. S., & Strube, M. J. (2010). Narcissism and
attractiveness. Journal of Research in Personality, 44(1), 133–
136.