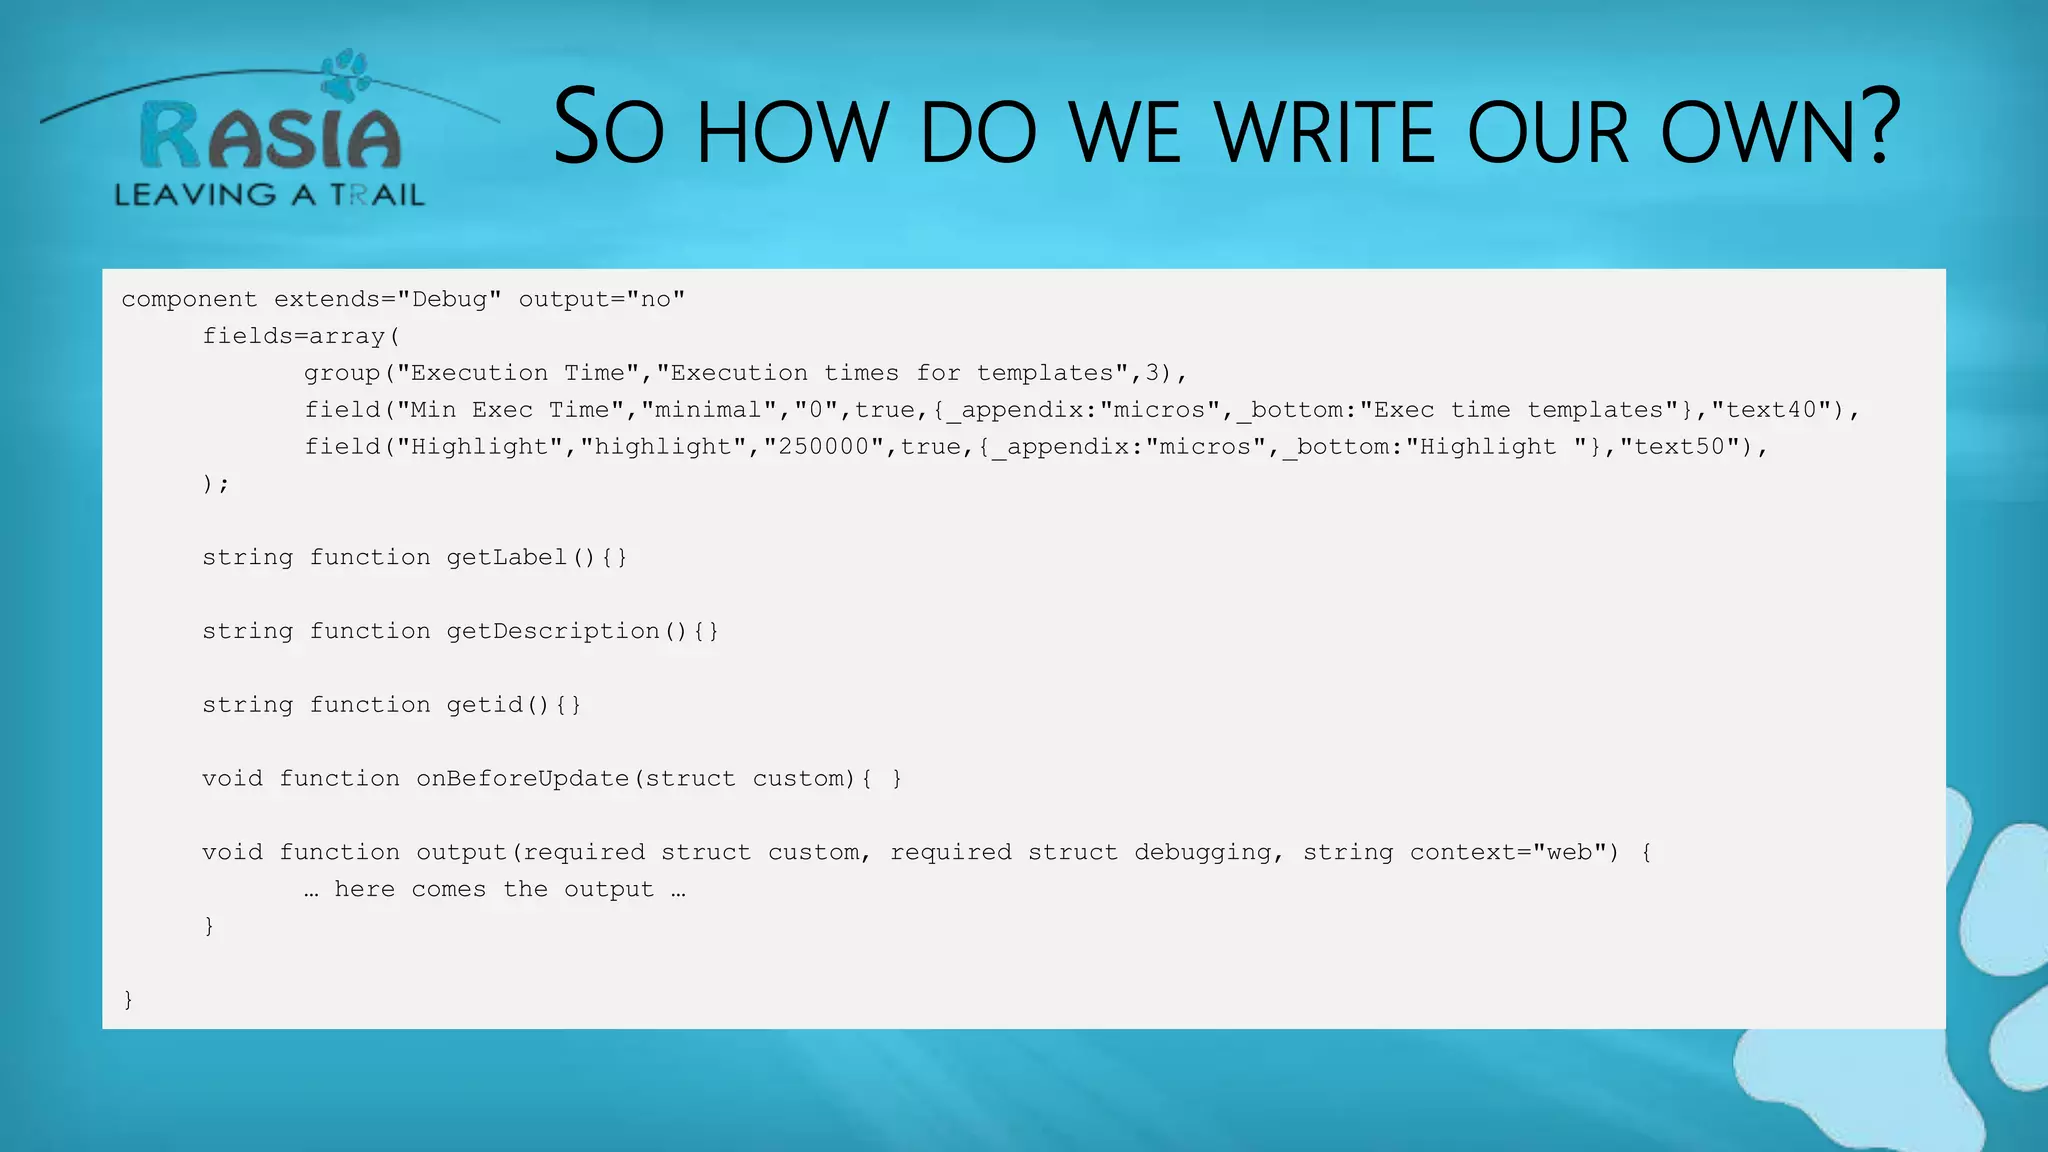
Debugging templates DIY
Gert Franz
Rasia GmbH
MY EVOLUTION
Assembler  Basic  Clipper  Pascal  Delphi  Java  CFML  Lucee
WHO AM I?
• Gert Franz
– Involved with Lucee and Railo since day 1
– Into CFML for 17 years
– DBA, System architect
– CTO Rasia Ltd, CTO Rasia CH
• Rasia is founding Member of the Lucee
association
WHO AM I?
• Studied Astrophysics in München
• Basic, dBase, Clipper, Visual Basic, Delphi, Java
• Performance, DB & Code Tuning is my professional
Hobby
• I live in Switzerland
• Lucee training, consulting, support etc.
Official definition:
Determines how to display
debugging output
DEBUGGING IN LUCEE
• Consists of 2.5 parts
• Enabling debugging
• Selecting the debugging template
• Using the debugging logs
OK SO LET'S HAVE A LOOK
WHAT YOU END UP WITH:
TEMPLATES? WHAT? WHERE?
• A debugging template in Lucee is:
– A cfc located in a specific folder
– Containing a body needed for configuration
– Containing a method called "output" which handles
the display of the data
LET'S INSPECT THE CLASSIC.CFC TEMPLATE
• Content of the body of the CFC
– Is not necessary for execution
– Only cofiguration
• Output method
• Arguments of the output method
ARGUMENTS SCOPE OF FUNCTION OUTPUT
• Custom
• Debugging
• Context
A CLOSER LOOK AT THE DEBUGGING ARGUMENT
• The debugging argument contains all
important information collected througout a
request:
DATASOURCES
ALL DUMPS WITH TARGET DEBUG
• Great – this does not work ATM, I filed a ticket
that it is broken
ALL EXCEPTIONS (SILENT OR NOT)
HISTORY (CALLSTACK)
• The callstack tells us, in what order
(by ID) the templates have been
called
• This would allow us to display the
callstack
IMPLICIT ACCESS
• In this section you get all the
variables, that are called by
following the rules of scope
cascading. If you see none,
two reasons:
– Feature is disabled
– Your programming is impecable
PAGEPARTS
• This feature has been implemented for one of
the upcomin tools which will tell you the slow
parts in your application
PAGES
QUERIES
TIMERS
• Mostly used for testing
• If you don't want your output to be disturbed
by the timer output
• Generated by the tag CFTIMER
TRACES
• If you want to follow a variables state
througout the request, you can use the tag
CFTRACE
• It is kind of like a dump output="debug"
ANY IDEAS FOR IMPORVEMENTS
• Make the layout nicer
• Toggle sections
• Group items
• Show percentages and heat maps
ADDITIONAL IDEAS
• Callstack
• Session size information
• Filtering, either client or server side
SO HOW DO WE WRITE OUR OWN?
• Simple. Create a CFC
– Where?
• Server side:
– server-config-dir/context/context/admin/debug
• Webcontext side
– web-context-dir/context/admin/debug
SO HOW DO WE WRITE OUR OWN?
• Name the CFC individually so that it does not
get overwritten
• Add a body and one method like follows
SO HOW DO WE WRITE OUR OWN?
component extends="Debug" output="no"
fields=array(
group("Execution Time","Execution times for templates",3),
field("Min Exec Time","minimal","0",true,{_appendix:"micros",_bottom:"Exec time templates"},"text40"),
field("Highlight","highlight","250000",true,{_appendix:"micros",_bottom:"Highlight "},"text50"),
);
string function getLabel(){}
string function getDescription(){}
string function getid(){}
void function onBeforeUpdate(struct custom){ }
void function output(required struct custom, required struct debugging, string context="web") {
… here comes the output …
}
}
CFADMIN ACTION="SURVEILLANCE"
• This is a very interesting tag that allows you to
see what's going on on your server
• It also contains the debugging information
generated up to that time
LET'S HAVE A LOOK
• I am creating several calls and then do a
cfadmin action="surveillance"
• Let's inspect the code from there.
BTW• I am working on a debugging console again 

Lucee writing your own debugging template

  • 1.
  • 2.
    MY EVOLUTION Assembler Basic  Clipper  Pascal  Delphi  Java  CFML  Lucee
  • 3.
    WHO AM I? •Gert Franz – Involved with Lucee and Railo since day 1 – Into CFML for 17 years – DBA, System architect – CTO Rasia Ltd, CTO Rasia CH • Rasia is founding Member of the Lucee association
  • 4.
    WHO AM I? •Studied Astrophysics in München • Basic, dBase, Clipper, Visual Basic, Delphi, Java • Performance, DB & Code Tuning is my professional Hobby • I live in Switzerland • Lucee training, consulting, support etc.
  • 7.
    Official definition: Determines howto display debugging output
  • 8.
    DEBUGGING IN LUCEE •Consists of 2.5 parts • Enabling debugging • Selecting the debugging template • Using the debugging logs
  • 9.
    OK SO LET'SHAVE A LOOK
  • 10.
    WHAT YOU ENDUP WITH:
  • 12.
    TEMPLATES? WHAT? WHERE? •A debugging template in Lucee is: – A cfc located in a specific folder – Containing a body needed for configuration – Containing a method called "output" which handles the display of the data
  • 14.
    LET'S INSPECT THECLASSIC.CFC TEMPLATE • Content of the body of the CFC – Is not necessary for execution – Only cofiguration • Output method • Arguments of the output method
  • 15.
    ARGUMENTS SCOPE OFFUNCTION OUTPUT • Custom • Debugging • Context
  • 16.
    A CLOSER LOOKAT THE DEBUGGING ARGUMENT • The debugging argument contains all important information collected througout a request:
  • 17.
  • 18.
    ALL DUMPS WITHTARGET DEBUG • Great – this does not work ATM, I filed a ticket that it is broken
  • 19.
  • 20.
    HISTORY (CALLSTACK) • Thecallstack tells us, in what order (by ID) the templates have been called • This would allow us to display the callstack
  • 21.
    IMPLICIT ACCESS • Inthis section you get all the variables, that are called by following the rules of scope cascading. If you see none, two reasons: – Feature is disabled – Your programming is impecable
  • 22.
    PAGEPARTS • This featurehas been implemented for one of the upcomin tools which will tell you the slow parts in your application
  • 23.
  • 24.
  • 25.
    TIMERS • Mostly usedfor testing • If you don't want your output to be disturbed by the timer output • Generated by the tag CFTIMER
  • 26.
    TRACES • If youwant to follow a variables state througout the request, you can use the tag CFTRACE • It is kind of like a dump output="debug"
  • 27.
    ANY IDEAS FORIMPORVEMENTS • Make the layout nicer • Toggle sections • Group items • Show percentages and heat maps
  • 28.
    ADDITIONAL IDEAS • Callstack •Session size information • Filtering, either client or server side
  • 29.
    SO HOW DOWE WRITE OUR OWN? • Simple. Create a CFC – Where? • Server side: – server-config-dir/context/context/admin/debug • Webcontext side – web-context-dir/context/admin/debug
  • 30.
    SO HOW DOWE WRITE OUR OWN? • Name the CFC individually so that it does not get overwritten • Add a body and one method like follows
  • 31.
    SO HOW DOWE WRITE OUR OWN? component extends="Debug" output="no" fields=array( group("Execution Time","Execution times for templates",3), field("Min Exec Time","minimal","0",true,{_appendix:"micros",_bottom:"Exec time templates"},"text40"), field("Highlight","highlight","250000",true,{_appendix:"micros",_bottom:"Highlight "},"text50"), ); string function getLabel(){} string function getDescription(){} string function getid(){} void function onBeforeUpdate(struct custom){ } void function output(required struct custom, required struct debugging, string context="web") { … here comes the output … } }
  • 32.
    CFADMIN ACTION="SURVEILLANCE" • Thisis a very interesting tag that allows you to see what's going on on your server • It also contains the debugging information generated up to that time
  • 33.
    LET'S HAVE ALOOK • I am creating several calls and then do a cfadmin action="surveillance" • Let's inspect the code from there.
  • 34.
    BTW• I amworking on a debugging console again 

Editor's Notes

  • #8 http://www.carehart.org/blog/client/index.cfm/2010/3/12/ultimate_cf_debugging_output_template_alternatives
  • #9 I used to have a debugging template in the past, where I was able to see the debugging information of the last 10 requests that have ran on a server. It was called debugging-console. From that the debugging console the current log for debugging information was created
  • #11 We designed this page to mimic the classic debugging template we all know from ACF. That hasn't changed in YEARS Problems with this template: Very hard to read Very long Not the most effective way to help you debug your code
  • #12 The information that you get is ok, it is necessary and important information. But hey, try to debug some code created with Coldbox or any other more sophisticated framework.
  • #13 Let's have a look where the debugging templates are located Be aware, that if you change one of the existing debugging templates, they might be overwritten by any update that you make on Lucee When Lucee starts, it deploys ist default files into the different folders. So, either: Create your own new debugging template based on an existing one (saved with a new filename) Create the debugging template locally in the WEB-INF folder of your web context
  • #16 While we can ignore the third argument (it will contain mostly the string "web"), the other two are very interesting Custom contains the configuration data, entered when selecting the debugging template in the Lucee admin And Debugging will contain the actual data, which is highly interesting.
  • #21 History (calling history for the stacktrace) pageParts (for one of the upcoming tools) Pages (template execution times etc.) Queries (Query execution times etc.) Timers Traces
  • #22 Ok, what is this? The implicitAccess gives you information about the variables that have NOT been properly scoped. Like query variables within functions or cgi and form variables without their corresponding scope preceding. Be aware that this feature eats loads of performance. DON'T turn it on in production
  • #24 This is an important key. It contains all the CFM/CFC templates that have been called
  • #25 A column which is important is the usage column. It will tell us which column of the resulted query has been used in the request and which one hasn't. This allows us to improve the performance and the data transfer between the DB server and the Lucee server
  • #30 Talk about
  • #32 If you need some help with the fields on top, have a look at other cfc's in the context directory. ALL of them have similar entries