Download to read offline
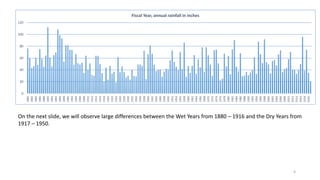
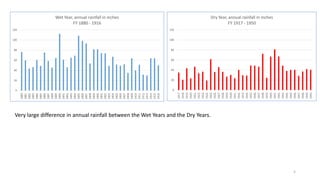
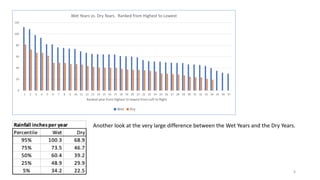
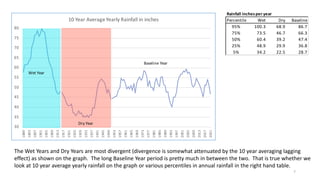
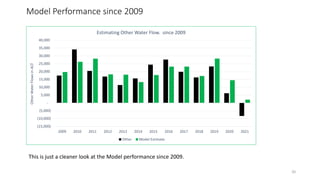

The document presents a drought analysis for the Marin Municipal Water District, detailing historic rainfall data and drought occurrences from 1880 to 2021. It highlights significant differences between wet years (1880-1916) and dry years (1917-1950), with an emphasis on recent drought trends and water flows. The report concludes with a review of fiscal year 2021, noting a record low reservoir level primarily due to low rainfall.