Investment Idea - ICICI Bank Ltd - HOLD
•
1 like•95 views

Catch the latest Equity research reports from Fullerton Securities at http://www.fullertonsecurities.co.in/equity/markets/research_reports.aspx

Recommended
Recommended
More Related Content
What's hot
What's hot (20)
Similar to Investment Idea - ICICI Bank Ltd - HOLD
Similar to Investment Idea - ICICI Bank Ltd - HOLD (20)
More from Fullerton Securities
More from Fullerton Securities (20)
Recently uploaded
Recently uploaded (20)
Investment Idea - ICICI Bank Ltd - HOLD
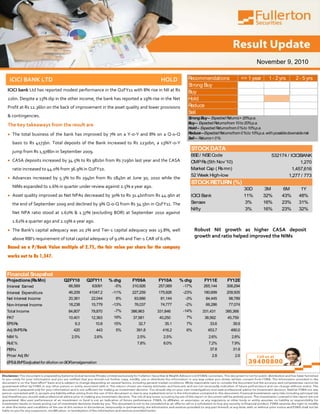
- 1. November 9, 2010 ICICI BANK LTD HOLD ICICI bank Ltd has reported modest performance in the Q2FY11 with 8% rise in NII at Rs 22bn. Despite a 13% dip in the other income, the bank has reported a 19% rise in the Net Profit at Rs 12.36bn on the back of improvement in the asset quality and lower provisions & contingencies. The key takeaways from the result are The total business of the bank has improved by 7% on a Y-o-Y and 8% on a Q-o-Q basis to Rs 4173bn. Total deposits of the Bank increased to Rs 2230bn, a 13%Y-o-Y jump from Rs 1,978bn in September 2009. CASA deposits increased by 34.5% to Rs 981bn from Rs 729bn last year and the CASA ratio increased to 44.0% from 36.9% in Q2FY10. Advances increased by 5.3% to Rs 194bn from Rs 184bn at June 30, 2010 while the NIMs expanded to 2.6% in quarter under review against 2.5% a year ago. Asset quality improved as Net NPAs decreased by 30% to Rs 31.4bnfrom Rs 44.9bn at the end of September 2009 and declined by 9% Q-o-Q from Rs 34.5bn in Q1FY11. The Net NPA ratio stood at 1.62% & 1.37% (excluding BOR) at September 2010 against 1.62% a quarter ago and 2.19% a year ago. The Bank's capital adequacy was 20.2% and Tier-1 capital adequacy was 13.8%, well above RBI's requirement of total capital adequacy of 9.0% and Tier-1 CAR of 6.0%. Based on a P/Book Value multiple of 2.75, the fair value per share for the company works out to Rs 1,347. Robust NII growth as higher CASA deposit growth and ratio helped improved the NIMs Recommendations <= 1 year 1 - 2 yrs 2 - 5 yrs Strong Buy Buy Hold Reduce Sell StrongBuy– ExpectedReturns> 20%p.a. Buy– ExpectedReturnsfrom 10to20%p.a. Hold– ExpectedReturnsfrom 0%to10%p.a. Reduce–ExpectedReturnsfrom 0%to10%p.a.with possibledownsiderisk Sell – Returns< 0% BSE/ NSECode CMPRs(5th Nov’10) Market Cap ( Rsmn) 52 Week High-low 30D 3M 6M 1Y ICICI Bank 11% 32% 43% 48% Sensex 3% 16% 23% 31% Nifty 3% 16% 23% 32% 1,277 / 773 STOCKRETURN (%) STOCKDATA 532174 / ICICIBANK 1,270 1,457,616 Projections(RsMn) Q2FY10 Q2FY11 % chg FY09A FY10A % chg FY11E FY12E Interest Earned 66,569 63091 -5% 310,926 257,069 -17% 265,144 308,294 Interest Expenditure 46,209 41047.2 -11% 227,259 175,926 -23% 180,699 209,505 Net Interest Income 20,361 22,044 8% 83,666 81,144 -3% 84,445 98,789 Non-Interest Income 18,238 15,779 -13% 76,037 74,777 -2% 66,286 77,074 Total Income 84,807 78,870 -7% 386,963 331,846 -14% 331,431 385,368 PAT 10,401 12,363 19% 37,581 40,250 7% 38,562 45,759 EPSRs 9.3 10.8 15% 32.7 35.1 7% 33.6 39.9 Adj BVPSRs 420 443 5% 391.8 416.2 6% 453.7 490.0 NIM % 2.5% 2.6% 2.5% 2.5% 2.6% 2.8% RoE% 7.8% 8.0% 7.2% 7.9% PERx 37.8 31.9 Price/ Adj BV 2.8 2.6 EPS&BVPSadjusted for dilution on BORamalgamation Financial Snapshot
- 2. November 9, 2010 OTHER HIGHLIGHTS During the quarter, the Bank received approval of Reserve Bank of India (RBI) for merger of Bank of Rajasthan which was effective from August 12, 2010. The financials for Q2-2011 reflects the Bank of Rajasthan financials for the period August 13, 2010 to September 30, 2010. The management has indicated strong loan growth going forward, driven by corporate, international and retail loans. Growth in the retail loans is expected to be from the home and auto loans. In addition, the bank expects project financing to do well in Q3 and Q4 FY11. We believe that earnings growth in Q2FY11 results will be sustained in the coming quarters, led by higher margins and decline in loan provisions. We expect ICICI Bank Ltd’s NII to grow at a CAGR of 10% over FY2010-12 to Rs 98.8bn by FY2012. We further estimate that PAT would grow at a CAGR of 7% over FY2010-12 to 45.8bn in FY2012. Based on a P/Book Value multiple of 2.75, the fair value per share for the company works out to Rs 1,347. We recommend a ‘HOLD’ rating on the stock. The Bank had 2,501 branches, the largest branch network among private sector banks in the country. The bank has witnessed no accretion to NPL's from the ICICI books in the quarter under review The bank's operating expenses grew by 10.2% Y- o-Y owing to 38.9% Y-o-Y growth in employee expenses Particulars(RsMn) FY2008 FY2009 FY2010 FY2011E FY2012E Interest Earned 307,883 310,926 257,069 265,144 308,294 Interest Expenditure 234,842 227,259 175,926 180,699 209,505 Net Interest Income 73,041 83,666 81,144 84,445 98,789 Other Income 88,108 76,037 74,777 66,286 77,074 Total income 395,991 386,963 331,846 331,431 385,368 Non-Interest Expense 81,542 70,451 58,598 60,983 73,220 Provisions&Contingencies 29,046 38,083 43,869 38,333 41,632 Less: Tax 8,984 13,588 13,203 12,854 15,253 Profit After Tax 41,577 37,581 40,250 38,562 45,759 EPS(Rs) 36 33 35 34 40 Adjusted Book Value (Rs) 377.4 391.8 416.2 453.7 490.0 Net Interest Margin (%) 2.2% 2.5% 2.5% 2.6% 2.8% RoA (%) 1.1% 1.0% 1.1% 1.0% 1.1% RoE(%) 11.6% 7.8% 8.0% 7.2% 7.9% Valuation Ratios(x) FY2011E FY2012E P/E 37.8 31.9 Price/ BV 2.6 2.4 Price/Adjusted BV 2.8 2.6 EPS&BVPSadjusted for dilution on BORamalgamation Financial Analysisand Projections