Downloaded 87 times

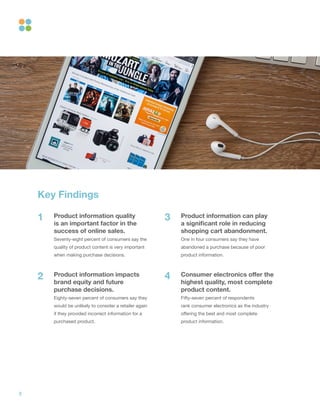
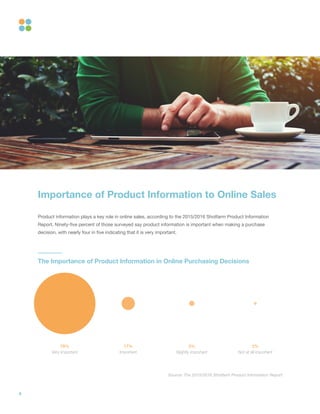
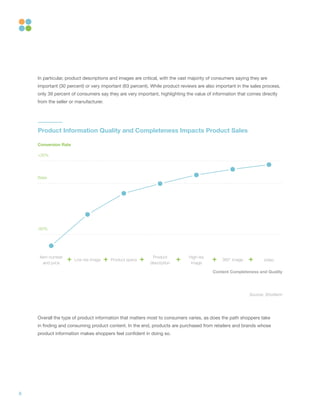

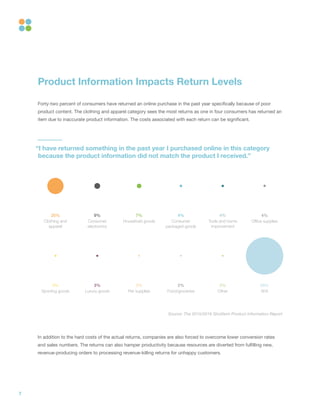
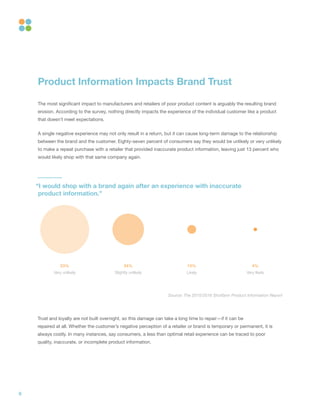
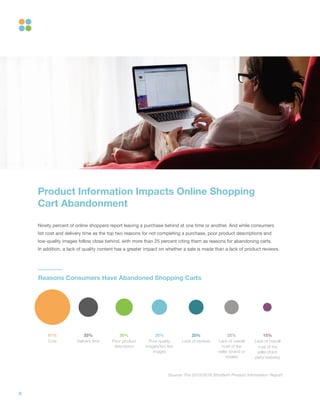
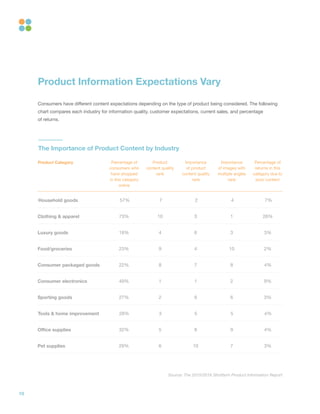
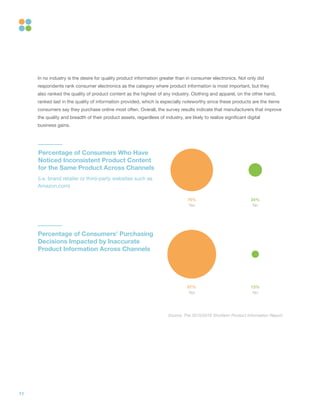


The 2015/2016 Shotfarm Product Information Report highlights the critical impact of product information quality on online retail success, revealing that 95% of consumers find it important for purchase decisions, with 78% deeming it very important. Poor product content leads to increased returns and brand erosion, as 42% of consumers have returned online purchases due to inadequate information. To enhance sales and minimize returns, manufacturers must improve the quality and consistency of the product information they share with retailers.


![[FW Invest] 1,16 milliard d’euros investis dans la Tech au premier semestre, ...](https://cdn.slidesharecdn.com/ss_thumbnails/fw-invest-201706-s1-170705082543-thumbnail.jpg?width=640&height=640&fit=bounds)

![[FW Invest Mai] Près de 187 millions d’euros levés dans la Tech en mai, l’amo...](https://cdn.slidesharecdn.com/ss_thumbnails/fw-invest-201705-1-170605073853-thumbnail.jpg?width=640&height=640&fit=bounds)

![[rokonz.com] Glossary of Semantic SEO Part-1.pdf](https://cdn.slidesharecdn.com/ss_thumbnails/rokonz-260123200456-440e4060-thumbnail.jpg?width=640&height=640&fit=bounds)


![[rokonz.com] Glossary of Semantic SEO Part-2.pdf](https://cdn.slidesharecdn.com/ss_thumbnails/rokonz-260123200719-92199ba8-thumbnail.jpg?width=640&height=640&fit=bounds)


