This document provides instructions for using domain analysis, a method for understanding how people view a topic area. Domain analysis involves identifying elements in the topic area and having participants rate the elements based on characteristics and their opposites. The results are interpreted by looking for similarities between elements and characteristics. The overall goal is to uncover people's mental models of a domain and identify opportunities for problem solving or learning.
2. (2011).
Correct Citation: Jacques M. Chevalier and Daniel J. Buckles.
2011. A Handbook for Participatory Action
Research, Planning and Evaluation. Ottawa, Canada: SAS2
Dialogue.
Copyright SAS
Dialogue
http://www.sas2.net
http://www.sas2.net
http://www.sas2dialogue.com
http://www.sas2dialogue.com
Module 6
Understanding Systems
119
SAS
Dialogue
120
SAS
Dialogue
Purpose To describe how people view a domain or topic area,
and create new learning opportunities based on this
3. understanding.
PRINCIPLES
The theory of human understanding underlying Domain
Analysis is a social adaptation of Personal
Construct Psychology, a well-known theory in Psychology and
the Cognitive Sciences developed in the
1950s by George Kelly. The key assumption is that people
understand a domain by dividing it into
parts and creating a description of the whole based on
comparisons (or degrees of similarity and
difference) between the parts. For example, to know the
meaning of ‘tasty food’ requires not only a
sense of what ‘tasty foods’ have in common but also words and
ideas to describe the opposite. In
Personal Construct Psychology, domain parts are called
elements and the contrasting characteristics
are called constructs. The social adaptation presented below
builds on this perspective by showing
how stakeholder groups create and organize elements and their
contrasting characteristics for a domain or topic area. The
method
uncovers ways people make sense of reality in a particular
context and helps create opportunities for problem solving and
learning.
Domain Analysis can be applied to any topic including things in
nature (Ecological Domain), activities (Activity Domain),
problems (Problem
Domain), stakeholder profiles (Social Domain), and options for
action (Option Domain). Following are detailed instructions for
the tool, which can
be adapted for these specific applications (see examples below).
4. Information gathering and analysis can be done manually, as
described below,
or using the software RepGrid (http://regrid.com).
Step 1 Define the domain or topic area and identify at least six
elements and no more than 12 that belong to the domain. These
should
be concrete, distinct and clearly defined. If the elements are
vague, use the Laddering Down method in Active Listening to
make
them more specific and meaningful. Ask “What do you mean by
this?” or “Can you give an example of this?”. Another option is
to
use description and storytelling to explore the topic, and then
use this information to identify the elements. Write or draw
each
element on its own card with a brief description on the back of
the card.
Step 2 Decide on a rating scale with a range from 1-5 or 1-7
(see Scoring Tips). Create a table on the floor or wall with the
term
‘Characteristics’ at the top of Column 1.
Step 3 If necessary, discuss or provide one key characteristic
participants want to explain in light of a problem-solving
exploration of the
domain. Write the key characteristic on a card, using one or two
key words and give it a score of 1. Then, identify the opposite
of
the key characteristic on the same card and give it a score of 5
(or 7). Place the card showing these two opposite characteristics
and the corresponding scores in the second row of the first
column. (This step and the next two steps are optional.)
5. Step 4 Rate all the elements using the key characteristic and its
opposite and the rating scale (from 1 to 5, for instance). Discuss
the score for
each element until participants agree. Record each score on its
own card and write the reason given for each score on the
reverse side of
its card or on a flip chart. Place each score card in the row for
the key characteristic, below the corresponding element.
Reconstructing models of reality
Domain Analysis
121
SAS
Dialogue
http://re
http://re
Step 5 To facilitate interpretation of the table, reorganize all
the elements in order based on the ratings given for the key
characteristic.
Step 6 To elicit other characteristics from participants, choose
three element cards from the top row at random. Identify two of
them (a pair)
that are the same in some important way, and different from the
third. Identify what it is these two elements have in common
that is also
relevant to the topic. Write the characteristic on a new card and
give it a score of 1. Then, identify the opposition or contrast
6. that makes
the third element different from the pair. Write this opposite or
contrasting characteristic on the same card and give it a score of
5 (or
7). Examples of opposite characteristics are: a good leader – an
ineffective leader; reliable – unreliable; safe - risky; etc. Place
the card
showing these two opposite or contrasting characteristics and
the corresponding scores in the third row of the first column.
Step 7 Repeat the process described in Step 6 to identify other
sets of opposite or contrasting characteristics and add a new
row for each set.
Step 8 Rate all the elements using each characteristic and its
opposite and the rating scale created in Step 2. Discuss
the score for each element until participants agree.
Record each score on its own card and write the reason
given for each score on the reverse side of its card or on
a flip chart. Place each score card in its row, below the
corresponding element.
INTERPRETING THE RESULTS
Step 9 To interpret the results, start with a review of the
process, including the way that participants interacted and
reached decisions at each
7. step. Also review the substance of the exercise, including the
topic that participants selected, the elements and the
characteristics
identified, and the kind of information or knowledge used to
rate the elements. Summarize the main points on a flip chart.
Step 10 Review the column scores that describe the elements.
Look for obvious features such as whether the scores tend to be
in the middle or
closer to the poles. Also look for the elements that have similar
scores for most characteristics, including the key characteristic.
Summarize the characteristics they share and draw lines
connecting elements with similar column scores to show that
they are part of the
same cluster or family of elements.
Step 11 Review the row scores that describe the characteristics.
Look for obvious features such as scores that vary little and
others a lot, or
characteristics that are more meaningful compared to others.
Also look for matching characteristics. There is a match
between two or
more characteristics when row scores are similar or show an
inverse relationship to each other. Summarize the matches and
draw lines
connecting characteristics with similar (or inverse) row scores.
Characteristics that match the key characteristic (identified in
Step 3) can
8. help explain important aspects of the topic area.
Characteristics Conflict A Conflict B Conflict C Conflict D
Conflict E Conflict F
Rarely (1)
Often (5)
1 1 2 3 5 5
Legal (1)
Personal (5)
4 5 3 2 1 2
Interests (1)
Values (5)
1 3 2 4 5 4
122
Reconstructing models of reality
Domain AnalysisSAS
Dialogue
RETHINKING THE ANALYSIS
Step 12 Modify, delete or add to the list of elements,
characteristics, and scores at any time during the process.
Look for an extra characteristic and opposite if two elements
9. that are very similar need to be distinguished from each other
more
sharply. To do this, find a meaningful difference between the
two elements. Use this difference to create a new characteristic
and
its opposite and rate all the elements on this characteristic.
Look for an extra element if two characteristics that are closely
matched need to be distinguished from each other more sharply.
To do this, find a new element within the domain that brings
together the characteristics that are rarely matched. Insert the
new
element in a new column and rate it for each characteristic and
its opposite.
Step 13 Review and summarize key comments concerning the
domain or topic made during
the exercise. Then identify the learning opportunity (see
Learning Opportunities,
below) and develop a strategy to act on this understanding.
Be sure to review in detail the Scoring Tips. These are critical
to proper application of
Domain Analysis.
TIPS ON ELEMENTS
Supply or negotiate some or all the elements or elicit them
from the participants, depending on
10. the purpose of the exercise and the facilitator’s role.
The list of elements can include an ideal or a problematic
element that can be compared with other elements.
TIPS ON CHARACTERISTICS (CONSTRUCTS)
Supply or negotiate any characteristic and its opposite or elicit
them from the participants, depending on the purpose of the
exercise and the
facilitator’s role.
When using characteristics to describe the elements, do not
interpret the descriptions as statements of facts that are either
right or wrong.
Statements about elements should be accurate only in the sense
of truly reflecting people’s views and understanding of reality.
Characteristics should be relevant to the topic area, focused
and clear. They should usually consist of concrete nouns,
actions or verbs
ending in ‘–ing’ rather than abstract terms, qualities or ideas.
Characteristics and their opposites can include responses or
concrete actions related to each element (see Problem Domain).
!
!
123
11. Reconstructing models of reality
Domain AnalysisSAS
Dialogue
TIPS ON CHARACTERISTICS (CONSTRUCTS) continued
If the characteristics are vague or sound like clichés, use the
Laddering Down technique in Active Listening to make them
more meaningful and
detailed. Ask “What do we mean by this?”, “Can we give an
example of this?”, “How can we tell this?”, or “In what way is
this true?”.
Don’t use negative phrases, such as ‘not legal’ to describe the
opposite of or contrast with a characteristic such as ‘legal.’
Negative phrases tend to
be vague and meaningless. Opposites or contrasts phrased more
precisely will describe people’s views on a domain in a more
meaningful way.
If necessary, some of the characteristics may involve a single
pole or reference point against which all the elements are rated.
For example,
‘cost’, ‘importance’ , ‘priority’, ‘feasibility’ may go from low
to high (see Option Domain).
If participants cannot identify what it is that two elements have
in common or what makes the third element different from the
pair, ask in
12. another way, apply the Laddering Down technique (see Active
Listening), choose another three elements at random or choose
two cards instead
of three.
You can use other elicitation tools to identify characteristics
and their opposites, without comparing elements chosen at
random. A simple
procedure is the catchall question: ‘Can you think of some new,
different characteristic and its opposite?’ Another option is the
full context
procedure: review all elements and find two that have a
characteristic in common, and then the element that is the most
different from these and
in what way. Use this procedure to identify one or more
characteristic and its opposite. Another option is to use
description and storytelling to
explore the topic (for example, by describing examples of
success and failure), and then use this information to identify
the elements as well as
their characteristics organized into opposites.
To identify several characteristics and their opposites in less
time, divide all participants into groups of two or three. Ask
each group to choose
three elements at random and to identify a relevant
characteristic and its opposite. Collect these new characteristics
and their opposites, discuss
13. and clarify their meaning, and group together those that are the
same (see tips in Social Domain).
Don’t use a characteristic together with its opposite more than
once. However, a particular characteristic can be used more
than once if it is paired with
a different opposite characteristic (such as ‘legal’ as opposed to
‘personal’ in one case, and then ‘legal’ as opposed to ‘political’
in the other case).
Characteristics can be grouped together into appropriate
categories supplied by the facilitator or created and defined by
the participants (see Free List
and Pile Sort). They can also be ranked by order of importance.
This will help with interpretation of the table at the end of the
exercise.
TIPS ON RATING
If the characteristic and its opposite do not apply to an
element, don’t provide a score. If a characteristic does not apply
to many elements,
try rewording it or leave it out of the analysis.
If the scores for a characteristic and its opposite are nearly the
same across all elements, redefine the characteristic or leave it
out of the analysis.
124
Reconstructing models of reality
Domain AnalysisSAS
Dialogue
14. TIPS ON RATING continued
The rating of elements can be done without focusing
attention on the table. To do so, place a card representing
a characteristic and some distance apart another card
representing its opposite or contrast. Then take each
element card or an object representing the element and ask
participants to locate the element somewhere on the continuum
between the two characteristic cards. Convert this location into
a
rating, and track the scores separately in a table or directly in
RepGrid.
Repeat this exercise for each characteristic and its opposite.
TIPS ON INTERPRETING
When comparing elements, focus on those row characteristics
and
relationships that are more important or interesting. Don’t
assume that all
relationships are meaningful. This would be over-interpreting
the results.
As noted in Step 5, use the ratings for the key characteristic
(identified
15. in Step 3) to reorganize all element cards (row 1) and score
cards (row
2) from the lowest score to the highest. The reorganized table
will help
explain the key characteristic.
Group together similar elements by moving the columns around
and
placing them side by side (use masking tape to stick the column
cards
together). Do the same with matching characteristics, by moving
the
rows around and placing them one above the other.
Where you find high matches between row scores or sets of
characteristics and
their opposites, discuss whether one row set is an example or
the effect of the
other row set, or if it has the same meaning or the same cause as
the other set.
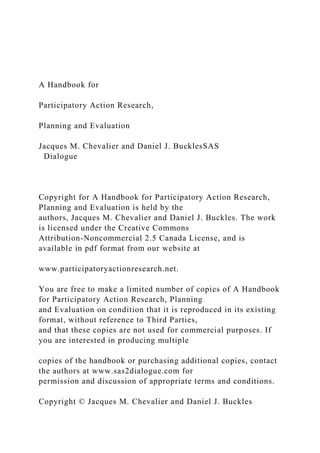
To focus on two characteristics and their opposites only, create
a diagram by drawing a vertical line that crosses a horizontal
line of equal
length. If your scale is from 1 to 5, write 1 and 5 at opposite
ends of both the horizontal line and the vertical line; indicate
what these minimum
and maximum scores mean. Write 3 where the two lines cross.
For each element, locate the score for one characteristic and its
16. opposite on the
horizontal line, and then the score for the other characteristic
and its opposite on the vertical line. Connect the scores from
the two lines, and
write the name of the element where they meet. The closer two
elements are in the diagram, the more similar they are.
x Conflict A
Values
x Conflicts D, F
Interests
Personal, Interests
Legal, Interests
Personal, Values
Legal, Values
Legal
Personal
x Conflict B
x Conflict C
x Conflict E
125
17. Reconstructing models of reality
Characteristic 1 2 3 4 5 Characteristic
Good organizer Good listenerJohn S.
Domain Analysis
1
51
5
3
SAS
Dialogue
TIPS ON INTERPRETING continued
To help people participate actively in the analysis, prepare and
distribute
copies of the element cards among the participants. Then ask
participants
to identify other elements with row scores that are identical or
very similar
to theirs. Give special attention to similarities in the key
characteristic and
other characteristics important to the domain. Groups formed
18. around
similar elements can then prepare and present a brief
description of what
the elements have in common. Following this, all participants
can discuss
the main differences observed between groups (see tips in
Social Domain).
TIPS ON THE MATHEMATICS
The software RepGrid (http://repgrid.com/) performs the
calculations
described below. The Focus command creates a cluster analysis.
Elements that have the most similar ratings are placed side by
side.
Characteristics that are closely matched also appear side by
side, with
inverse relationships converted into positive relationships. A
diagram with
lines outside the table meeting at various points indicates the
levels of
similarity between elements and between characteristics.
The PrinGrid command creates a graph with calculations based
on
principal component analysis. The graph is a two dimensional
19. representation of multidimensional relationships among
elements and
characteristics. Dots show the location of each element in
relation to all
other elements and to characteristics represented by straight
lines. The
shorter the characteristic line, the less the ratings for the
characteristic
vary. Closer relationships between elements (dots), between
characteristics
(lines), and between elements and characteristics are shown by
their
distance from each other. The main horizontal line (principal
component 1)
and vertical line (principal component 2) are summary variables
for these
multidimensional relationships. The percentages at the end of
each line
indicate the extent to which each component explains these
multidimensional relationships. (See examples.)
126
Reconstructing models of reality
100
20. 90
80
70
100 90 80 70
SRI
ALYSSE
CLAIRE
MELISSA W.
GENEVIEVE
DWAINE
MARTINE
ELAINE
EMILY W.
FRANCOISE
LUCIE
EUNICE
JOCELYNE
ANDREW
IMARA
KATE
SHANNON
EMILY K.
MELISSA
LOREDANA
NAVA
KARINE
WANGARI
YVES
One-to-one discussion Group discussio
Improvisation Planning
Facilitation Analytisis
People-oriented Task-oriented
23. GENEVIEVE Task-oriented
PRINCIPAL COMPONENT ANALYSIS
Domain AnalysisSAS
Dialogue
http://repgrid.com/
http://repgrid.com/
TIPS ON THE MATHEMATICS continued
To manually calculate the level of difference between two
column elements, calculate the sum of differences (SD) between
same-row scores
(leave out rows that have empty squares). Then calculate the
total maximum difference for all scores (this is MS, the
maximum score, minus 1,
multiplied by C, the number of row characteristics that got
ratings). The level of difference between two elements is SD
divided by the total
maximum difference for all scores multiplied by 100. To turn
this level of difference into a percentage similarity score,
subtract it from 100. In
other words: [100 - (SD x 100)] / [(MS-1) x C]. Using the table
created in Step 7 as an example, the sum of differences (SD)
between the recorded
scores for elements E and F is 2 and the total maximum
difference is 12, or [(5 - 1) x 3]. This results in a difference of
16.7% (2/12 x 100).
24. Looking at it another way, the two elements are similar at a
level of 83.3%.
To manually calculate the level of difference between two row
characteristics, calculate the sum of differences (SD) between
same-column
scores (leave out columns that have empty squares). Then
calculate the total maximum difference for all scores (this is
MS, the maximum
score, minus 1, multiplied by E, the number of elements that got
ratings). The level of difference between two characteristics is
SD divided by
the total maximum difference for all scores multiplied by 100.
To turn this level of difference into a percentage similarity
score, subtract it
from 100. In other words: [100 - (SD x 100)] / [(MS-1) x E.
Using the table created in Step
7 as an example, the sum of differences (SD) between the
recorded scores for the last
two rows is 14 and the total maximum difference is 24, or [(5 -
1) x 6]. This results in a
difference of 58.3% (14/24 x 100). Looking at it another way,
the two elements are
similar at a level of 41.7%.
If the level of similarity between two sets of row scores is very
low, this indicates an
25. inverse relationship. This means that if participants choose a
characteristic at one
end of the continuum in one row then they tend to choose the
characteristic at the
opposite end in the other row. When this happens, turn the
inverse relationship into a
positive one by reversing all the scores in one row (from 2 to 4
or from 5 to 1, in a
scale from 1 to 5, for instance). Positive relationships are easier
to interpret. For
instance, by reversing the scores for the last row in the table
already presented, the
level of similarity between the last two rows is 83.3%.
127
Reconstructing models of reality
Domain AnalysisSAS
Dialogue
91
LEARNING OPPORTUNITIES
Domain Analysis helps to identify learning opportunities based
on an understanding of multidimensional
26. relationships among elements and characteristics within the
domain or topic area. Opportunities may involve
structural learning, communicational learning, temporal
learning or adaptive learning. Understanding the nature
of the learning opportunity helps with development of an action
strategy.
STRUCTURAL LEARNING
Convergence
There is convergence in the system when the row scores in the
table are closely matched. In this case, most
characteristics can be regrouped into two categories that are
opposite each other, with the elements falling
somewhere along the continuum from one set of opposites to
another. If convergence in the system is limiting,
search for new elements that combine the characteristics in
novel ways. Give special attention to novel ways of
combining elements with the key characteristic identified in
Step 3 (see example in Activity Domain).
Polarization
There is polarization in the system when one group of elements
has one set of column scores and the other group of
elements is opposite in all respects. In this case, most elements
can be regrouped into two categories that are opposite
27. each other. If polarization in the system is limiting, search for
new elements that combine the characteristics in novel
ways. Give special attention to novel ways of combining
elements with the key characteristic identified in Step 3.
Dispersion
There is dispersion in the system when very few elements or
characteristics are closely matched. This indicates that each
element is
entirely different and there is no pattern in the system. If
dispersion in the system is limiting, search for other elements or
characteristics
that may be missing and needed to introduce some meaningful
pattern into the system (see example in Social Domain).
Vagueness
There is vagueness in the system when the scores for the
elements do not vary much. If this is limiting, search for the
likely cause. Some
possibilities are: participants have very different views of the
elements and negotiated the differences by assigning average
scores;
participants emphasize the connections and similarities between
the elements, not the differences; participants have limited
knowledge of
the domain or topic area; the elements chosen are too general.
28. !
!
128
Reconstructing models of reality
Domain AnalysisSAS
Dialogue
COMMUNICATIONAL LEARNING
Disagreement
There is disagreement when people give very different scores to
the same elements
using the same characteristics. To measure levels of agreement
and disagreement
between two tables or sets of scores, total the differences
between same-square
scores and divide this number by the total maximum difference
between all squares
(this is MS, the maximum score, minus 1, multiplied by E, the
number of elements
that got ratings). If disagreement is a limitation, identify the
key area(s) of
disagreement and the likely causes. Continue discussion of the
29. causes until the
scores reflect a common assessment of the situation.
To compare many characteristics and tables representing the
views of different individuals or groups, reorder the row
characteristics in each
table from top to bottom, with those at the top matching the
ratings of the key characteristic identified in Step 3. These key
matching
characteristics represent what each individual or group has in
mind when thinking about important aspects of the topic. Then,
look for key
matching characteristics that participants agree or disagree with
across the sample. If the tables contain many characteristics,
they can be
grouped into categories (see Tips on characteristics), reordered
from top to bottom within each category, and then assessed for
key match
agreements and disagreements across the sample within each
category. The software RepGrid will also compare tables that
contain some or all
the same elements and characteristics. Levels of agreement may
be combined with levels of understanding (below) to produce
the six possible
scenarios outlined in Disagreements and Misunderstandings.
Misunderstanding
30. There is misunderstanding when a party with a particular profile
(such as men) fails to predict how a party with a different
profile (such as
women) will rate certain elements. To measure levels of
misunderstanding, each party must try to guess how the other
party will rate the
same elements using the same characteristic(s). Then, total the
differences between the original scores and the scores each
group predicted
for the other. Divide this number by the total maximum
difference for all squares (this is the maximum score minus 1,
multiplied by the
number of elements). If misunderstanding is a limitation,
identify the key area(s) and the likely causes of
misunderstanding. Compare and
discuss the scores until a better understanding of each other’s
views is created. Levels of understanding may be combined with
levels of
agreement (above) to produce the six possible scenarios
outlined in Disagreements and Misunderstandings.
Confusion
There is confusion among people when the parties use different
elements or characteristics to describe the same domain or
topic. If confusion is
a limitation, search for common elements or shared
characteristics to create some basis for mutual understanding
and agreement.
31. !
!
129
Reconstructing models of reality
Domain AnalysisSAS
Dialogue
TEMPORAL LEARNING
Instability
There is instability in the analysis when the way people view a
domain or
topic and characterize its elements changes quickly or
frequently over
time, without any clear justification. If instability is limiting,
identify the
factors that may explain this. Look for elements or
characteristics that are
more meaningful, or take more time to discuss the ratings or to
gather
the information needed to complete the exercise.
Resistance to change
32. There is resistance to change when people become aware of
specific
learning opportunities described above yet prefer to leave the
views
expressed in their analysis unchanged. If resistance to change is
limiting,
identify the factors that may explain this or take more time to
discuss the
topic, the elements, and their characteristics. Note that elements
and
characteristics (which reflect how people think) are generally
more
difficult to change compared with element ratings (which reflect
what
people think about the elements and characteristics).
ADAPTIVE LEARNING
Failure to predict
There is a failure to predict when experience and real events do
not confirm
the characteristics and the ratings applied to the elements in the
analysis. To
assess the predictive value of the analysis, select key
characteristics and their
33. opposites, and then identify indicators that define the meaning
of each
number on your …
Nursing 440.
APA and References.
Complete your Week 4 required discussion prompts.
Discussion Prompt 1
Does equating status with authority cause confusion? Why or
why not?
Discussion Prompt 2
As a professional nurse, what are some ways in which you are
able to reach out to members of the community who do not have
access to healthcare reform?
1
RESEARCH IN PROFESSIONAL
AND PUBLIC LIFE1
THE PURPOSES AND APPLICATIONS OF ACTION
RESEARCH: WHO DOES ACTION RESEARCH, AND
WHY DO THEY DO IT?
Action research is a systematic approach to investigation that
enables
people to find effective solutions to problems they confront in
their
everyday lives. Unlike experimental or quantitative research
that looks
for generalizable explanations related to a small number of
variables,
action research seeks to engage the complex dynamics involved
34. in any
social context. It uses continuing cycles of investigation
designed to
reveal effective solutions to issues and problems experienced in
specific
situations and localized settings, providing the means by which
people in
schools, businesses, community agencies and organizations, and
health
and human services may increase the effectiveness and
efficiency of
their work. In doing so it also seeks to build a body of
knowledge that
enhances professional and community practices and works to
increase
the well-being of the people involved.
For many people, professional and service occupations—
teaching, social
work, health care, psychology, youth work, and so on—provide
appealing avenues of employment. These occupations have the
potential
to provide meaningful and fulfilling work that is intrinsically
rewarding.
Increasingly, however, people in these sectors find their work to
be more
demanding and less satisfying. They often struggle to balance
growing
demands on their time and energy as their workloads continue to
expand, and they are routinely confronted by problems rarely
encountered 20 or 30 years ago.
The pressures experienced in professional practice reflect
tensions in
35. contemporary society. The complex influences that impinge on
people’s
everyday social lives provide a fertile seedbed for a
proliferating host of
family, community, and institutional problems. Professional
practitioners and agency workers are increasingly held
accountable for
solutions to problems that have their roots in the deeply
complex
interaction between the experiences of people and the realities
of their
social lives: stress, unemployment, family breakdown,
alienation,
behavioral problems, violence, poverty, discrimination, conflict,
and so
forth.
Although adequately prepared to deal with the technical
requirements of
their daily work, practitioners often face recurrent crises
outside the
scope of their professional expertise. Teachers face children
disturbed by
conflict in their homes and communities, youth workers
encounter
resentful and alienated teenagers, health workers confront
people
apparently unconcerned about life-threatening lifestyles and
social
habits, and social and welfare workers are strained past their
capacity to
deal with the impossible caseloads spawned by increasing
poverty and
alienation.
There is an expectation in social life that trained professionals,
36. applying
scientifically derived expertise, will provide answers to the
proliferating
problems that confront people in their personal and public lives.
Community responses to crises that arise from drug abuse,
crime,
violence, school absenteeism, and so on invariably revolve
around the
use of a social worker, youth worker, counselor, or similar type
of
service provider whose task it is to eradicate the problem by
applying
some intervention at an individual or programmatic level. These
responses have failed to diminish growing social problems that
have
multiplied much faster than human and financial resources
available to
deal with them. Moreover, evidence suggests that centralized
policies
and programs generated by “experts” have limited success in
resolving
these problems. The billions of dollars invested in social
programs have
failed to stem the tide of alienation and disaffection that
characterize
many areas of social life in modern industrial nations.
If there are answers to these proliferating social problems, it is
likely that
centralized policies will need to be complemented by the
creative action
of those closest to their sources—the service professionals,
agency
37. workers, students, clients, communities, and families who face
the issues
on a daily basis. Centralized policies, programs, and services, I
suggest,
should allow practitioners to engage the human potential of all
people
who contribute to the complex dynamics of the contexts in
which they
work. Policies and programs should not dictate specific actions
and
procedures but instead should provide the resources to enable
effective
action appropriate to particular places. The daily work of
practitioners
often provides many opportunities for them to acquire valuable
insights
into people’s social worlds and to assist them in formulating
effective
solutions to problems that permeate their lives.
We therefore need to change our vision of service professionals
and
administrators from mechanic or technician to facilitator and
creative
investigator. This new vision rejects the mindless application of
standardized practices across all settings and contexts and
instead
advocates the use of contextually relevant procedures
formulated by
inquiring and resourceful practitioners. The pages that follow
describe
some of the ways professional and community workers can hone
their
investigative skills, engage in systematic approaches to inquiry,
and
formulate effective and sustainable solutions to the deep-rooted
38. problems that diminish the quality of professional life. This
volume
presents an approach to inquiry that seeks not only to enrich
professional
practice but also to enhance the lives of those involved.
As a young teacher, I had the rare experience of being
transferred
from the relative security of a suburban classroom to a primary
school in a remote desert region of Western Australia. My task
was
to provide education for the children of the Aboriginal people
who,
at this time, still lived as they had for millennia, moving
through the
land in small family groups, hunting for their food, and sleeping
in
leaf shelters. On my first day in class, I was confronted by a
wall of
silence that effectively prevented any possibility of teaching.
The
children refused to respond verbally to any of my queries or
comments, hanging their heads, averting their eyes, and
sometimes
responding so softly that I was unable to hear what they said. In
these
discomfiting circumstances, I was unable to work through any
of the
customary routines and activities that had constituted my
professional repertoire in the city. Lessons were abbreviated,
disjointed, and seemingly pointless, and my professional pride
took a
distinct jolt as an ineffective reading lesson followed an
39. inarticulate
math period, preceding the monotony of my singular voice
through
social studies.
The silence of the children in the classroom was in marked
contrast
to their happy chatter as we walked through the surrounding
bush
that afternoon, my failing spirits leading me to present an
impromptu
natural science “lesson.” In this and following lessons, the
children
taught me a great deal about the living bushland that was their
natural home—the small animals and birds that, though unseen
by
my city-bred eyes, were everywhere; the plants, fruits, roots,
and
berries that were edible; the places where water could be found
(precious commodity in this desert environment); and how to
survive
when the weather was very hot. My “teachers” were a mine of
information, and they revelled in the opportunities to
demonstrate to
me their knowledge about the environment and their skill in
being
able to move so easily in what I saw as a hostile setting.
I discovered that I was able to make use of this knowledge and
interest in the classroom, fashioning a range of learning
activities
related to literacy, mathematics, social science, and natural
science.
In small ways I was thus able to accommodate my approach to
teaching in this unique educational environment, but the
experience
40. endowed me with an understanding that the regular routines of
teaching were unsuited to my current circumstances. All the
taken-
for-granted assumptions of my professional life rang hollow as I
struggled to understand the nature of the problems that
confronted
me and to formulate appropriate educational experiences for
this
vibrant, independent, and sometimes fractious group of
students.
Texts, curricula, teaching materials, learning activities,
classroom
organization, speech, interactional styles, and all other facets of
classroom life became subjects of inquiry and investigation as I
sought to resolve the constant stream of issues and problems
that
emerged in this environment. To be an effective teacher, I
discovered
that it was necessary to modify and adapt my regular
professional
routines and practices to fit the lives of the children.
The legacy of that experience has remained with me. Although I
have long since left school classrooms behind, the lessons I
learned
there still pervade all my work. I engage all professional,
organizational, and community contexts with a deep sense of my
need to explore and understand the situation. An attitude of
inquiry
enables me to engage, examine, explore, formulate answers, and
devise responses to deal more effectively with each context I
engage—and the diverse experiences and perspectives of the
people
41. within it.
In these situations, I now cast myself as a research facilitator,
working with and supporting people to engage in systematic
investigation that leads to clarity and understanding for us all
and to
provide the basis for effective action. In many places in the
United
States, Canada, Australia, East Timor, and Singapore I use
techniques and procedures that can be fruitfully applied to the
day-
to-day work of people in schools, organizations, and community
settings. I am now a practitioner–researcher.2
As becomes evident in the following sections, action research is
not
merely a tool for applying a standardized set of procedures to
professional, organizational, or community life, nor a “job”
intended as
the provenance of trained researchers. Neither is it a superficial
set of
routines that legitimate any set of social or professional
practices. Far
from providing a set of fixed prescriptions to be applied in any
context,
action research provides a flexible and practical set of
procedures that
are systematic, cyclical, solutions oriented, and participatory,
providing
the means to devise sustainable improvements in practice that
enhance
the lives and well-being of all participants.