Download as PDF, PPTX


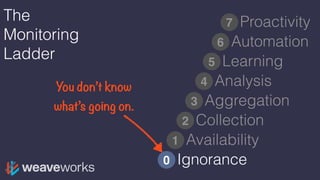


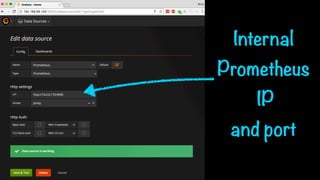

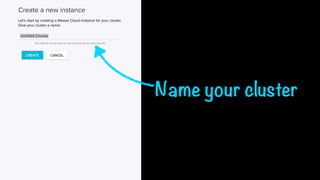


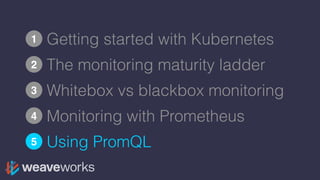


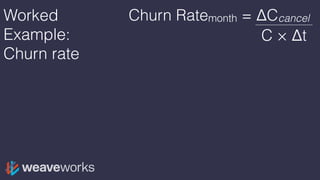
![Worked
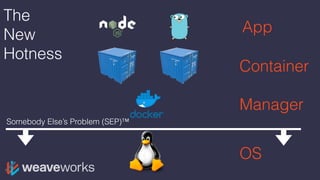
Example:
Churn rate
ΔCcancel = rate(total_cancels[1m])
Churn Ratemonth = ΔCcancel
C × Δt](https://image.slidesharecdn.com/monitoringkuberneteswithprometheus-170926145706/85/Monitoring-kubernetes-with-prometheus-150-320.jpg)
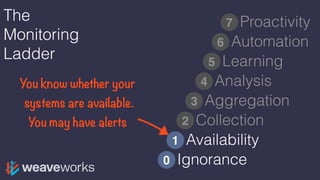
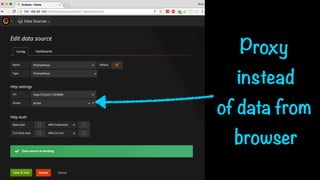
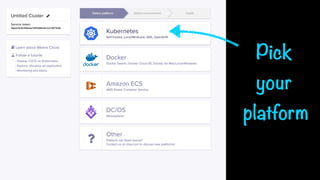
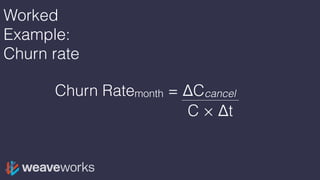
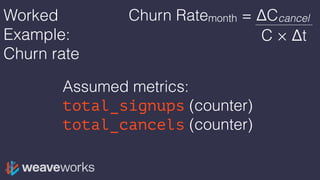
![Worked
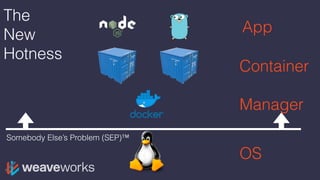
Example:
Churn rate
ΔCcancel = rate(total_cancels[1m])
Base metric
(scalar)
Churn Ratemonth = ΔCcancel
C × Δt](https://image.slidesharecdn.com/monitoringkuberneteswithprometheus-170926145706/85/Monitoring-kubernetes-with-prometheus-151-320.jpg)
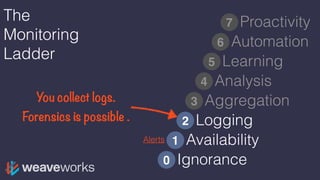
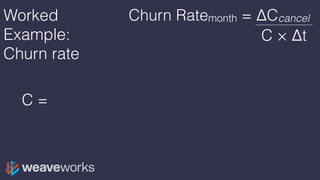
![Worked
Example:
Churn rate
ΔCcancel = rate(total_cancels[1m])
Base metric
(scalar)
Churn Ratemonth = ΔCcancel
C × Δt
t0, t1, t2, t3, t4, t5, t6](https://image.slidesharecdn.com/monitoringkuberneteswithprometheus-170926145706/85/Monitoring-kubernetes-with-prometheus-152-320.jpg)
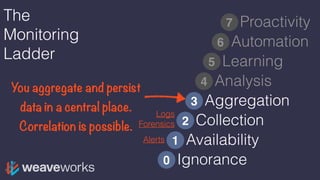
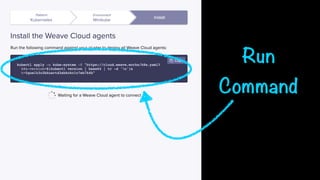
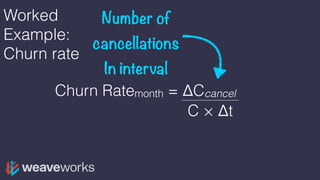
![Worked
Example:
Churn rate
ΔCcancel = rate(total_cancels[1m])
Base metric
(scalar) Data window
Churn Ratemonth = ΔCcancel
C × Δt](https://image.slidesharecdn.com/monitoringkuberneteswithprometheus-170926145706/85/Monitoring-kubernetes-with-prometheus-153-320.jpg)
![Worked
Example:
Churn rate
ΔCcancel = rate(total_cancels[1m])
Base metric
(scalar) Data window
Data range
(vector)
Churn Ratemonth = ΔCcancel
C × Δt](https://image.slidesharecdn.com/monitoringkuberneteswithprometheus-170926145706/85/Monitoring-kubernetes-with-prometheus-154-320.jpg)
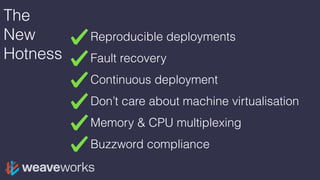
![Worked
Example:
Churn rate
ΔCcancel = rate(total_cancels[1m])
Base metric
(scalar) Data window
Data range
(vector)
Churn Ratemonth = ΔCcancel
C × Δt
t0, t1, t2, t3, t4, t5, t6
0
2
4
7
9
11
…
0
2
4
7
9
11
…
0
2
4
7
9
11
…
0
2
4
7
9
11
…
0
2
4
7
9
11
…
0
2
4
7
9
11
…
0
2
4
7
9
11
…](https://image.slidesharecdn.com/monitoringkuberneteswithprometheus-170926145706/85/Monitoring-kubernetes-with-prometheus-155-320.jpg)
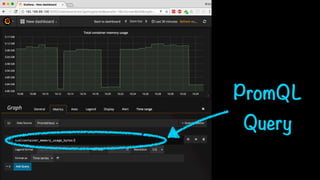
![Worked
Example:
Churn rate
ΔCcancel = rate(total_cancels[1m])
Base metric
(scalar) Data window
Data range
(vector)
Built-in rate function
Churn Ratemonth = ΔCcancel
C × Δt](https://image.slidesharecdn.com/monitoringkuberneteswithprometheus-170926145706/85/Monitoring-kubernetes-with-prometheus-156-320.jpg)
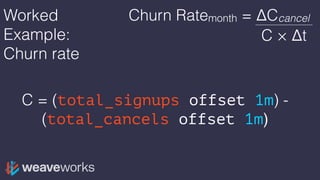
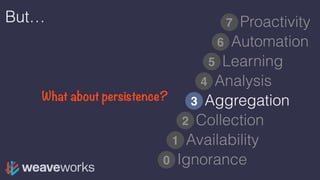
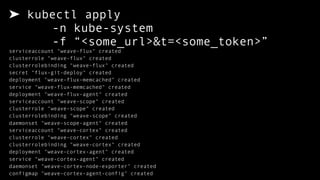
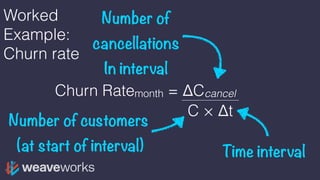
![Worked
Example:
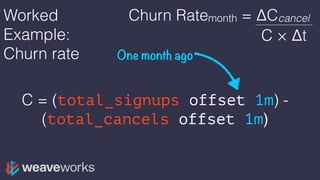
Churn rate
Churn Ratemonth =
rate(total_cancels[1m]) /
((total_signups offset 1m) - (total_cancels offset 1m))
Churn Ratemonth = ΔCcancel
C × Δt](https://image.slidesharecdn.com/monitoringkuberneteswithprometheus-170926145706/85/Monitoring-kubernetes-with-prometheus-160-320.jpg)
![Worked
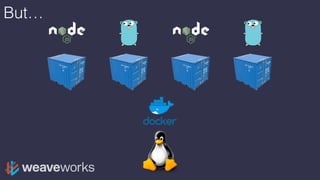
Example:
Churn rate
Churn Ratemonth =
rate(total_cancels[1m]) /
((total_signups offset 1m) - (total_cancels offset 1m))
Churn Ratemonth = ΔCcancel
C × Δt](https://image.slidesharecdn.com/monitoringkuberneteswithprometheus-170926145706/85/Monitoring-kubernetes-with-prometheus-161-320.jpg)
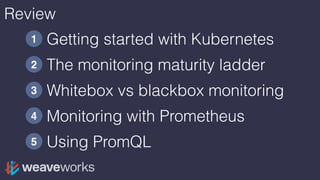


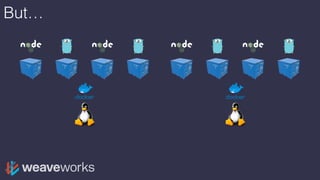
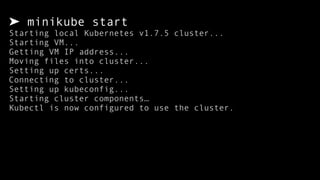
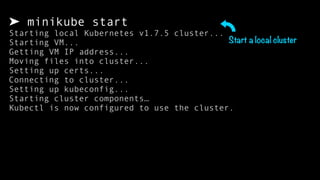
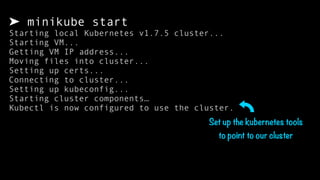
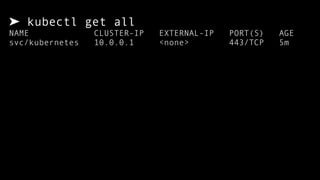
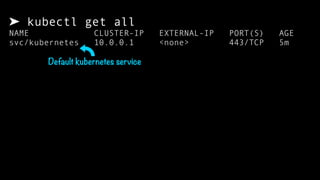
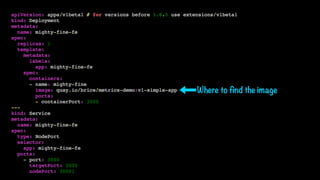
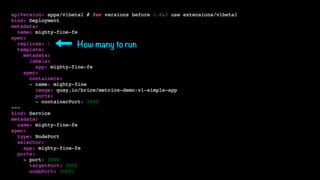
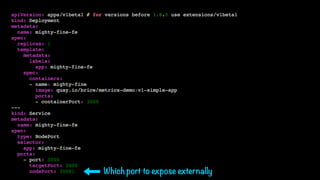
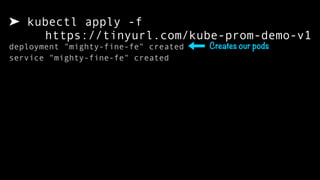
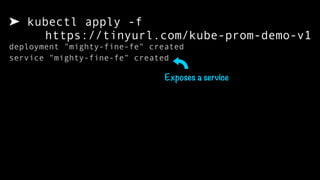
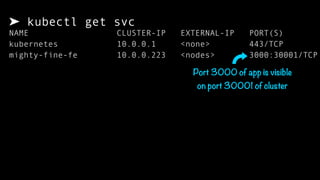
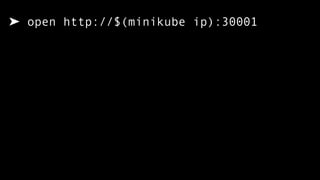
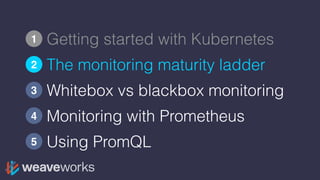
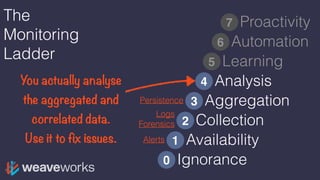
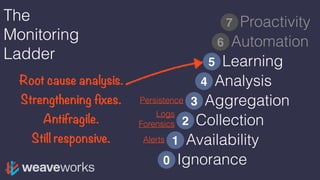
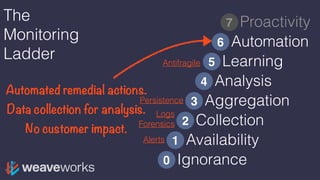
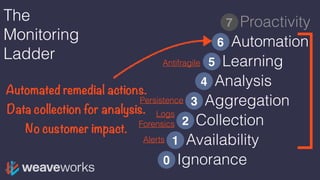
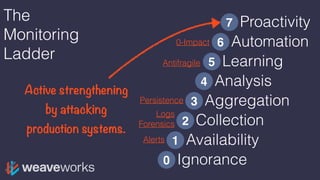
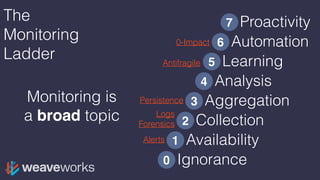
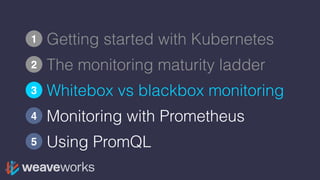
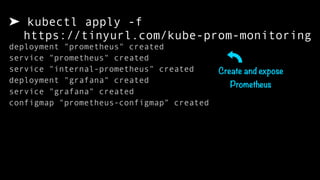
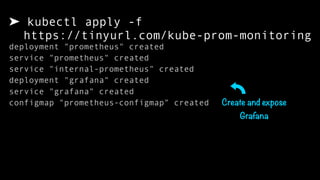
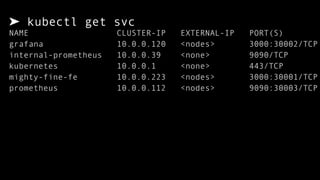
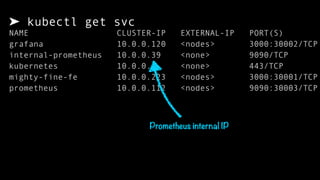
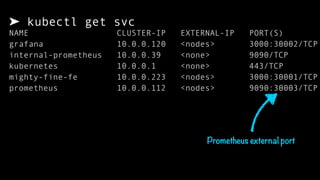
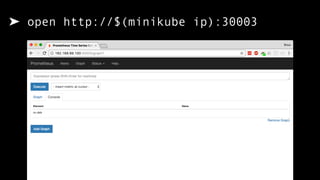
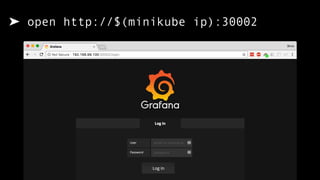
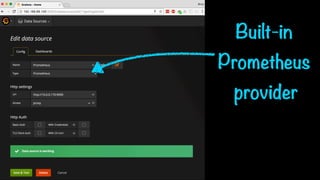
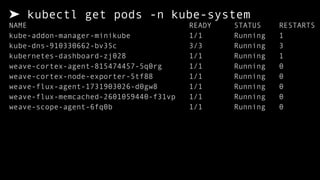
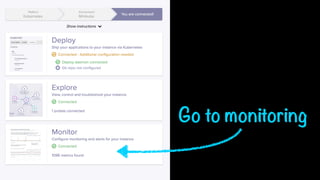
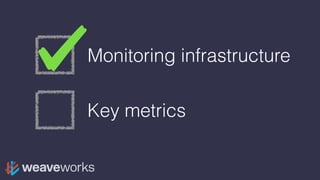
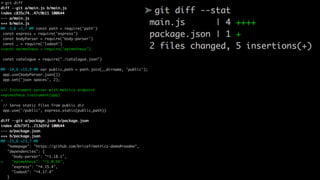
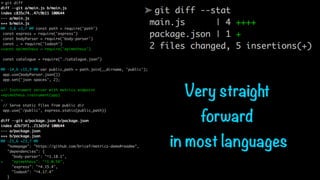
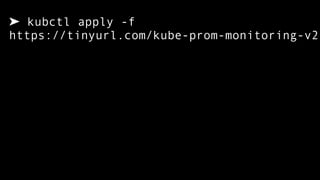
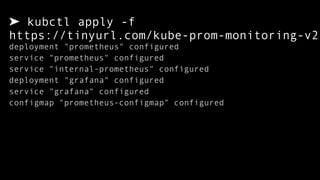
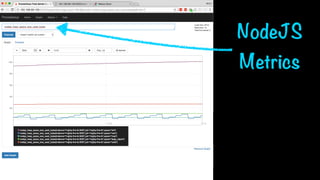
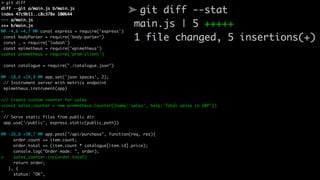
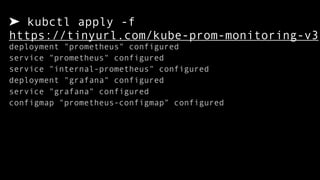
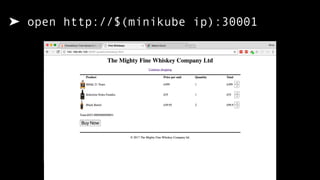
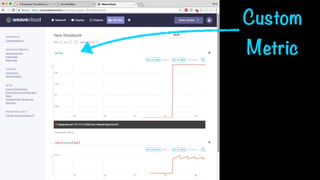
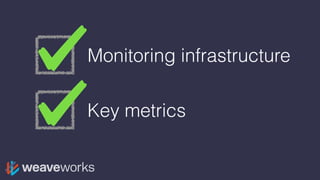
The document discusses monitoring microservices using Prometheus in Kubernetes, including setting up a local cluster with Minikube, deploying applications, and implementing monitoring tools. It covers the monitoring maturity model, types of monitoring (whitebox vs blackbox), and the importance of key metrics for continuous improvement. Additionally, it details practical steps for deploying Prometheus and Grafana for infrastructure monitoring, along with examples of using PromQL for metric queries.