VIP Call Girls LB Nagar ( Hyderabad ) Phone 8250192130 | ₹5k To 25k With Room...
dte_2Q05supplemental
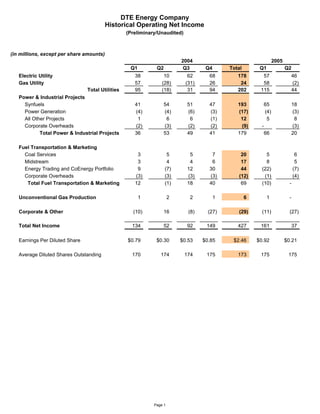
1. DTE Energy Company
Historical Operating Net Income
(Preliminary/Unaudited)
(in millions, except per share amounts)
2004 2005
Q1 Q2 Q3 Q4 Total Q1 Q2
Electric Utility 38 10 62 68 178 57 46
Gas Utility 57 (28) (31) 26 24 58 (2)
Total Utilities 95 (18) 31 94 202 115 44
Power & Industrial Projects
Synfuels 41 54 51 47 193 65 18
Power Generation (4) (4) (6) (3) (17) (4) (3)
All Other Projects 1 6 6 (1) 12 5 8
Corporate Overheads (2) (3) (2) (2) (9) - (3)
Total Power & Industrial Projects 36 53 49 41 179 66 20
Fuel Transportation & Marketing
Coal Services 3 5 5 7 20 5 6
Midstream 3 4 4 6 17 8 5
Energy Trading and CoEnergy Portfolio 9 (7) 12 30 44 (22) (7)
Corporate Overheads (3) (3) (3) (3) (12) (1) (4)
Total Fuel Transportation & Marketing 12 (1) 18 40 69 (10) -
Unconventional Gas Production 1 2 2 1 6 1 -
Corporate & Other (10) 16 (8) (27) (29) (11) (27)
Total Net Income 134 52 92 149 427 161 37
Earnings Per Diluted Share $0.79 $0.30 $0.53 $0.85 $2.46 $0.92 $0.21
Average Diluted Shares Outstanding 170 174 174 175 173 175 175
Page 1
2. DTE ENERGY COMPANY AND SUBSIDIARY COMPANIES
Earnings Variance Analysis (Preliminary/Unaudited)
Q2 2004 Reported Earnings per Share $0.20
Quarterly adjustment normalize the effective tax rate 0.08
Incremental non-recurring DTE2 project costs 0.02
Q2 2004 Operating Earnings per Share $0.30
Electric Utility
Rate Relief 0.13
Weather 0.11
Economy (0.03)
Electric Choice 0.03
Regulatory Deferrals (0.07)
Merger Interest 0.06
Benefits (0.05)
Other 0.02
Gas Utility
Rate Relief 0.04
Gas Margins 0.03
Merger Interest 0.03
Other 0.05
Non-Utility
Synfuel production 0.14
Mark-to-market loss on oil price hedges (0.10)
Q2 deferred synfuel variable note payment (0.26)
Power & Industrial projects (excl. synfuels) 0.03
Other -
Holding Company (merger interest, gain on Plug Power in 2004) (0.25)
$0.21
Q2 2005 Operating Earnings per Share
Quarterly adjustment normalize the effective tax rate (0.05)
Incremental non-recurring DTE2 project costs (0.03)
Mark to market adjustment on 2006 oil price options 0.06
Impact of disallowances from April 2005 MPSC gas order (0.02)
Discontinued operations - gain on sale of Southern Missouri Gas Company (0.01)
Discontinued operations - adjustment from the sale of Int'l Transmission Co. 0.01
Q2 2005 Reported Earnings per Share $0.17
2
3. DTE ENERGY COMPANY
CONSOLIDATED STATEMENT OF FINANCIAL POSITION (UNAUDITED)
(Unaudited)
December 31
June 30
2004
2005
(in Millions)
ASSETS
Current Assets
Cash and cash equivalents ..................................................................................... $ $ 56
86
Restricted cash ....................................................................................................... 126
107
Accounts receivable
Customer (less allowance for doubtful accounts of $138 and $129, respectively) 1,103 880
Accrued unbilled revenues................................................................................... 378
232
Other .................................................................................................................... 383
470
Inventories
Fuel and gas ......................................................................................................... 509
517
Materials and supplies ......................................................................................... 159
153
Assets from risk management and trading activities.............................................. 296
361
Other ...................................................................................................................... 209
237
2,996
3,266
Investments
Nuclear decommissioning trust funds.................................................................... 590
613
Other ...................................................................................................................... 558
563
1,148
1,176
Property
Property, plant and equipment ............................................................................... 18,011
18,118
Less accumulated depreciation and depletion ....................................................... (7,520 )
(7,619 )
10,491
10,499
Other Assets
Goodwill ................................................................................................................ 2,067
2,064
Regulatory assets .................................................................................................. 2,119
2,132
Securitized regulatory assets.................................................................................. 1,438
1,391
Notes receivable..................................................................................................... 529
488
Assets from risk management and trading activities.............................................. 125
328
Prepaid pension assets ........................................................................................... 184
185
Other ...................................................................................................................... 200
212
6,662
6,800
$ 21,297
Total Assets ............................................................................................................. $ 21,741
4. DTE ENERGY COMPANY
CONSOLIDATED STATEMENT OF FINANCIAL POSITION (UNAUDITED)
(Unaudited)
December 31
June 30
2004
2005
(in Millions, Except Shares)
LIABILITIES AND SHAREHOLDERS’ EQUITY
Current Liabilities
Accounts payable ............................................................................................. $ $ 892
979
Accrued interest................................................................................................ 111
117
Dividends payable ............................................................................................ 90
90
Accrued payroll ................................................................................................ 33
24
Income taxes..................................................................................................... 16
-
Short-term borrowings...................................................................................... 403
494
Gas inventory equalization ............................................................................... -
116
Current portion of long-term debt, including capital leases ............................. 514
885
Liabilities from risk management and trading activities................................... 369
460
Other................................................................................................................. 581
601
3,009
3,766
Other Liabilities
Deferred income taxes...................................................................................... 1,124
1,169
Regulatory liabilities ........................................................................................ 817
831
Asset retirement obligations ............................................................................. 916
943
Unamortized investment tax credit................................................................... 143
137
Liabilities from risk management and trading activities................................... 224
450
Liabilities from transportation and storage contracts ....................................... 387
368
Accrued pension liability.................................................................................. 265
313
Deferred gains from asset sales ........................................................................ 414
357
Minority interest ............................................................................................... 132
120
Nuclear decommissioning ................................................................................ 77
80
Other................................................................................................................. 635
774
5,134
5,542
Long-Term Debt (net of current portion)
Mortgage bonds, notes and other...................................................................... 5,673
5,122
Securitization bonds ......................................................................................... 1,400
1,345
Equity-linked securities .................................................................................... 178
172
Trust preferred-linked securities....................................................................... 289
289
Capital lease obligations................................................................................... 66
61
7,606
6,989
Commitments and Contingencies
Shareholders’ Equity
Common stock, without par value, 400,000,000 shares
authorized, 174,159,338 and 174,209,034 shares issued
and outstanding, respectively ......................................................................... 3,323
3,307
Retained earnings ............................................................................................. 2,383
2,355
Accumulated other comprehensive loss ........................................................... (158 )
(218 )
5,548
5,444
$ 21,297
Total Liabilities and Shareholders’ Equity ..................................................... $ 21,741
5. DTE ENERGY COMPANY
CONSOLIDATED STATEMENT OF CASH FLOWS (UNAUDITED)
Six Months Ended
June 30
2004
2005
(in Millions)
Operating Activities
Net Income ..................................................................................................... $ 225
$ 151
Adjustments to reconcile net income to net cash from operating activities:
Depreciation, depletion and amortization .................................................. 346
424
Deferred income taxes ............................................................................... 112
65
Gain on sale of interests in synfuel projects .............................................. (106 )
(100 )
Loss (gain) on sale of assets, net................................................................ (24 )
3
Partners’ share of synfuel project losses.................................................... (87 )
(149 )
Contributions from synfuel partners .......................................................... 36
113
Changes in assets and liabilities, exclusive of changes
shown separately .................................................................................... 17
172
Net cash from operating activities .................................................................. 519
679
Investing Activities
Plant and equipment expenditures – utility..................................................... (363 )
(372 )
Plant and equipment expenditures – non-utility ............................................. (33 )
(58 )
Proceeds from sale of interests in synfuel projects......................................... 88
145
Proceeds from sale of other assets .................................................................. 59
18
Restricted cash for debt redemptions.............................................................. 10
19
Other investments........................................................................................... (74 )
(56 )
Net cash used for investing activities ............................................................. (313 )
(304 )
Financing Activities
Issuance of long-term debt ............................................................................. 418
395
Redemption of long-term debt........................................................................ (565 )
(639 )
Short-term borrowings, net ............................................................................. 120
91
Issuance of common stock.............................................................................. 21
-
Repurchase of common stock......................................................................... -
(11 )
Dividends on common stock .......................................................................... (176 )
(179 )
Other............................................................................................................... (3 )
(2 )
Net cash used for financing activities ............................................................. (185 )
(345 )
21
Net Increase in Cash and Cash Equivalents................................................. 30
54
Cash and Cash Equivalents at Beginning of the Period............................... 56
$ 75
Cash and Cash Equivalents at End of the Period ......................................... $ 86
6. THE DETROIT EDISON COMPANY
CONSOLIDATED STATEMENT OF OPERATIONS (UNAUDITED)
Three Months Ended Six Months Ended
June 30 June 30
(in Millions) 2004 2004
2005 2005
$ 835 $ 1,721
Operating Revenues .................................................................$ 1,035 $ 2,025
Operating Expenses
Fuel and purchased power ....................................................... 200 416
343 644
Operation and maintenance ..................................................... 359 702
330 651
Depreciation and amortization ................................................ 122 236
160 310
Taxes other than income.......................................................... 62 130
63 132
743 1,484
896 1,737
92 237
Operating Income .................................................................... 139 288
Other (Income) and Deductions
Interest expense ....................................................................... 71 143
69 133
Interest income ........................................................................ - -
- (1 )
Other income ........................................................................... (15 ) (30 )
(18 ) (30 )
Other expenses ........................................................................ 23 45
24 42
79 158
75 144
13 79
Income Before Income Taxes .................................................. 64 144
5 27
Income Tax Provision .............................................................. 21 46
8 52
Reported Earnings ................................................................... 43 98
Adjustments
Stranded Cost adjustment ........................................................ - (7 )
- -
Incremental non-recurring DTE2 project costs ....................... 2 4
3 5
Effective tax rate normalization .............................................. - (1 )
- -
$ 10 $ 48
Operating Earnings .................................................................$ 46 $ 103
The Consolidated Statement of Operations (Unaudited) should be read in conjunction with the Notes to
Consolidated Financial Statements appearing in the Annual Report to Shareholders, Form 10K and 10Q.
7. MICHIGAN CONSOLIDATED GAS COMPANY
CONSOLIDATED STATEMENT OF OPERATIONS (UNAUDITED)
Three Months Ended Six Months Ended
June 30 June 30
(in Millions) 2004 2004
2005 2005
$ 271 $ 986
Operating Revenues ..................................................... $ 261 $ 1,095
Operating Expenses
Cost of gas................................................................... 161 649
131 758
Operation and maintenance ......................................... 108 205
96 215
Depreciation, depletion and amortization.................... 26 53
24 50
Taxes other than income.............................................. 13 25
13 26
Asset (gains) and losses, net........................................ - (2)
- 48
308 930
264 1,097
Operating Income (Loss) ............................................ (37) 56
(3) (2)
Other (Income) and Deductions
Interest expense ........................................................... 13 27
13 28
Interest income ............................................................ (3) (5)
(3) (5)
Other............................................................................ - (1)
- -
10 23
10 23
(47) 33
Income (Loss) Before Income Taxes ........................... (13) (25)
(10) -
Income Tax Provision (Benefit)................................... 37 38
(37) 33
Reported Earnings ....................................................... (50) (63)
Adjustments
Incremental non-recurring DTE2 project costs ........... 1 3
2 2
April 2005 MPSC gas orders........................................ - -
4 65
Effective tax rate normalization ................................... 9 (7)
43 51
$ (27) $ 29
Operating Earnings...................................................... $ (1) $ 55
Consolidated Statement of Operations (Unaudited) should be read in conjunction with the Notes to
Consolidated Financial Statements appearing in the Annual Report to Shareholders, Form 10K and 10Q.
8. DTE Energy Debt/Equity Calculation
As of June 30, 2005
($ millions)
short-term borrowings $ 494
current portion LTD & cap leases 885
long-term debt 5,122
securitization bonds 1,345
capital leases 61
less MichCon short-term debt -
less securitization debt, including current portion (1,446)
Total debt $ 6,461
Trust preferred $ 289
Mandatory convertible 172
Total preferred/ other $ 461
Equity $ 5,444
Total capitalization $ 12,366
Debt 52.3%
Preferred stock 3.7%
Common shareholders' equity 44.0%
Total 100.0%
8
9. Sales Analysis - Q2 2005
Electric Sales - Detroit Edison Service Area (GWh) Electric Revenue - Detroit Edison Service Area ($ 000s)
Q2 2005 Q2 2004 Q2 2005 Q2 2004
% Change % Change
Residential 3,766 3,472 8% Residential 338,297 309,485 9%
Commercial 3,820 3,049 25% Commercial 326,309 257,378 27%
Industrial 3,024 2,810 8% Industrial 166,384 135,628 23%
Other 646 656 -2% Other 30,730 30,531 1%
11,256 9,987 13% 861,720 733,022 18%
Interconnection Interconnection
1,142* 1,026 11% 76,490 39,614 93%
Choice** Choice*
1,996 2,480 -20% 39,180 46,937 -17%
TOTAL SALES 14,393 13,493 7% TOTAL REVENUES 977,390 819,573 19%
* Estimated due to MISO startup * Distribution charge, includes Dearborn Industrial Group revenues
** Includes Dearborn Industrial Group sales
Gas Sales - MichCon Service Area (Mcf) Gas Revenue - MichCon Service Area ($000s)
Q2 2005 Q2 2004 Q2 2005 Q2 2004
% Change % Change
Residential 16,509,131 17,721,665 -7% Residential 185,175 146,783 26%
Commercial 5,017,774 5,666,174 -11% Commercial 54,235 44,812 21%
Industrial 306,601 (947,171) n/m Industrial 3,082 (6,674) n/m
21,833,506 22,440,668 -3% 242,492 184,921 31%
End User End User
Transportation* Transportation*
32,628,790 29,160,337 12% 27,861 25,136 11%
TOTAL SALES 54,462,296 51,601,005 6% TOTAL REVENUES 270,353 210,057 29%
* Includes choice customers * Includes choice customers
Weather
Cooling Degree Days Heating Degree Days
Detroit Edison service area MichCon service area
Q2 2005 Q2 2004 Q2 2005 Q2 2004
% Change % Change
Actuals 301 171 76% Actuals 757 766 -1%
Normal 193 193 Normal* 860 888
56% -11% -12% -14%
Deviation from normal Deviation from normal
* 2005 data based on 30-year average, 2004 data based on 10-year average
9