1. Net Income Summary
(Preliminary/Unaudited)
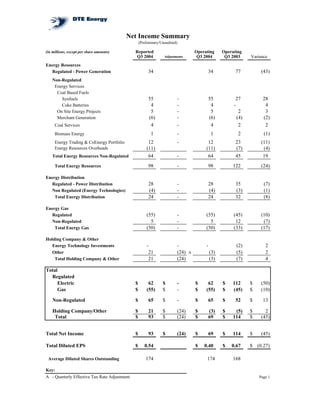
Reported Operating Operating
(in millions, except per share amounts)
Q3 2004 Q3 2004 Q3 2003 Variance
Adjustments
Energy Resources
34 34 77 (43)
Regulated - Power Generation
Non-Regulated
Energy Services
Coal Based Fuels
55 - 55 27 28
Synfuels
4 - 4 - 4
Coke Batteries
5 - 5 2 3
On Site Energy Projects
(6) - (6) (4) (2)
Merchant Generation
4 - 4 2 2
Coal Services
1 - 1 2 (1)
Biomass Energy
12 - 12 23 (11)
Energy Trading & CoEnergy Portfolio
(11) (11) (7) (4)
Energy Resources Overheads
64 - 64 45 19
Total Energy Resources Non-Regulated
98 - 98 122 (24)
Total Energy Resources
Energy Distribution
28 - 28 35 (7)
Regulated - Power Distribution
(4) - (4) (3) (1)
Non Regulated (Energy Technologies)
24 - 24 32 (8)
Total Energy Distribution
Energy Gas
(55) - (55) (45) (10)
Regulated
5 - 5 12 (7)
Non-Regulated
(50) - (50) (33) (17)
Total Energy Gas
Holding Company & Other
- - - (2) 2
Energy Technology Investments
21 (24) (3) (5) 2
Other A
21 (24) (3) (7) 4
Total Holding Company & Other
Total
Regulated
Electric $ 62 $ - $ 62 $ 112 $ (50)
Gas $ (55) $ - $ (55) $ (45) $ (10)
Non-Regulated $ 65 $ - $ 65 $ 52 $ 13
Holding Company/Other $ 21 $ (24) $ (3) $ (5) $ 2
Total $ 93 $ (24) $ 69 $ 114 $ (45)
Total Net Income $ 93 $ (24) $ 69 $ 114 $ (45)
Total Diluted EPS $ 0.54 $ 0.40 $ 0.67 $ (0.27)
174 174 168
Average Diluted Shares Outstanding
Key:
A - Quarterly Effective Tax Rate Adjustment Page 1
2. DTE ENERGY COMPANY AND SUBSIDIARY COMPANIES
Earnings Variance Analysis (Preliminary/Unaudited)
Q3 2003 Reported Earnings per Share $1.04
0.10
Adjust for non-recurring direct costs of blackout
(0.49)
Adjust for Q3 2003 Quarterly Effective Tax Rate Adjustment
Adjust for discontinued operations 0.02
Q3 2003 Operating Earnings per Share $0.67
Regulated Electric
Regulatory Assets 0.03
Weather (0.11)
Choice Lost Margin (0.14)
Net Interim Rate Relief Impact 0.06
Pension/Health Care (0.06)
Generation O&M & DTE2 (0.07)
Regulated Gas
Margin 0.01
Other 0.01
Taxes (0.07)
Non-Regulated
Synfuels 0.16
Coke Batteries 0.02
Trading & CoEnergy Portfolio (0.06)
Non-Regulated Gas (0.04)
Other (0.01)
Holding Company & Share Dilution -
$0.40
Q3 2004 Operating Earnings per Share
Effective tax rate adjustment 0.14
Q3 2004 Reported Earnings per Share $0.54
Page 2
3. DTE ENERGY COMPANY
CONSOLIDATED STATEMENT OF FINANCIAL POSITION
(Unaudited)
December 31
September 30
2003
2004
(in Millions)
ASSETS
Current Assets
Cash and cash equivalents ..................................................................................... $ $ 54
74
Restricted cash ...................................................................................................... 131
76
Accounts receivable
Customer (less allowance for doubtful accounts of $130 and $99,
respectively)....................................................................................................... 877
868
Accrued unbilled revenues................................................................................... 316
174
Other .................................................................................................................... 338
431
Inventories
Fuel and gas ......................................................................................................... 467
568
Materials and supplies ......................................................................................... 162
159
Assets from risk management and trading activities.............................................. 186
307
Other ...................................................................................................................... 181
247
2,712
2,904
Investments
Nuclear decommissioning trust funds.................................................................... 518
557
Other ...................................................................................................................... 601
565
1,119
1,122
Property
Property, plant and equipment ............................................................................... 17,679
18,101
Less accumulated depreciation and depletion ....................................................... (7,355 )
(7,699 )
10,324
10,402
Other Assets
Goodwill ................................................................................................................ 2,067
2,064
Regulatory assets .................................................................................................. 2,063
2,132
Securitized regulatory assets.................................................................................. 1,527
1,462
Notes receivable..................................................................................................... 469
527
Assets from risk management and trading activities.............................................. 88
205
Prepaid pension assets ........................................................................................... 181
183
Other ...................................................................................................................... 203
193
6,598
6,766
$ 20,753
Total Assets ............................................................................................................. $ 21,194
3
4. DTE ENERGY COMPANY
CONSOLIDATED STATEMENT OF FINANCIAL POSITION
(Unaudited)
December 31
September 30
2003
2004
(in Millions, Except Shares)
LIABILITIES AND SHAREHOLDERS’ EQUITY
Current Liabilities
Accounts payable.............................................................................................. $ $ 625
691
Accrued interest................................................................................................ 110
111
Dividends payable ............................................................................................ 87
90
Accrued payroll ................................................................................................ 51
40
Income taxes..................................................................................................... 185
11
Short-term borrowings...................................................................................... 370
476
Current portion of long-term debt, including capital leases ............................. 477
516
Liabilities from risk management and trading activities................................... 326
454
Other................................................................................................................. 593
584
2,824
2,973
Other Liabilities
Deferred income taxes ...................................................................................... 988
1,071
Regulatory liabilities ........................................................................................ 817
812
Asset retirement obligations ............................................................................ 866
903
Unamortized investment tax credit................................................................... 156
147
Liabilities from risk management and trading activities................................... 173
357
Liabilities from transportation and storage contracts ....................................... 495
397
Accrued pension liability.................................................................................. 345
237
Deferred gains from asset sales ........................................................................ 311
398
Minority interest ............................................................................................... 156
115
Nuclear decommissioning ................................................................................ 67
72
Other................................................................................................................. 599
605
4,973
5,114
Long-Term Debt (net of current portion)
Mortgage bonds, notes and other...................................................................... 5,624
5,689
Securitization bonds ......................................................................................... 1,496
1,400
Equity-linked securities .................................................................................... 185
179
Trust preferred-linked securities....................................................................... 289
289
Capital lease obligations................................................................................... 75
70
7,669
7,627
Contingencies
Shareholders’ Equity
Common stock, without par value, 400,000,000 shares
authorized, 173,958,093 and 168,606,522 shares issued
and outstanding, respectively ......................................................................... 3,109
3,312
Retained earnings ............................................................................................. 2,308
2,360
Accumulated other comprehensive loss ........................................................... (130 )
(192 )
5,287
5,480
$ 20,753
Total Liabilities and Shareholders’ Equity ..................................................... $ 21,194
4
5. DTE ENERGY COMPANY
CONSOLIDATED STATEMENT OF CASH FLOWS (UNAUDITED)
Nine Months Ended
September 30
2003
2004
(in Millions)
Operating Activities
Net Income ..................................................................................................... $ 292
$ 318
Adjustments to reconcile net income to net cash from operating activities:
Depreciation, depletion and amortization .................................................. 551
536
Deferred income taxes ............................................................................... (55 )
104
Gain on sale of interests in synfuel projects .............................................. (57 )
(166 )
Gain on sale of ITC and other assets, net................................................... (130 )
(27 )
Partners’ share of synfuel project losses.................................................... (58 )
(158 )
Contributions from synfuel partners .......................................................... 44
71
Cumulative effect of accounting changes .................................................. 27
-
Changes in assets and liabilities, exclusive of changes
shown separately ................................................................................... (328 )
(88 )
Net cash from operating activities .................................................................. 286
590
Investing Activities
Plant and equipment expenditures – regulated ............................................... (504 )
(555 )
Plant and equipment expenditures – non-regulated ........................................ (58 )
(52 )
Investment in joint ventures ........................................................................... (5 )
(36 )
Proceeds from sale of interests in synfuel projects......................................... 67
151
Proceeds from sale of ITC and other assets.................................................... 643
62
Restricted cash for debt redemptions.............................................................. 137
55
Other investments........................................................................................... (61 )
(59 )
Net cash from (used for) investing activities .................................................. 219
(434 )
Financing Activities
Issuance of long-term debt ............................................................................. 529
617
Redemption of long-term debt........................................................................ (897 )
(620 )
Short-term borrowings, net ............................................................................. 55
106
Issuance of common stock.............................................................................. 33
31
Dividends on common stock .......................................................................... (259 )
(265 )
Other............................................................................................................... (9 )
(5 )
Net cash used for financing activities ............................................................. (548 )
(136 )
(43 )
Net Increase (Decrease) in Cash and Cash Equivalents............................... 20
133
Cash and Cash Equivalents at Beginning of the Period............................... 54
$ 90
Cash and Cash Equivalents at End of the Period ......................................... $ 74
5
6. THE DETROIT EDISON COMPANY
CONSOLIDATED STATEMENT OF OPERATIONS (UNAUDITED)
Three Months Ended Nine Months Ended
September 30 September 30
(in Millions) 2003 2003
2004 2004
$ 1,017 $ 2,824
Operating Revenues ........................................................................... $ 958 $ 2,679
Operating Expenses
Fuel and purchased power ................................................................. 288 762
238 654
Operation and maintenance ............................................................... 316 1,025
361 1,063
Depreciation and amortization........................................................... 127 386
128 364
Taxes other than income.................................................................... 67 204
62 192
798 2,377
789 2,273
219 447
Operating Income .............................................................................. 169 406
Other (Income) and Deductions
Interest expense ................................................................................. 71 217
72 215
Other income ..................................................................................... (29 ) (62 )
(13 ) (43 )
Other expenses .................................................................................. 30 67
16 61
72 222
75 233
147 225
Income Before Income Taxes............................................................. 94 173
51 78
Income Tax Provision ........................................................................ 32 59
96 147
Income Before Accounting Change................................................... 62 114
- (6 )
Cumulative Effect of Accounting Change ........................................ - -
96 141
Net Income ......................................................................................... 62 114
Cumulative Effect of Accounting Changes
Asset Retirement Obligations (FAS 143)………………………….. - 6
- -
Unusual Items
August 2003 Blackout Costs………………………………………. 16 16
- -
Loss on Sale of Steam Heating Business…………………………... - 14
- -
Operating Earnings…………………………………………………. 112 177
62 114
Regulatory Deferrals Impact:
Regulatory Deferrals (Net of Income Taxes)(1)...………………….. 18 48
23 65
Operating Earnings Excluding Regulatory Deferrals……………. $ 94 129
39 $ $ 49 $
Return on Average Common Equity (2)
Operating Earnings Including Regulatory Deferrals…………… 10.1 %
- - 7.4 %
Operating Earnings Excluding Regulatory Deferrals…………... 7.5 %
- - 3.8 %
The Consolidated Statement of Operations (Unaudited) should be
read in conjunction with the Notes to Consolidated Financial
Statements appearing in the Annual Report to Shareholders, Form
10K and Form 10Q
(1) Regulatory deferrals recorded pursuant to Michigan electric
restructuring legislation and related Michigan Public Service
Commission Orders. The deferrals include Electric Choice lost
margin recovery, Electric Choice implementation costs,
environmental compliance costs and other.
(2) Reflects reported earnings for the 12-month period ending
September 30 and a 13-month average common equity.
6
7. MICHIGAN CONSOLIDATED GAS COMPANY
CONSOLIDATED STATEMENT OF OPERATIONS (UNAUDITED)
Three Months Ended Nine Months Ended
September 30 September 30
(in Millions) 2003 2003
2004 2004
$ 142 $ 1,078
Operating Revenues ..................................................... $ 155 $ 1,141
Operating Expenses
Cost of gas................................................................... 56 637
64 713
Operation and maintenance ......................................... 90 251
90 293
Depreciation, depletion and amortization.................... 26 79
28 81
Taxes other than income.............................................. 12 42
12 37
Property write-down ................................................... - 5
- -
184 1,014
194 1,124
Operating Income (Loss) ............................................ (42) 64
(39) 17
Other (Income) and Deductions
Interest expense ........................................................... 13 42
14 41
Interest income ............................................................ (2) (8)
(2) (7)
Other............................................................................ (2) (4)
- 1
9 30
12 35
(51) 34
Income (Loss) Before Income Taxes ........................... (51) (18)
Income Tax Provision (Benefit) ..................................... (14) 7
2 2
$ (37) $ 27
Reported Earnings (Loss) ............................................ $ (53) $ (20)
Purchase Accounting and Other Adjustments……… (5) (5)
(1) (2)
Disallowance of Gas Costs……………………………. - (17)
- -
Operating Earnings(A)……………………………….. (42) $ 5
$ (54) $ $ (22)
The Consolidated Statement of Operations (Unaudited)
should be read in conjunction with the Notes to
Consolidated Financial Statements appearing in the
Annual Report to Shareholders, Form 10K and Form 10Q
(A) Represents MichCon’s results included in the DTE
Energy Consolidated Statement of Operations
7
8. DTE Energy Debt/Equity Calculation
As of September 30, 2004
($ millions)
short-term borrowings 476
current portion LTD + cap leases 516
long-term debt 5,689
securitization bonds 1,400
capital leases 70
less QUIDS (385)
less MichCon short-term debt (209)
less securitization debt, including current portion (1,496)
Total debt 6,061
Trust preferred 289
QUIDS 385
Mandatory convertible 179
Total preferred/ other 853
Equity 5,480
Total capitalization 12,394
Debt 48.9%
Preferred stock 6.9%
Common shareholders' equity 44.2%
Total 100.0%
Page 8
9. Sales Analysis
Electric Sales - Detroit Edison Service Area (000's of GWh) Electric Revenue - Detroit Edison Service Area ($000s)
Q3 2004 Q3 2003 % Change Q3 2004 Q3 2003 % Change
Residential 4,113,927 4,456,931 -7.7% Residential 369,059 404,888 -8.8%
Commercial 3,557,384 4,162,910 -14.5% Commercial 294,301 338,121 -13.0%
Industrial 2,854,400 3,044,498 -6.2% Industrial 137,412 158,683 -13.4%
Other 628,397 653,532 -3.8% Other 29,209 29,634 -1.4%
TOTAL SYSTEM 11,154,108 12,317,871 -9.4% TOTAL SYSTEM 829,981 931,326 -10.9%
Interconnection Sales Interconnection Sales
1,442,501 1,046,630 37.8% 58,090 45,384 28.0%
Choice Sales (Distribution Choice Sales (Distribution
2,654,802 2,141,011 24.0% 50,506 9,476 433.0% **
Charge)* Charge)*
TOTAL SALES 15,251,411 15,505,512 -1.6% TOTAL SALES 938,577 986,186 -4.8%
* Includes Dearborn Industrial Group sales * Includes Dearborn Industrial Group sales
** Reflects impact of interim rate order eliminating Choice transition credit & implementing transition charge
Gas Sales - MichCon Service Area (Mcf) Gas Revenue - MichCon Service Area (Mcf)
Q3 2004 Q3 2003 % Change Q3 2004 Q3 2003 % Change
Residential 9,180,323 9,150,523 0.3% Residential 96,521,908 86,566,132 11.5%
Commercial 2,695,926 3,093,001 -12.8% Commercial 26,379,204 26,021,106 1.4%
Industrial 188,258 314,234 -40.1% Industrial 1,651,688 2,298,651 -28.1%
12,064,507 12,557,758 -3.9% 124,552,800 114,885,889 8.4%
End User Transportation* End User Transportation*
27,441,684 26,696,816 2.8% 20,818,581 18,914,849 10.1%
TOTAL SALES 39,506,191 39,254,574 0.6% TOTAL SALES 145,371,381 133,800,738 8.6%
* includes choice customers * includes choice customers
Weather
Cooling Degree Days Heating Degree Days
Detroit Edison service territory MichCon service territory
Q3 2004 Q3 2003 % Change Q3 2004 Q3 2003 % Change
Actuals 470 548 -14% Actuals 134 165 -19%
Normal 537 537 n/m Normal* 147 189 -22%
Deviation from normal -12.5% 2.0% Deviation from normal -8.8% -12.7%
* 2004 data based on 10-year average, 2003 data based on 30 year average
Page 9