
Recommended
More Related Content
What's hot
What's hot (14)
Viewers also liked
Viewers also liked (19)
Similar to wesco international Non-Gap%202Q08
Similar to wesco international Non-Gap%202Q08 (20)
More from finance34
More from finance34 (20)
Recently uploaded
Recently uploaded (20)
wesco international Non-Gap%202Q08
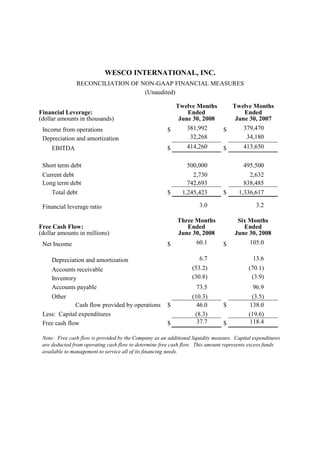
- 1. WESCO INTERNATIONAL, INC. RECONCILIATION OF NON-GAAP FINANCIAL MEASURES (Unaudited) Twelve Months Twelve Months Financial Leverage: Ended Ended (dollar amounts in thousands) June 30, 2008 June 30, 2007 381,992 379,470 Income from operations $ $ 32,268 34,180 Depreciation and amortization 414,260 413,650 EBITDA $ $ Short term debt 500,000 495,500 Current debt 2,730 2,632 Long term debt 742,693 838,485 Total debt $ 1,245,423 $ 1,336,617 3.0 3.2 Financial leverage ratio Three Months Six Months Free Cash Flow: Ended Ended (dollar amounts in millions) June 30, 2008 June 30, 2008 60.1 105.0 Net Income $ $ 6.7 13.6 Depreciation and amortization (53.2) (70.1) Accounts receivable (30.8) (3.9) Inventory Accounts payable 73.5 96.9 Other (10.3) (3.5) Cash flow provided by operations $ 46.0 $ 138.0 Less: Capital expenditures (8.3) (19.6) 37.7 118.4 Free cash flow $ $ Note: Free cash flow is provided by the Company as an additional liquidity measure. Capital expenditures are deducted from operating cash flow to determine free cash flow. This amount represents excess funds available to management to service all of its financing needs.
- 2. WESCO INTERNATIONAL, INC. RECONCILIATION OF NON-GAAP FINANCIAL MEASURES (CONTINUED) (dollar amounts in millions) (Unaudited) Three Months Three Months Ended Ended Gross Profit: June 30, 2008 June 30, 2007 1,587.8 1,518.1 Net sales $ $ Cost of goods sold (excluding 1,277.4 1,210.0 depreciation and amortization) 310.4 308.1 Gross profit $ $ 19.5% 20.3% Gross margin Six Months Six Months Ended Ended June 30, 2008 June 30, 2007 3,053.0 2,968.7 Net sales $ $ Cost of goods sold (excluding 2,447.0 2,361.6 depreciation and amortization) 606.0 607.1 Gross profit $ $ 19.8% 20.5% Gross margin Note: Gross profit is provided by the Company as an additional financial measure. Gross profit is calculated by deducting cost of goods sold, excluding depreciation and amortization, from net sales. This amount represents an important financial measure within the distribution industry. Gross margin is calculated by dividing gross profit by net sales.